내 기준, 다 가진 사람💜 잘생겼는데 생각도 잘생김-

1. Seaborn 공식문서
https://seaborn.pydata.org/examples/index.html
2. Seaborn?
- matplotlib 기반 고급화된 시각화 라이브러리
- 데이터프레임과 연결이 쉬움 (=pandas와 연결이 쉬움)
- 색상과 스타일이 조금 꾸며져서 표현
- 별도의 스타일 조정없이 보기 좋은 그래프를 그릴 수 있음
- 이 또한, 그래서 커스텀에 한계가 있음
3. seaborn을 alias 지정
import seaborn as sns4. 사용법
# 데이터 생성
x = np.linspace(0, 15, 100)
y1 = np.sin(x)    #  그래프가 겹치지 않게 y1-y4 임의값 사용
y2 = 2 + np.sin(x * 0.5)
y3 = 3 + np.sin(x * 1.2)
y4 = 4 + np.sin(x * 1.5)
# fig: 도화지, ax: 내용
fig, ax = plt.subplots(figsize=(5, 5))
ax.plot(x, y1)
ax.plot(x, y2)
ax.plot(x, y3)
ax.plot(x, y4)
ax.grid()
ax.set(title="seaborn", xlabel="istp", ylabel="intp")
plt.show()output: 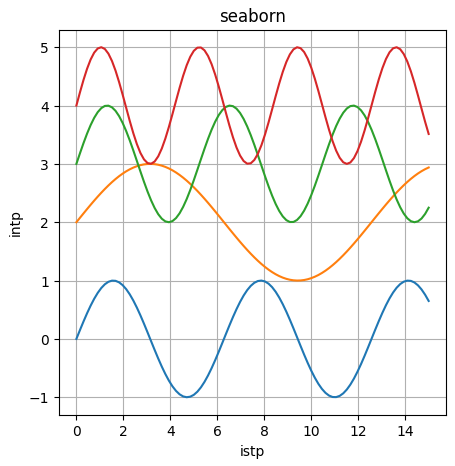
- (1, 4)의 형태로 각기 다른 그래프 형태 출력 가능
fig, ax = plt.subplots(nrow=1, ncols=4)

ax[0].plot(x, y1)
ax[1].bar(x, y2)
ax[2].scatter(x, y3)
ax[3].hist(x, y4)

plt.show()
output: 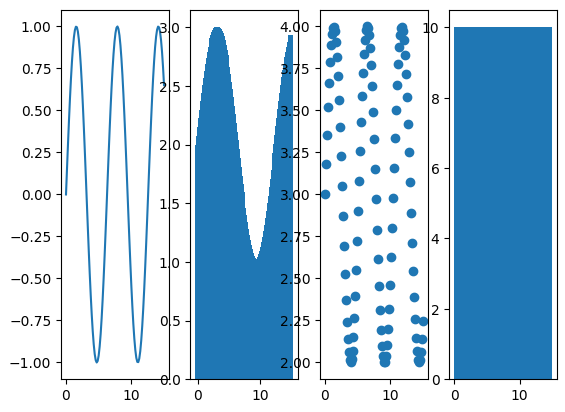
- 2 x 2로 가능
fig, ax = plt.subplots(2, 2)

# matrix[행, 열]
ax[0,0].plot(x, y1)
ax[0,1].plot(x, y2)
ax[1,0].plot(x, y3)
ax[1,1].plot(x, y4)

plt.show()
output: 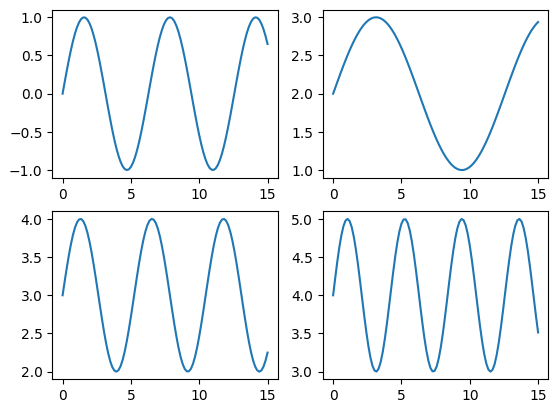
by Heidi J. 꼬꼬마 데분가 💜

꼬꼬마 데분가😎