오늘은 다양한 주제들로 matplotlib과 seaborn을 활용하여
다양한 시각화를 해 본 결과를 가져왔습니다! 같이 보실까요~!
II. 주제별 시각화
import numpy as np
import pandas as pd
import matplotlib.pyplot as plt
import seaborn as sns
from matplotlib import rc

plt.rcParams["axes.unicode_minus"] = False
rc("font", family="Arial Unicode MS")
%matplotlib inline
1. 언어별 총 출판량 순위
먼저 지금까지 얻은 데이터를 바탕으로 가장 단순하게 순위를 매겨보았습니다.
# 책 개수 데이터 프레임으로 저장

book_num = result_final['언어'].value_counts()
book_num = pd.DataFrame(book_num)
book_num.rename(columns={'언어':'책 개수'},inplace=True)
book_num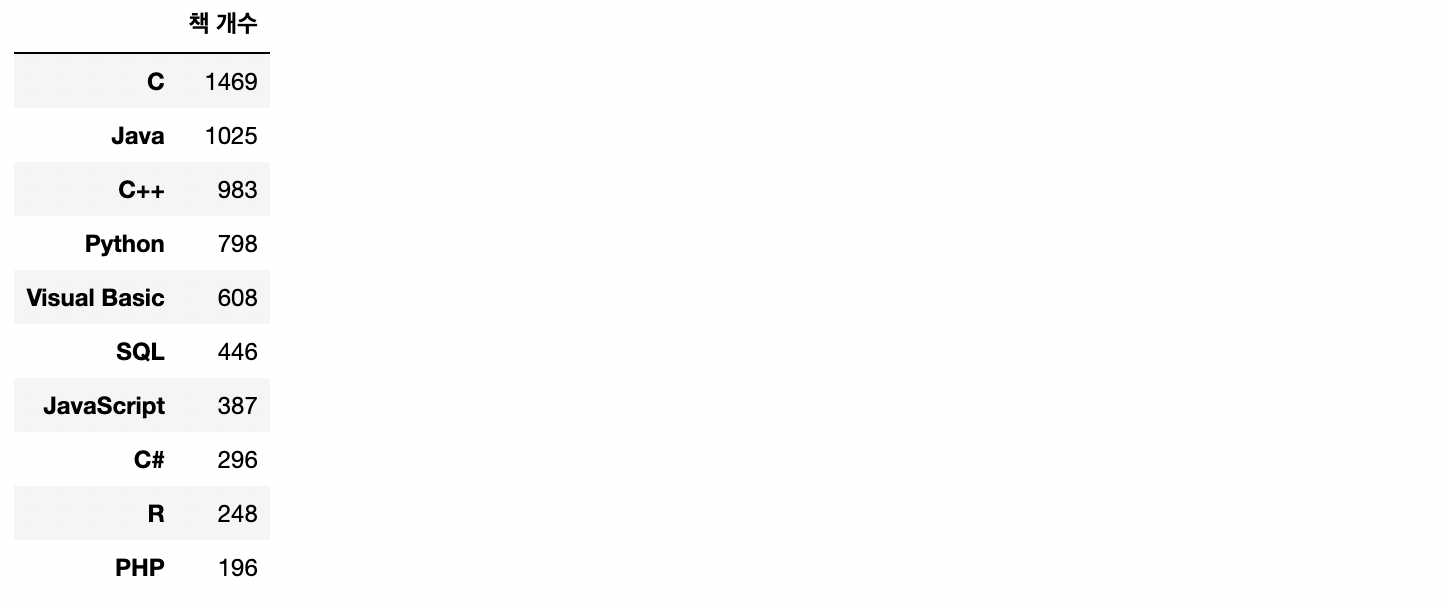
# 막대 그래프 그리기
plt.style.use('ggplot')
fig = plt.figure(figsize=(14,8))
ax = fig.add_subplot(111)
colors = sns.color_palette('pastel',len(book_num.index))

ax.bar(book_num.index, book_num['책 개수'], color=colors)
plt.title('언어별 책 검색 수(IT전문서)', fontsize=24)
plt.xticks(fontsize=16, weight='bold')
plt.yticks(fontsize=16, weight='bold')
plt.show()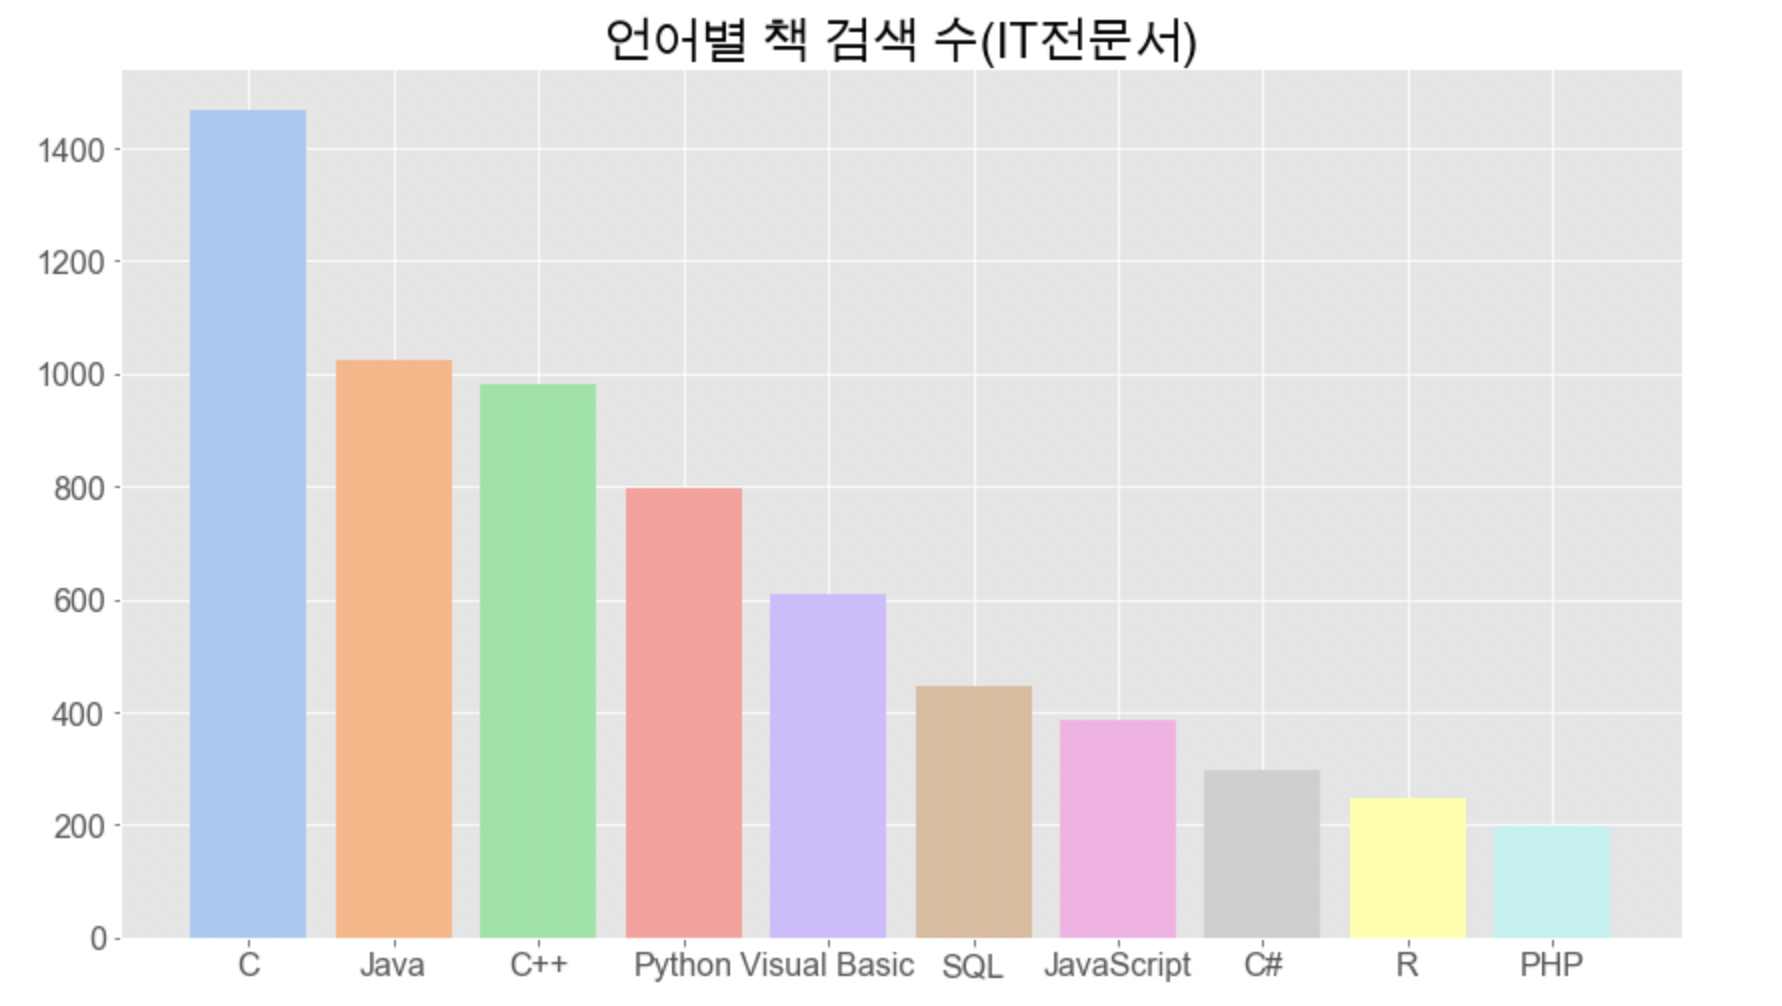
이를 올해(2021)의 TIOBE INDEX와 비교하면 다음과 같습니다.
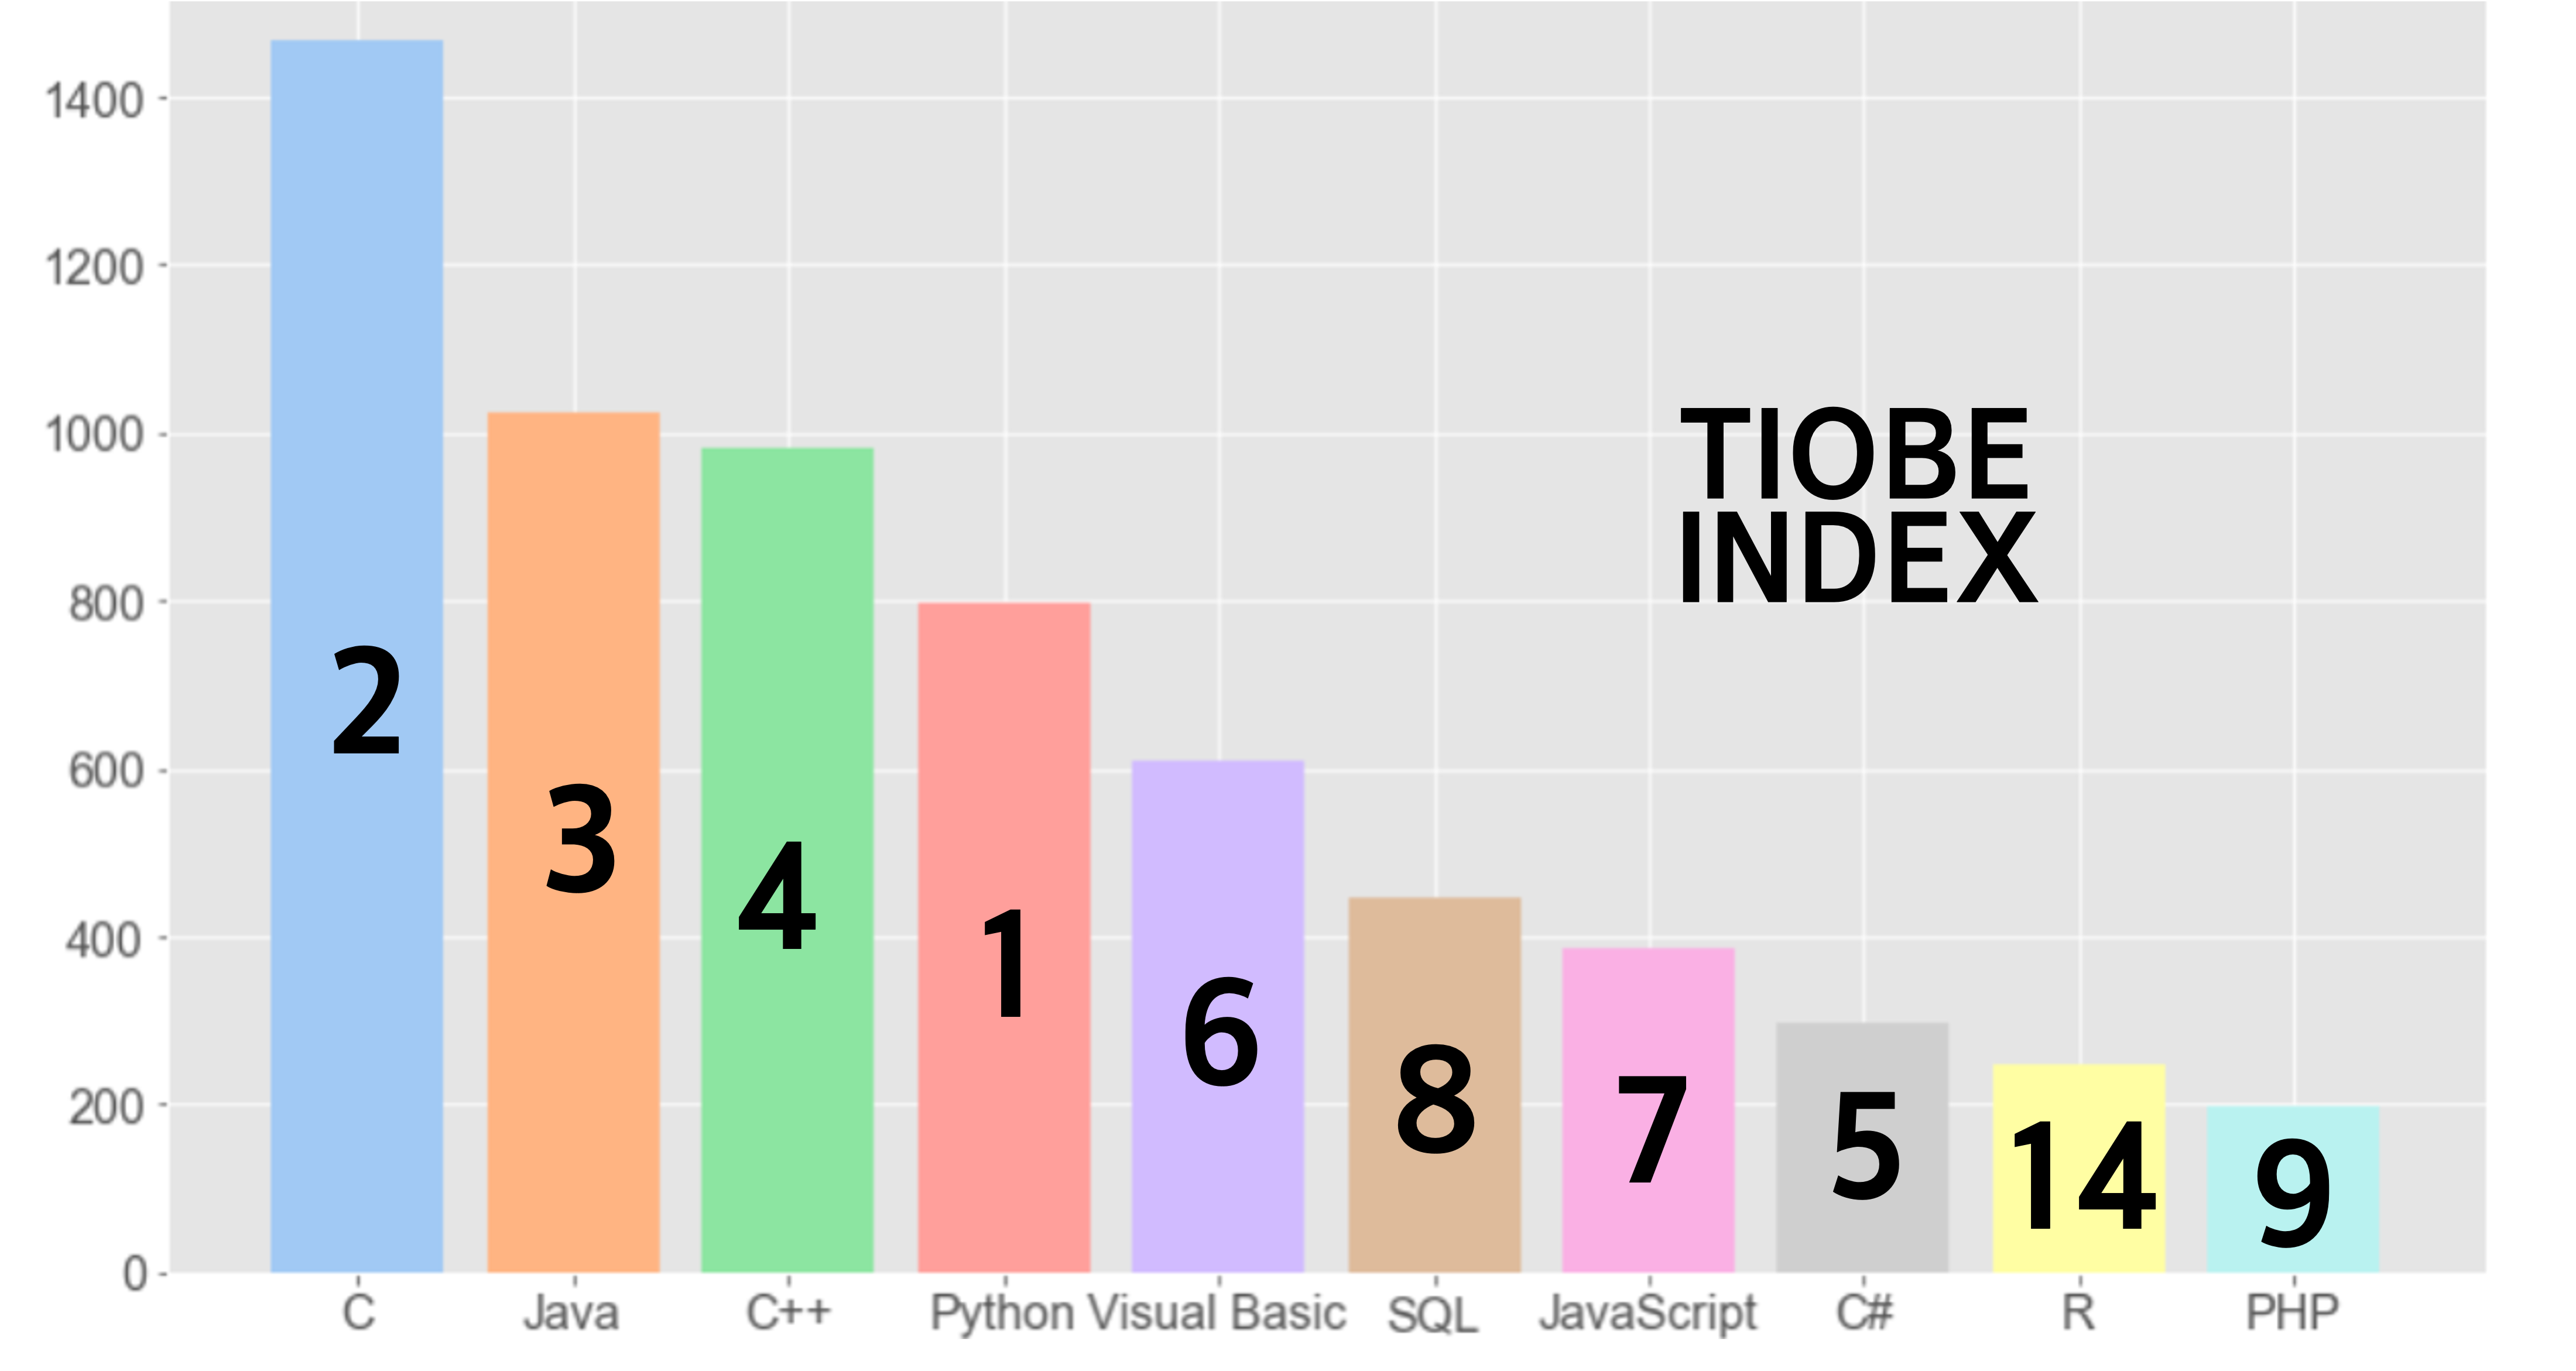
작년 순위와 비교하면 다음과 같습니다.
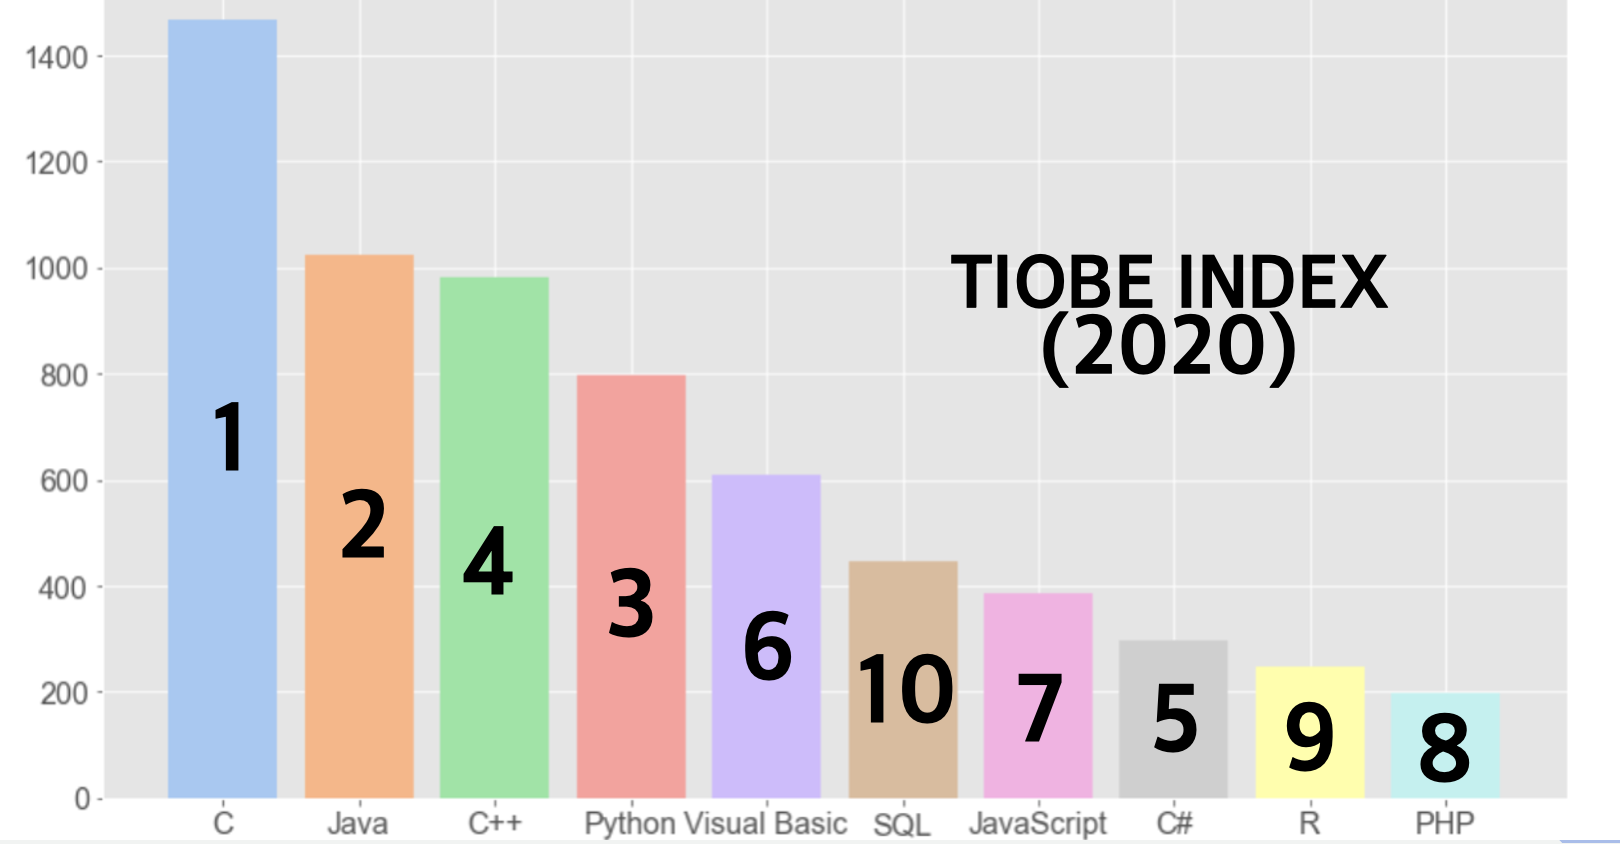
아직은 C가 가장 출판된 서적이 많지만, 이 기세로 간다면 파이썬이 무서운 속도로 따라잡을 수 있겠다는 생각이 듭니다.
2. 국내 IT서적 출판사 언어별 출판량 순위
이번에는 출판사에 주목하여, 우리나라 컴퓨터 언어 관련 출판사에서 각 언어별로 출판된 책의 양을 순위 매겨보았습니다
1) 한국/해외 출판량
도서의 고유 번호인 ISBN에는 출판 국가의 코드가 담겨있습니다.
한국은 '89'와 '11'입니다.
ISBN은 13자리와 10자리 이렇게 두 종류가 있는데,
13자리는 4-5번째, 10자리는 1-2번째 숫자가 국가코드를 나타냅니다.
저는 더 먼저 표기된 10자리를 이용하였습니다.
# ISBN이 없는 데이터 제거

for idx, row in result_final.iterrows():
    if row['ISBN'] == '':

        print(idx, row['ISBN'], row['출판사'])
3387 에이콘출판# 국내 코드가 담긴 데이터 조회
korea = []
for idx, row in result_final.iterrows():
if row['ISBN'][:2] in ['89','11']:
korea.append(idx)
len(korea)5970# 출판국가 정보 리스트에 담아주기
pub_nation = []
for idx, row in result_final.iterrows():
if row['ISBN'][:2] in ['89','11']:
pub_nation.append('한국')
else:
pub_nation.append('해외')
len(pub_nation)6456# 컬럼 추가
result_final['출판국가'] = pub_nation
result_final.head(2)
# 그래프 그리기 위해 df 생성
pub_nat = result_final['출판국가'].value_counts()
pub_nat = pd.DataFrame(pub_nat)
pub_nat
# 막대 그래프 그리기

plt.style.use('ggplot')
plt.figure(figsize=(8,7))
colors = sns.color_palette('hls',len(pub_nat.index))

plt.bar(pub_nat.index, pub_nat['출판국가'], color=colors)
plt.title('출판국가', fontsize=20)
plt.xticks(fontsize=18, weight='bold')
plt.yticks([0,1000,3000,5000,7000],fontsize=16, weight='bold')
plt.ylim(0,7000)
plt.show()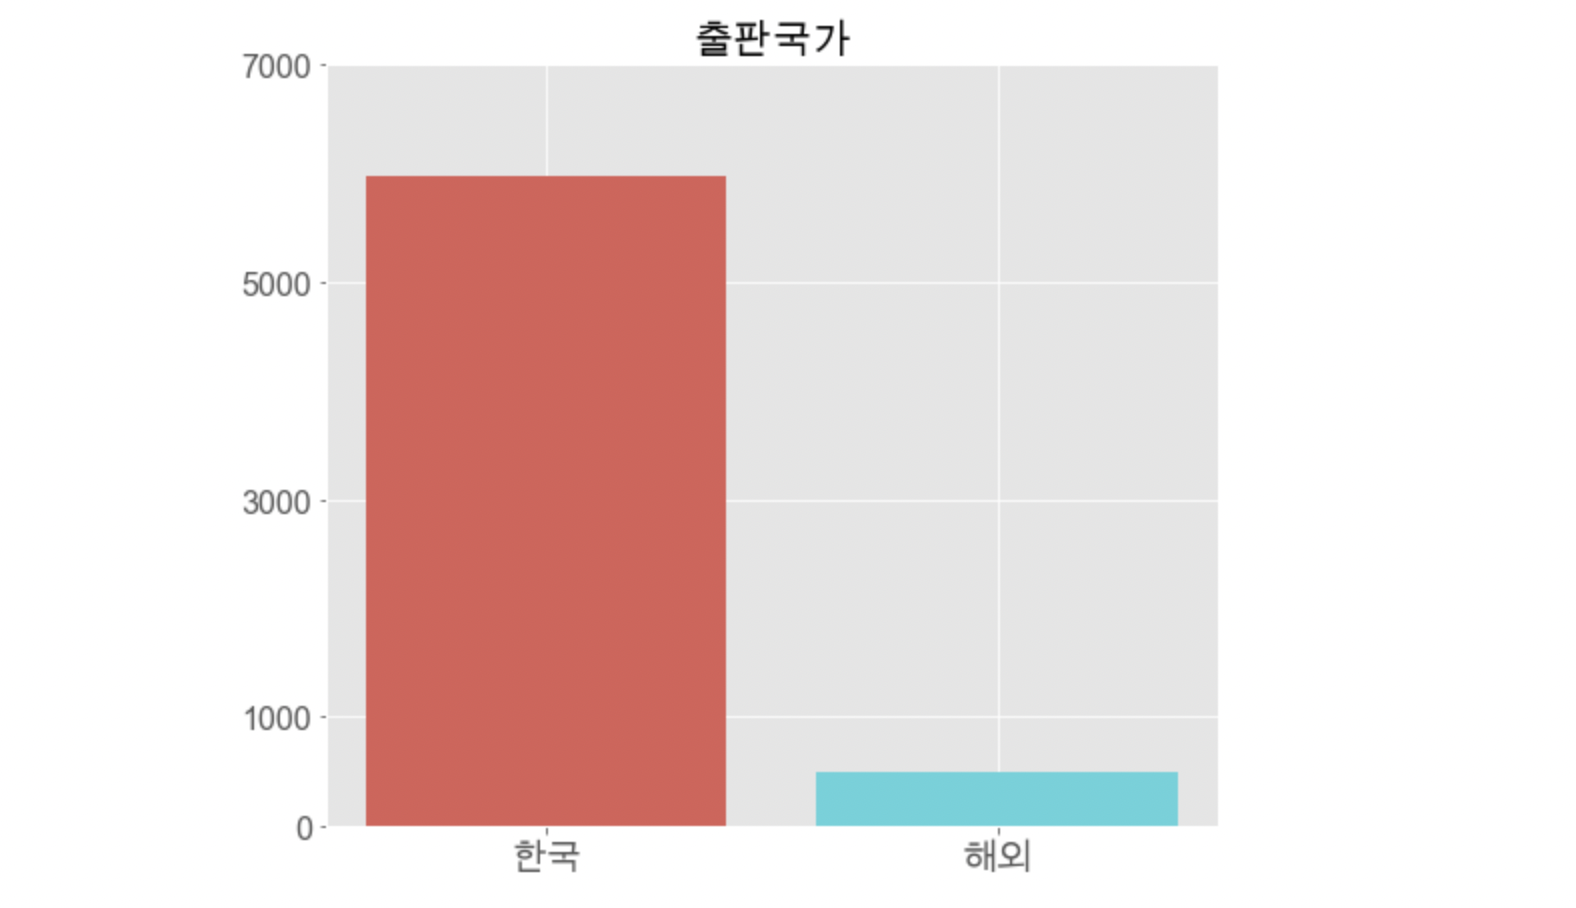
2) 출판사별 출판량
# 출판사별 데이터 개수 확인
publisher_num = result_final['출판사'].value_counts()
publisher_df = pd.DataFrame(publisher_num)
publisher_df.rename(columns={'출판사':'출판수'},inplace=True)
publisher_df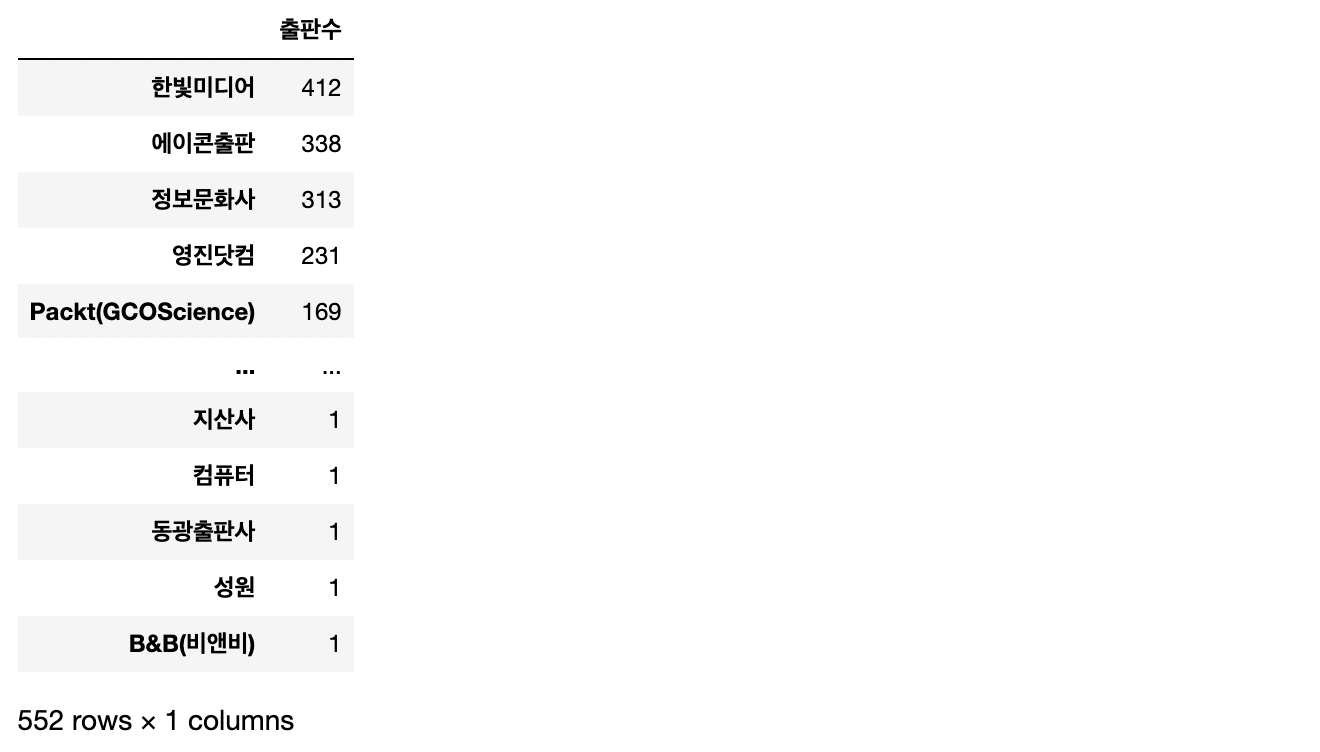 총 552개의 출판사
✔️ 출판사 raw data로 그래프 그려보기
plt.style.use('ggplot')
fig = plt.figure(figsize=(20,10))
colors = sns.color_palette('pastel')

plt.bar(publisher_df.index, publisher_df['출판사'], color=colors)
plt.title('출판사별 출판 책 수', fontsize=20)
plt.yticks(fontsize=16, weight='bold')
plt.xticks(fontsize=1)
plt.ylim(0,420)
plt.show()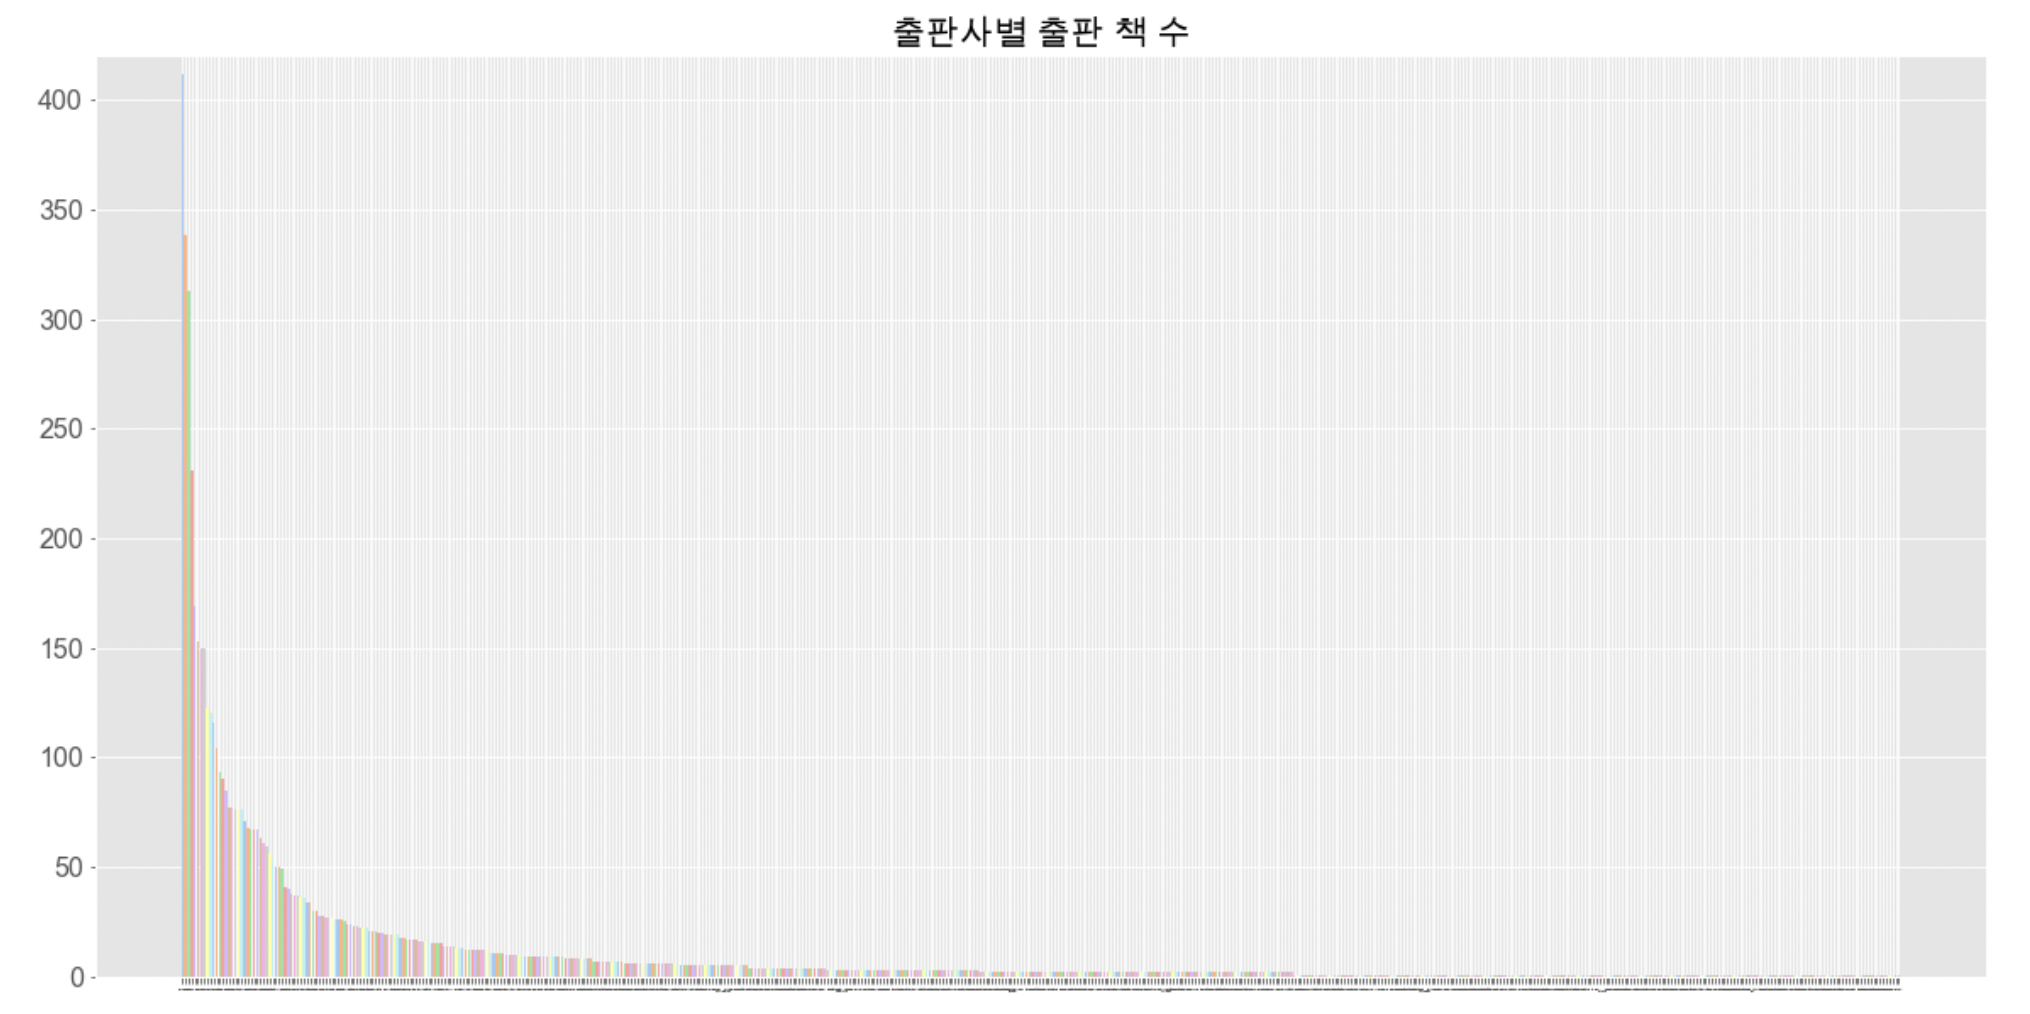
➡️ 책을 적게 출판한 출판사가 대부분을 차지하네요.
# 한 권만 출판한 출판사
pub_1book = []

for idx, row in publisher_df.iterrows():
    if row['출판수'] == 1:
        pub_1book.append(idx)
len(pub_1book)
195
# 5권 이하 출판한 출판사
pub_5book = []

for idx, row in publisher_df.iterrows():
    if row['출판수'] <= 5:
        pub_5book.append(idx)
len(pub_5book)
392
# 100권 이상 출판한 출판사
pub_100_book = []

for idx, row in publisher_df.iterrows():
    if row['출판수'] >= 100:
        pub_100_book.append({
            '출판사' : idx,
            '출판수' : row['출판수']
        })
pub_100_df = pd.DataFrame(pub_100_book)
pub_100_df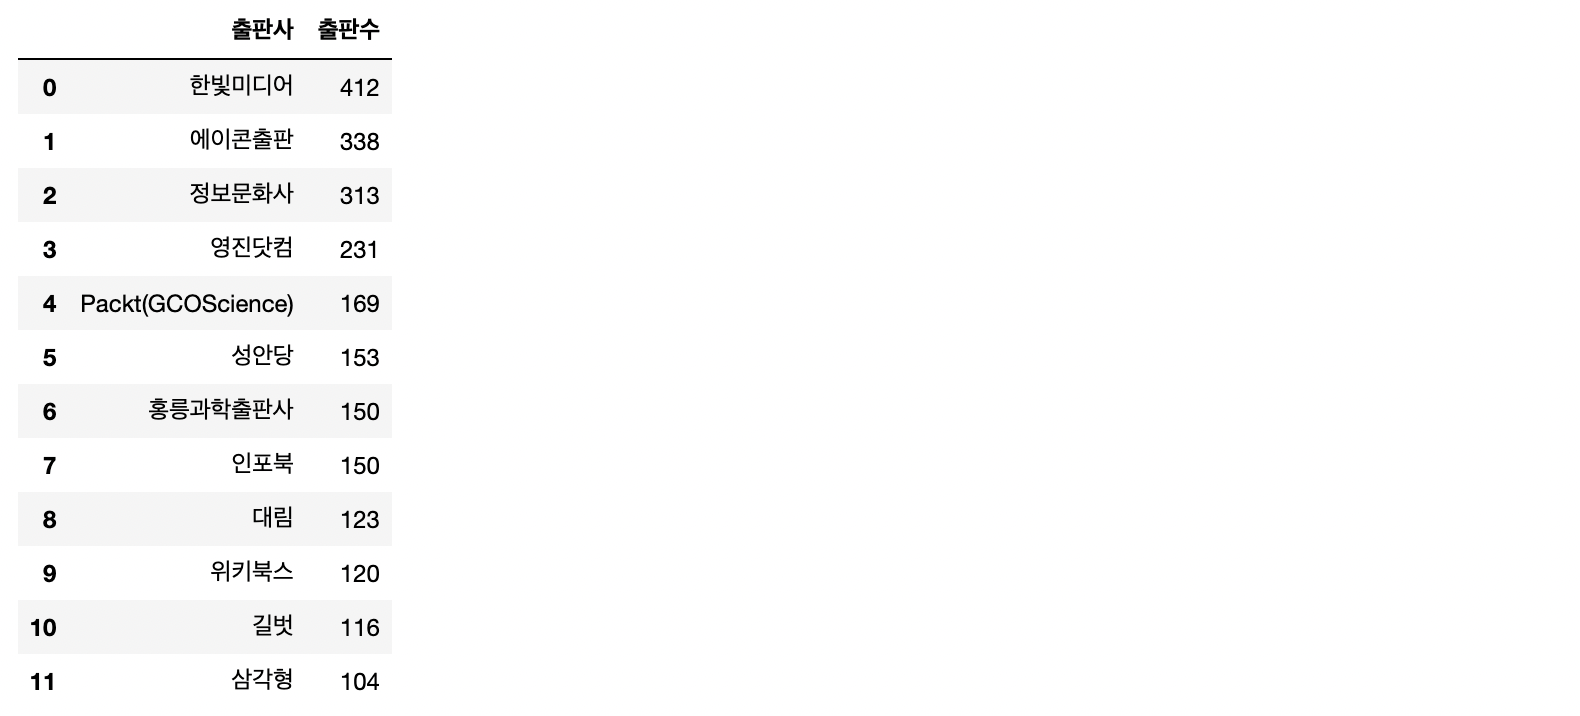
# 상위 10개 출판사
pub_top10 = pub_100_df.head(10)

# 그래프 그리기
plt.style.use('ggplot')
fig = plt.figure(figsize=(20,10))
colors = sns.color_palette('pastel')

plt.bar(pub_top10['출판사'], pub_top10['출판수'], color=colors)
plt.title('TOP 10 국내 IT 서적 출판사', fontsize=30)
plt.yticks(fontsize=16, weight='bold')
plt.xticks(fontsize=16)
plt.ylim(0,420)
plt.show()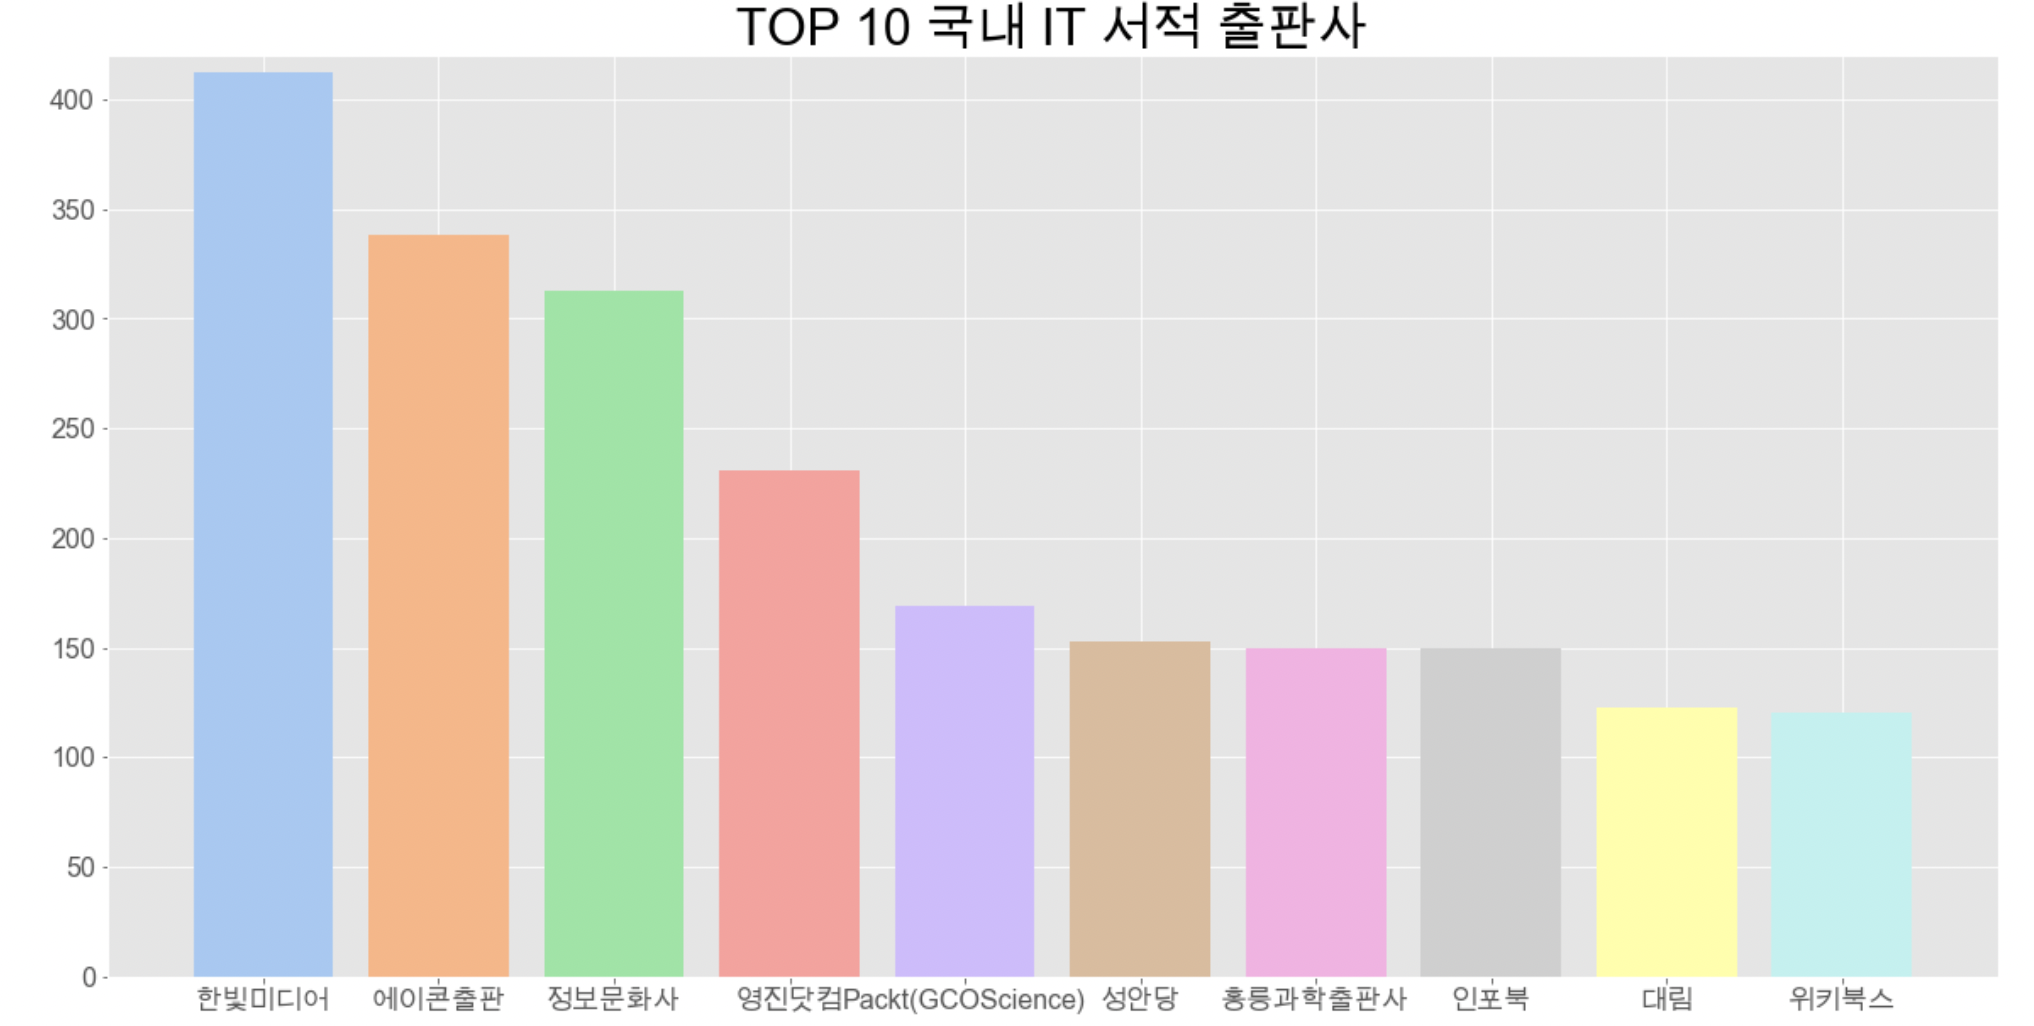
3) 출판사별 각 언어 출판량(핵심❗️)
피벗테이블을 활용하여 출판사별로 각 언어들의 출판량은 어떻게 되는지를 누적그래프로 나타내보고 싶었습니다.
# 피벗테이블 생성
publisher_pivot = result_final.pivot_table(index='출판사',columns='언어', values='ISBN',aggfunc=np.count_nonzero)
publisher_pivot
# 각 행 별 합계 컬럼 추가(행별 합계는 axis=1, 열별 합계는 axis=0)
publisher_pivot['sum'] = publisher_pivot.sum(1)


# 합계 컬럼을 기준으로 내림차순 정렬 - 상위 15개
pub_pv = publisher_pivot.sort_values(by='sum',ascending=False).head(15)
pub_pv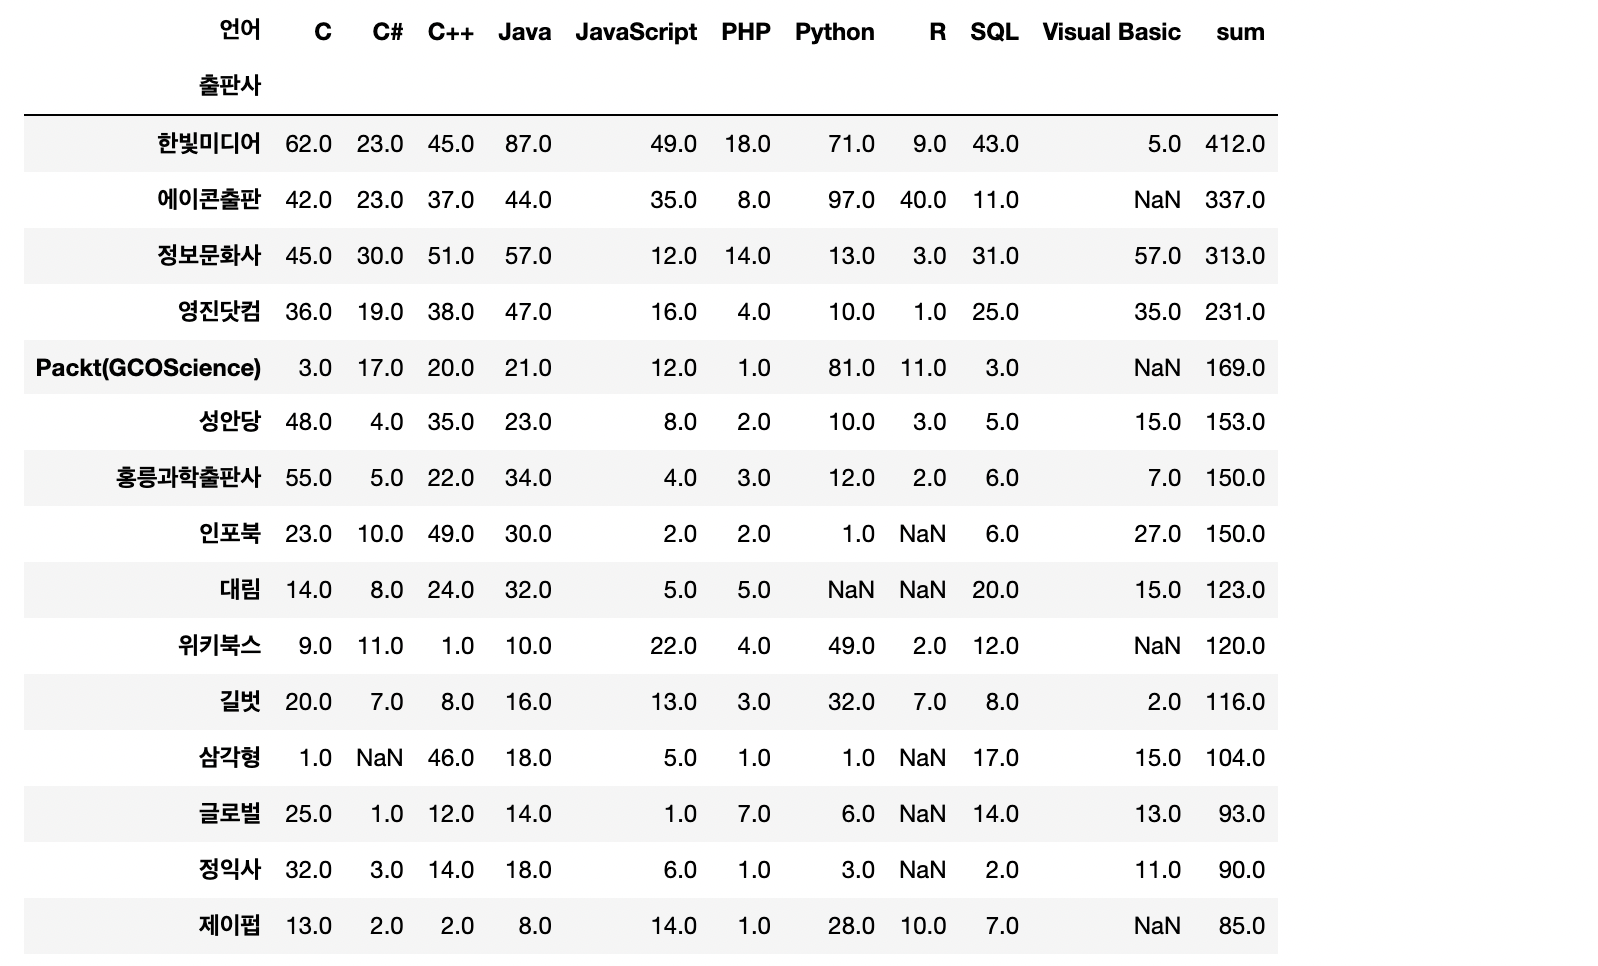
# nan값 0으로 처리

pub_pv.fillna(0, inplace=True)
pub_pv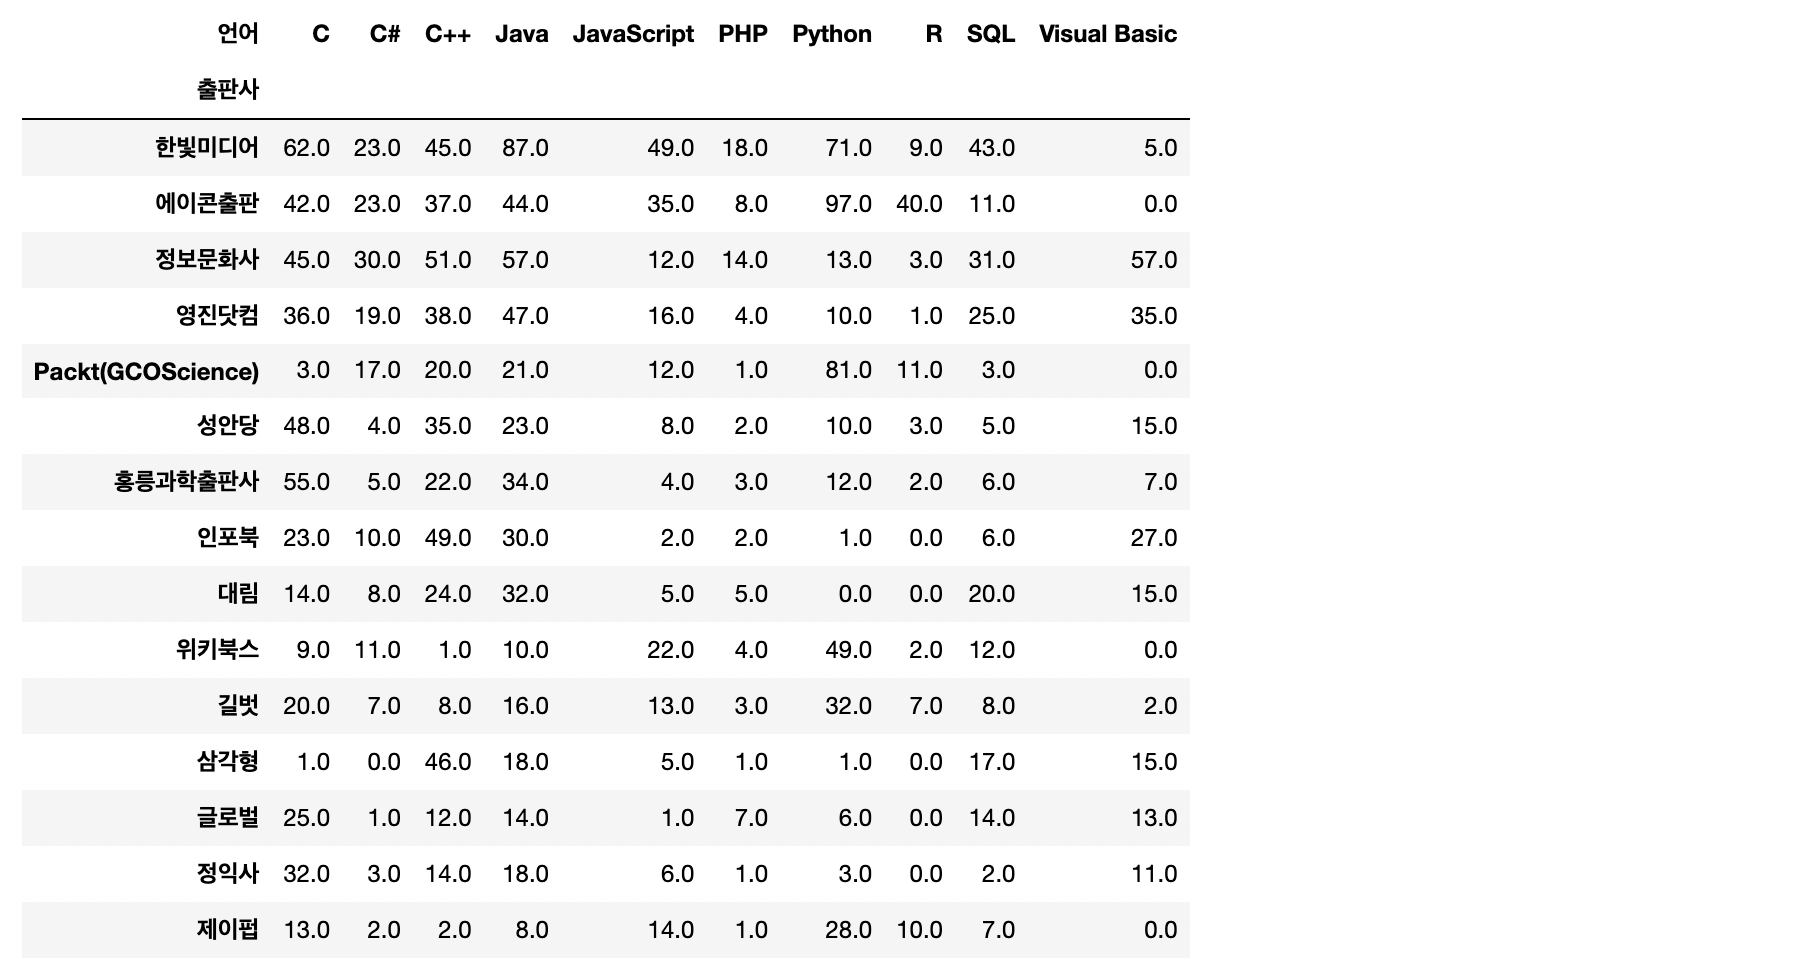
# 언어 목록 리스트에 담아주기
pub_col = list(tiobe['language'])
# 누적그래프 그려보기(이게 될까,,,, 두근 두근,,,)
plt.style.use('ggplot')
plt.figure(figsize=(16,10))
colors = sns.color_palette('Set3',10)
bott = 0
n = 0
for col in pub_col:
plt.bar(pub_pv.index, pub_pv[col], color=colors[n], bottom=bott, label=col)
n += 1
bott += pub_pv[col]
plt.legend(loc='upper right',fontsize=18)
plt.xticks(rotation=10)
plt.show()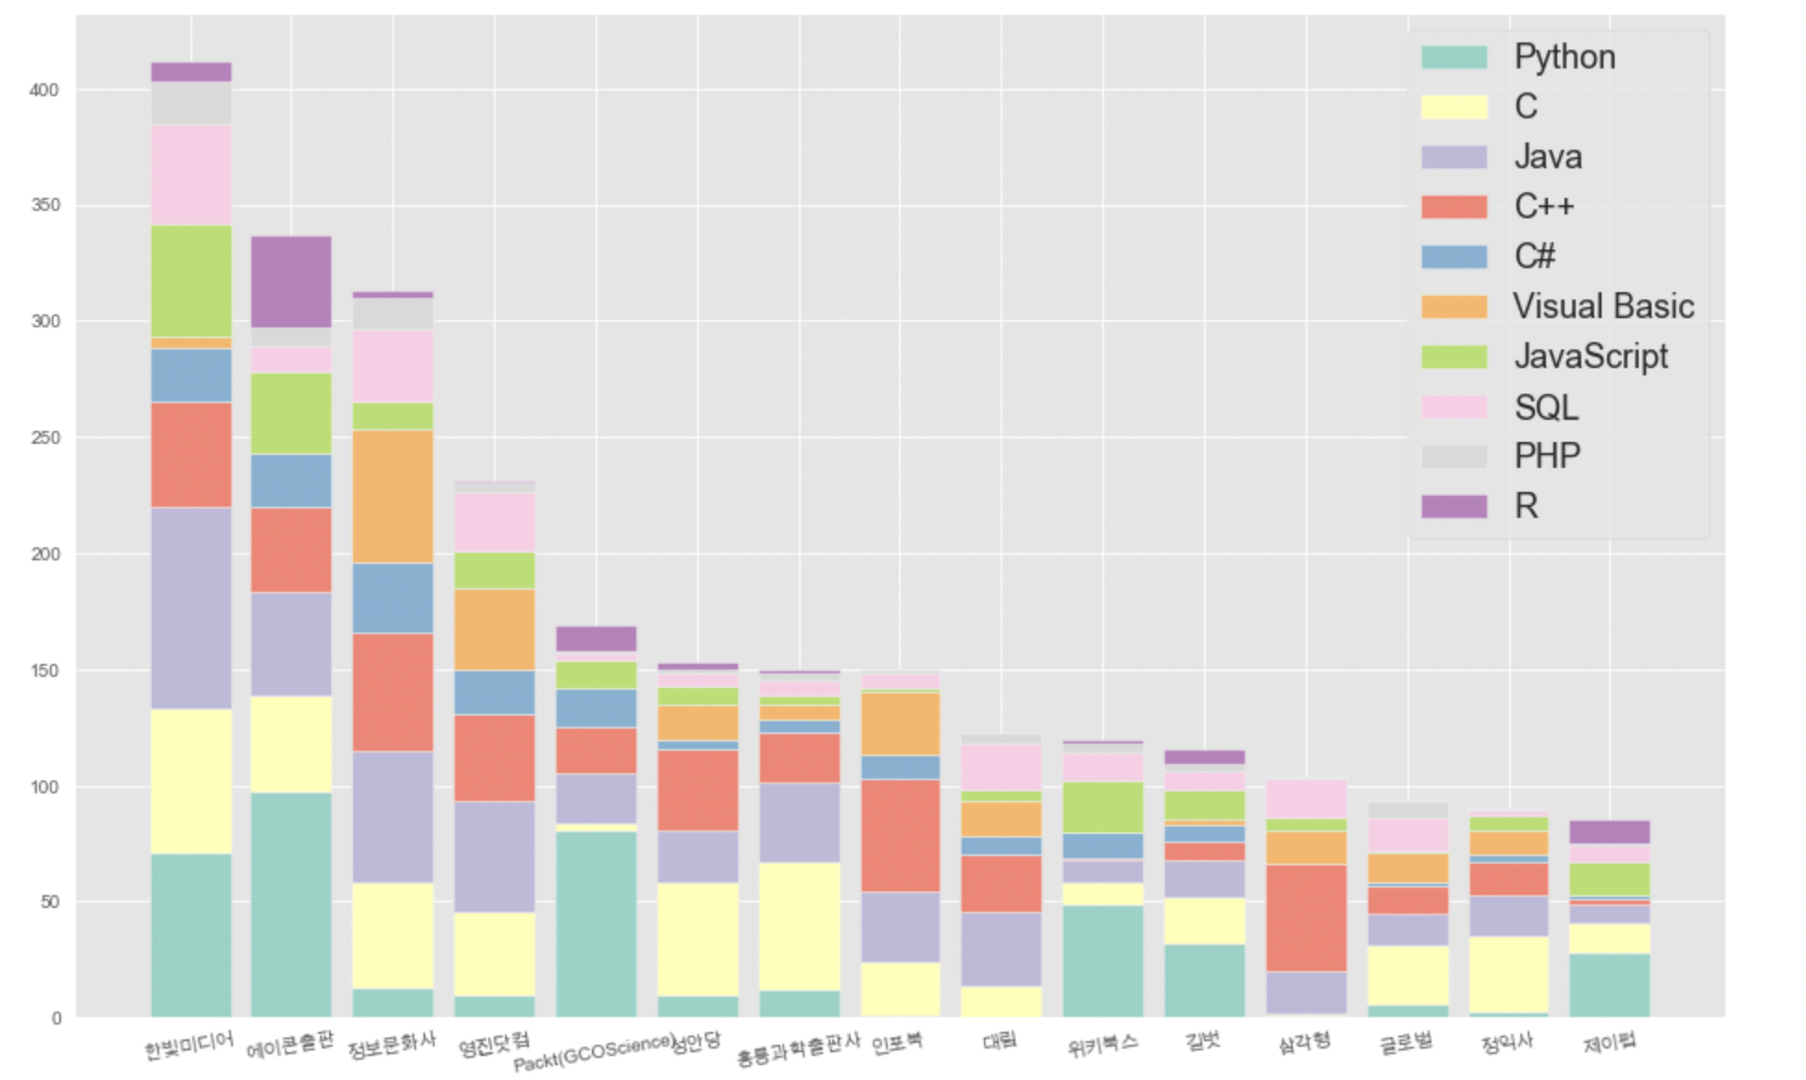 됐습니다!!!!!!
짜릿해,,, 이 맛에 코딩하는거겠죠,,,??!
3. 출판연도별 각 언어 출판량 비교
이번에는 '출판일'을 기준으로 연도별 각 언어 출판량이 어떻게 나타나고있는지를 볼까요?
1) 전체 vs 최근 2년(20-21)
# 20-21년도 데이터셋
result_20_21 = result_final.loc[result_final['출판일']>='20200101']
result_20_21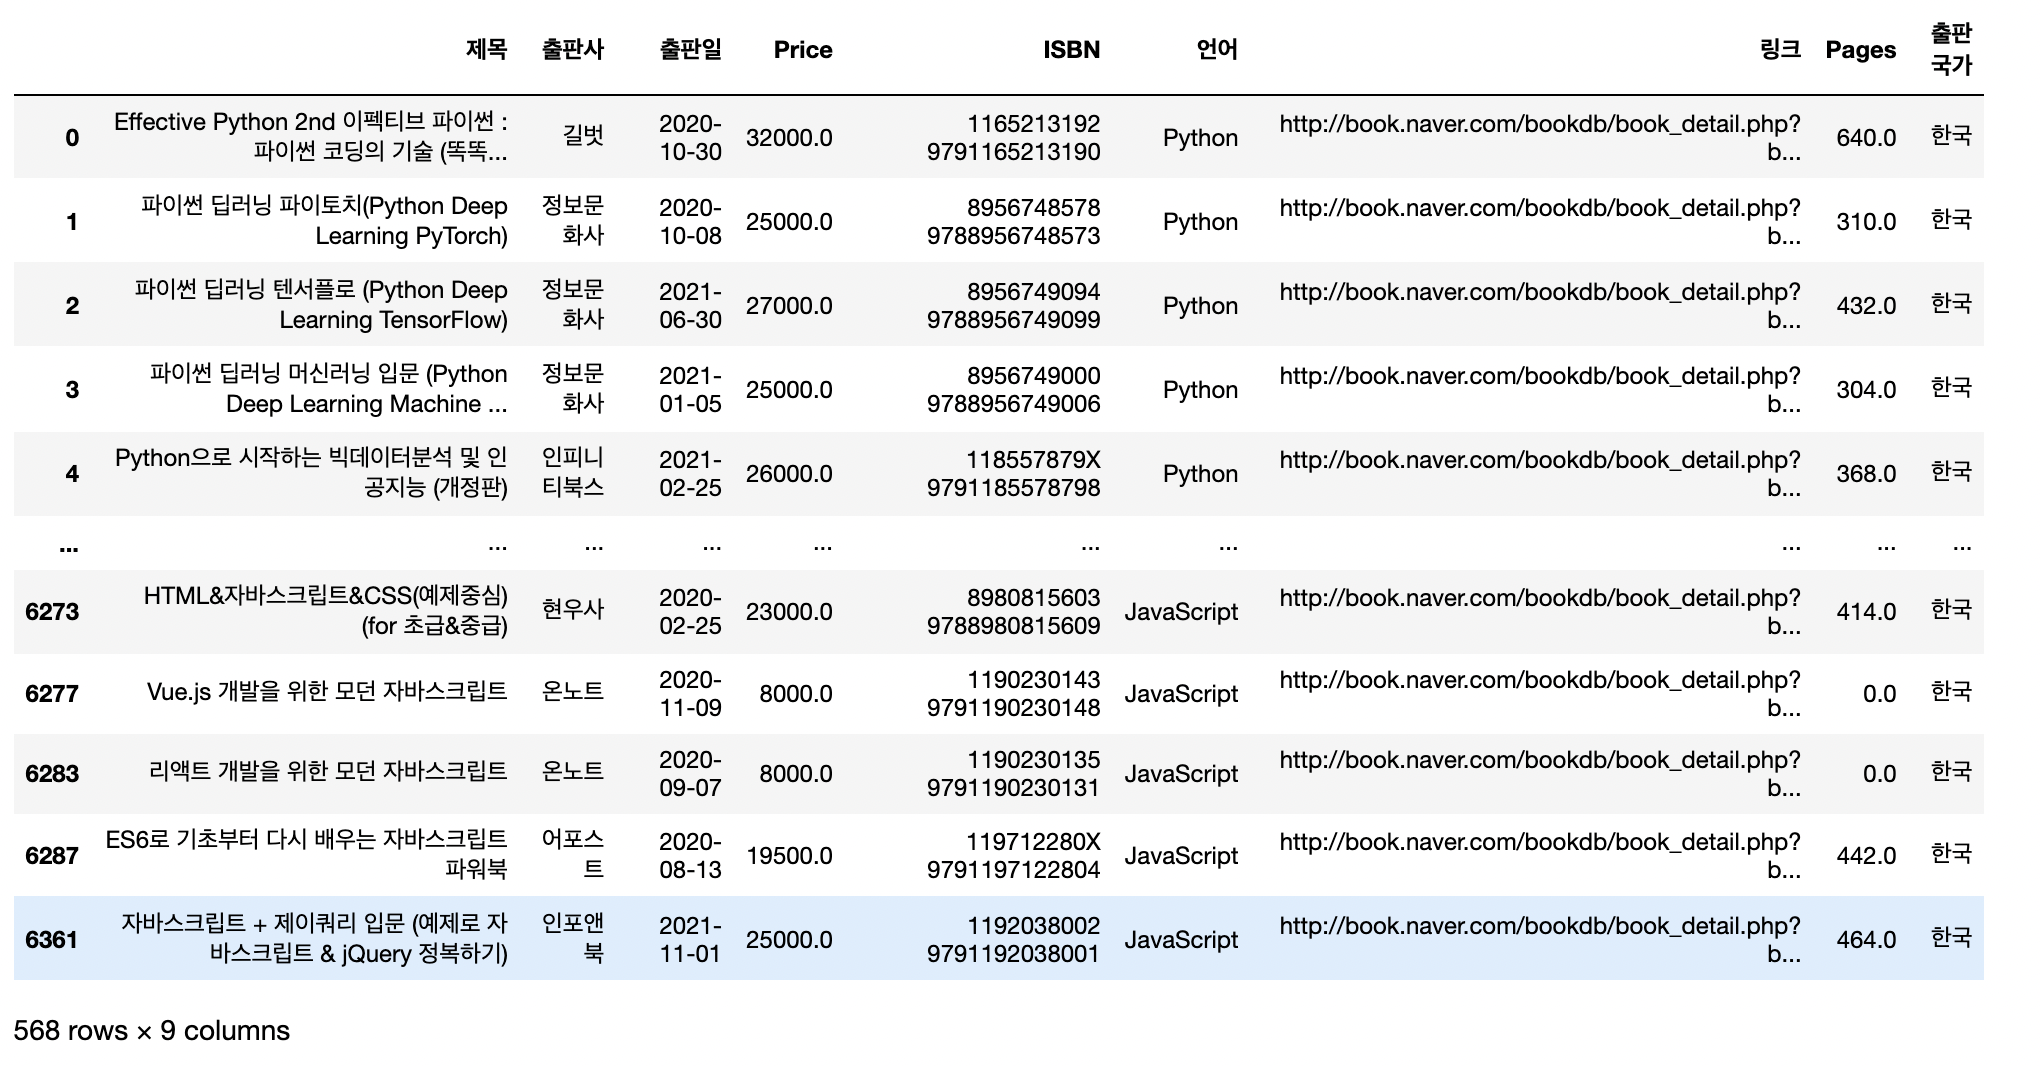
# 19년도 이전 데이터셋
result_19 = result_final.loc[result_final['출판일']<='20191231']
# 책 개수 데이터 프레임으로 저장(전체)
book_19 = result_19['언어'].value_counts()
book_19 = pd.DataFrame(book_19)
book_19.reset_index(inplace=True)
book_19.rename(columns={'언어':'19년 이전','index':'언어'},inplace=True)
# 책 개수 데이터 프레임으로 저장(20-21)
book_2021 = result_20_21['언어'].value_counts()
book_2021 = pd.DataFrame(book_2021)
book_2021.reset_index(inplace=True)
book_2021.rename(columns={'언어':'20-21','index':'언어'},inplace=True)
# 합쳐주기
book_year = pd.merge(book_19,book_2021,how='left',on='언어')# 막대 그래프 그리기
plt.style.use('ggplot')
plt.figure(figsize=(14,8))
plt.bar(book_year['언어'], book_year['19년 이전'], color='tab:blue',label='2019 이전')
plt.bar(book_year['언어'], book_year['20-21'], color='tab:orange',label='2020~2021')
plt.title('언어별 연도별 책 출판 수 비교', fontsize=24)
plt.legend(loc='upper center', fontsize=17)
plt.xticks(fontsize=15, weight='bold')
plt.yticks(fontsize=13, )
plt.show()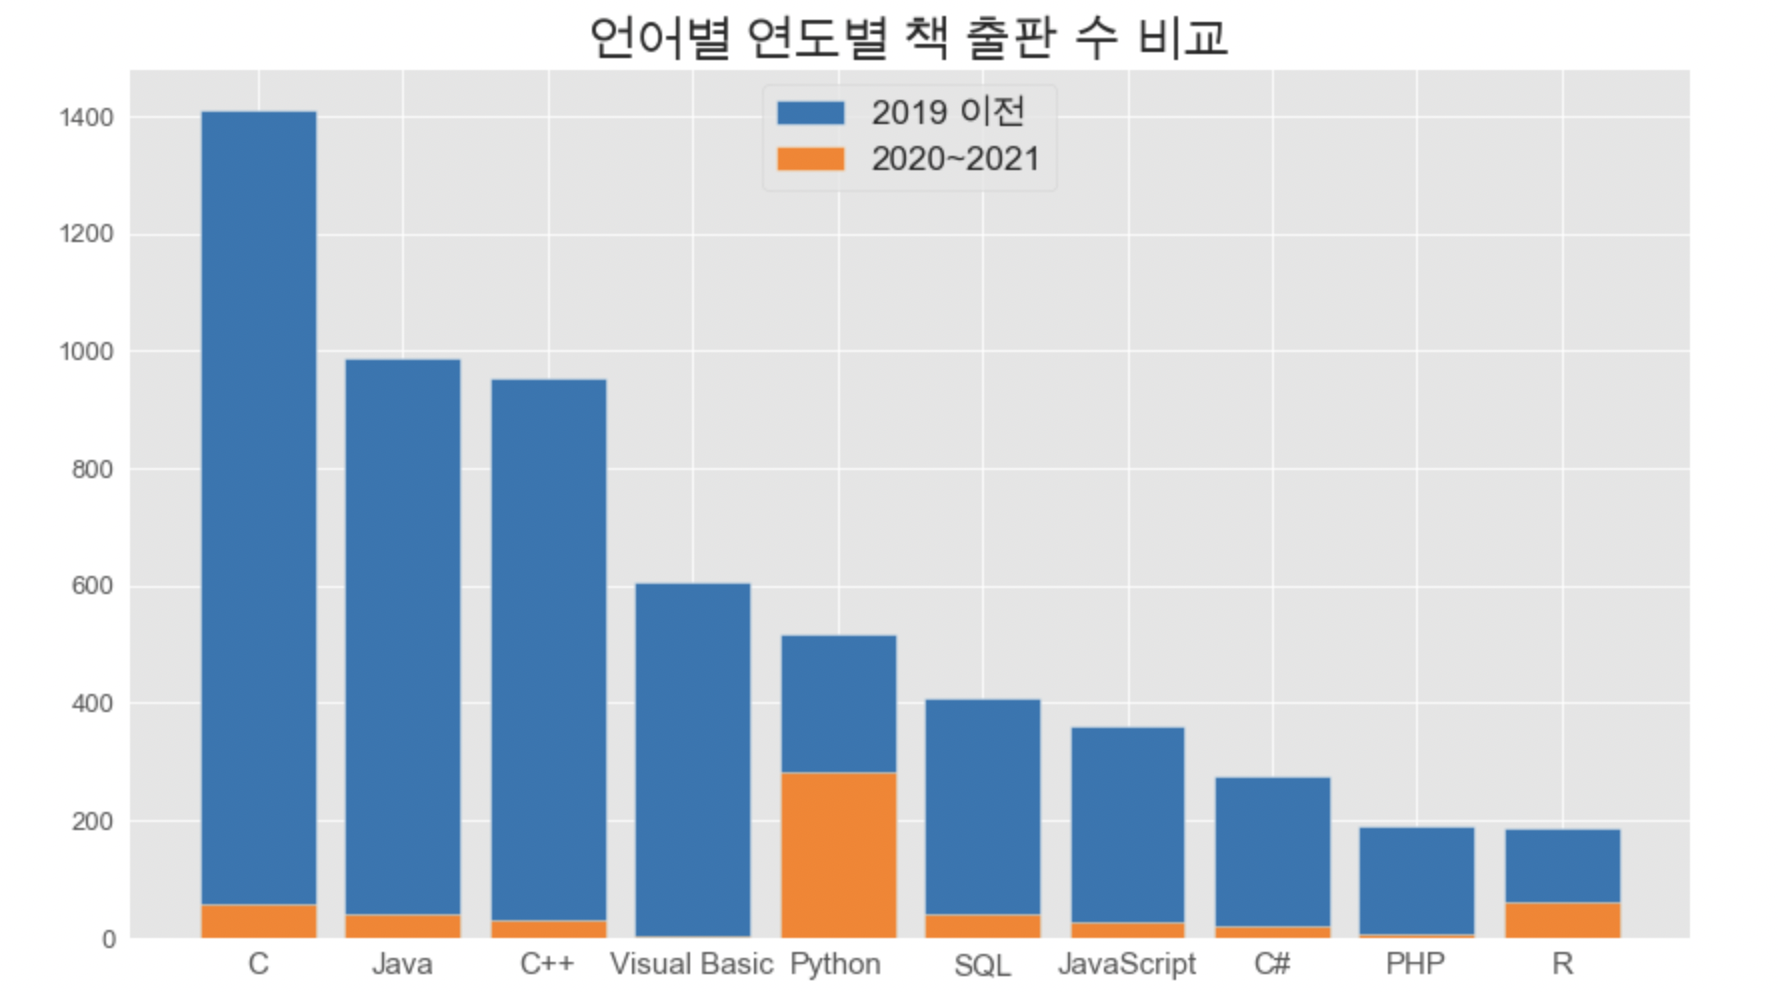
2) 최근 5년 데이터: 최근 2년(20-21) vs 그 전 3년(17-19)
# 최근 5년 데이터 추출
result_year = result_final.loc[result_final['출판일']>='20170101']
len(result_year)1607# 17-19년도 데이터셋
result_17_19 = result_year.loc[result_year['출판일']<='20191231']
result_17_19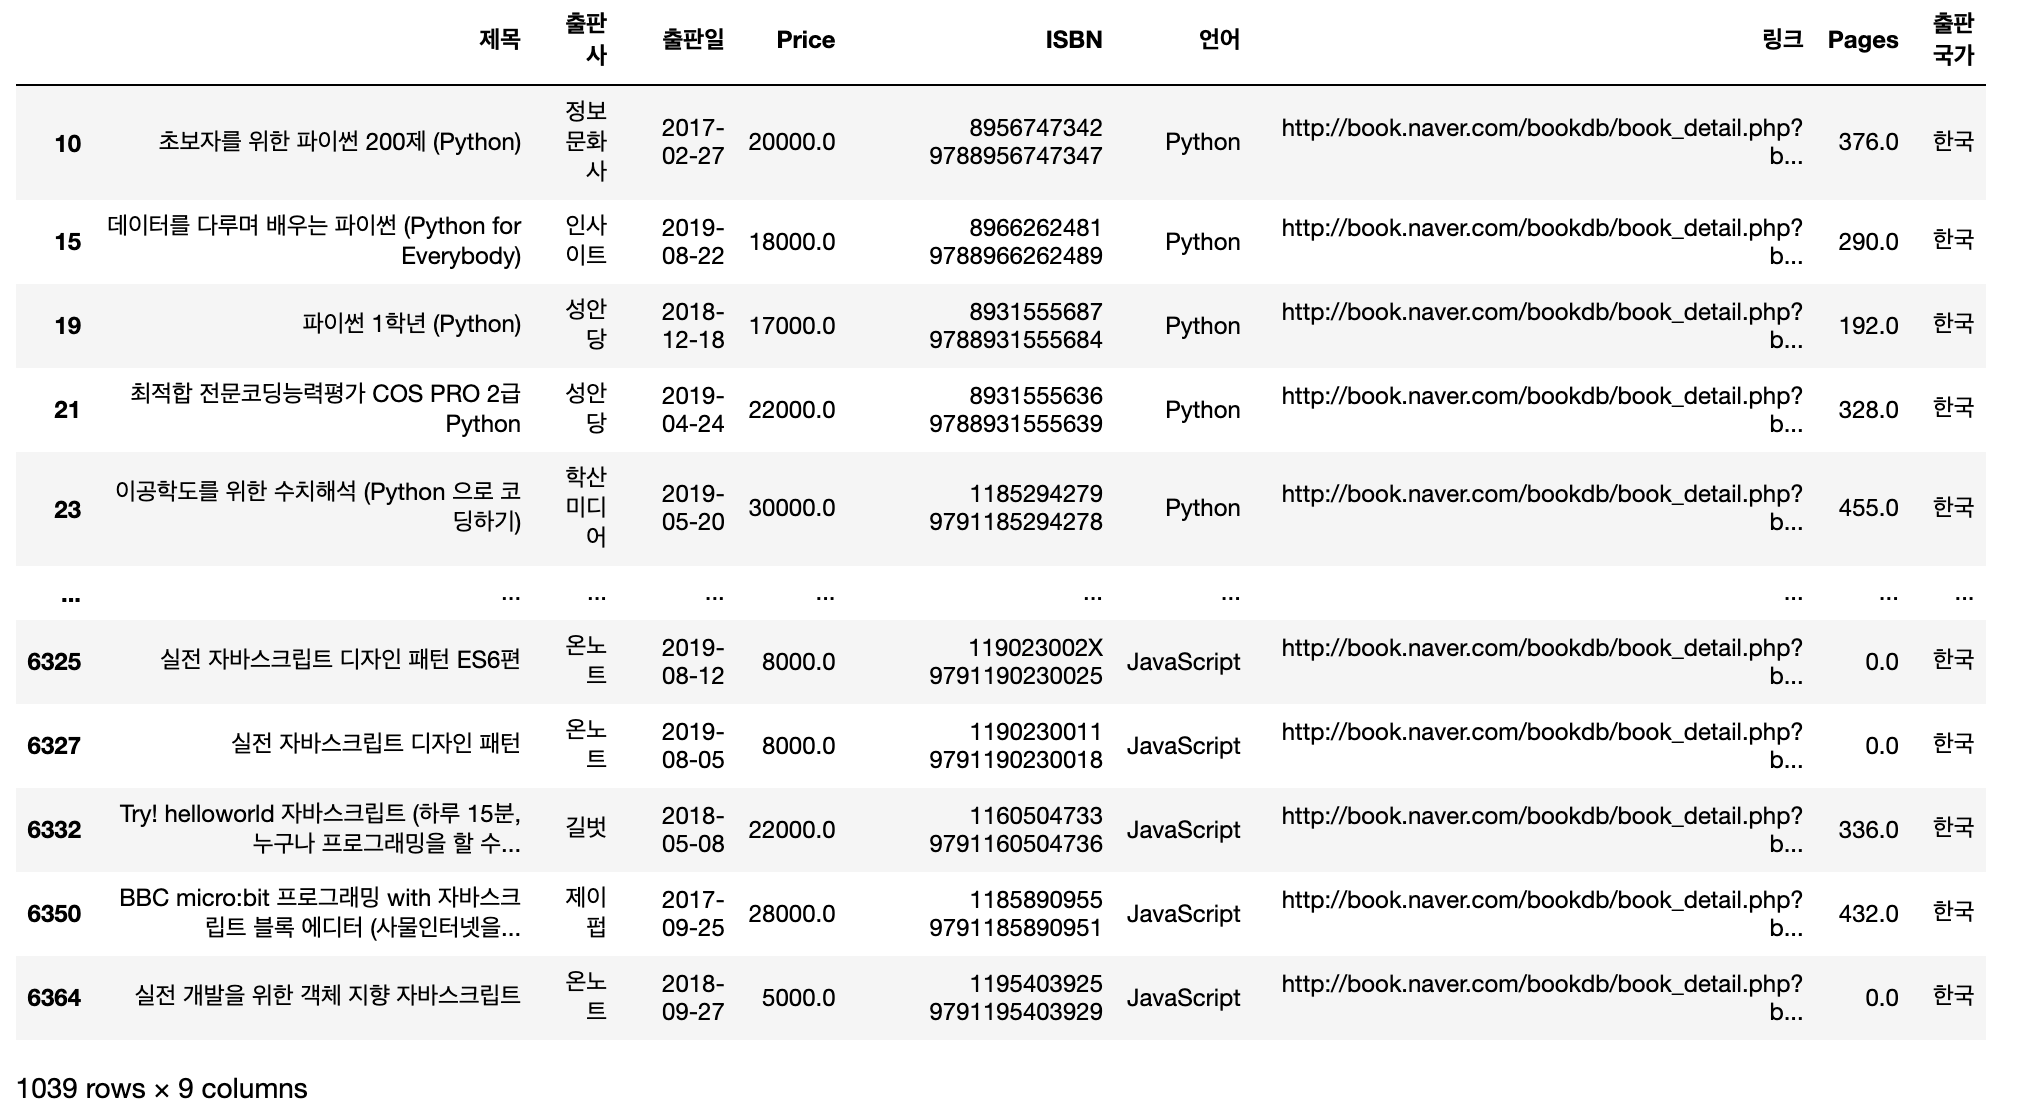
# 책 개수 데이터 프레임으로 저장(17-19)
book_1719 = result_17_19['언어'].value_counts()
book_1719 = pd.DataFrame(book_1719)
book_1719.reset_index(inplace=True)
book_1719.rename(columns={'언어':'17-19','index':'언어'},inplace=True)


# 합쳐주기
book_year = pd.merge(book_1719,book_2021,how='left',on='언어')
# 20-21 내림차순
book_year.sort_values(by='20-21',ascending=False)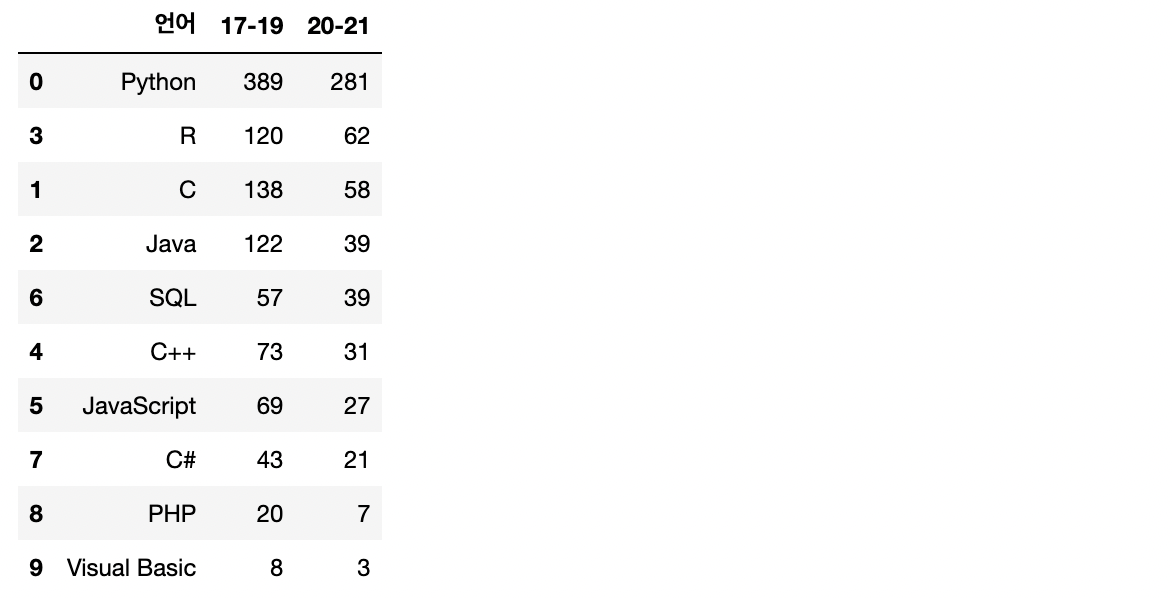
# 17-19 내림차순
book_year.sort_values(by='17-19',ascending=False)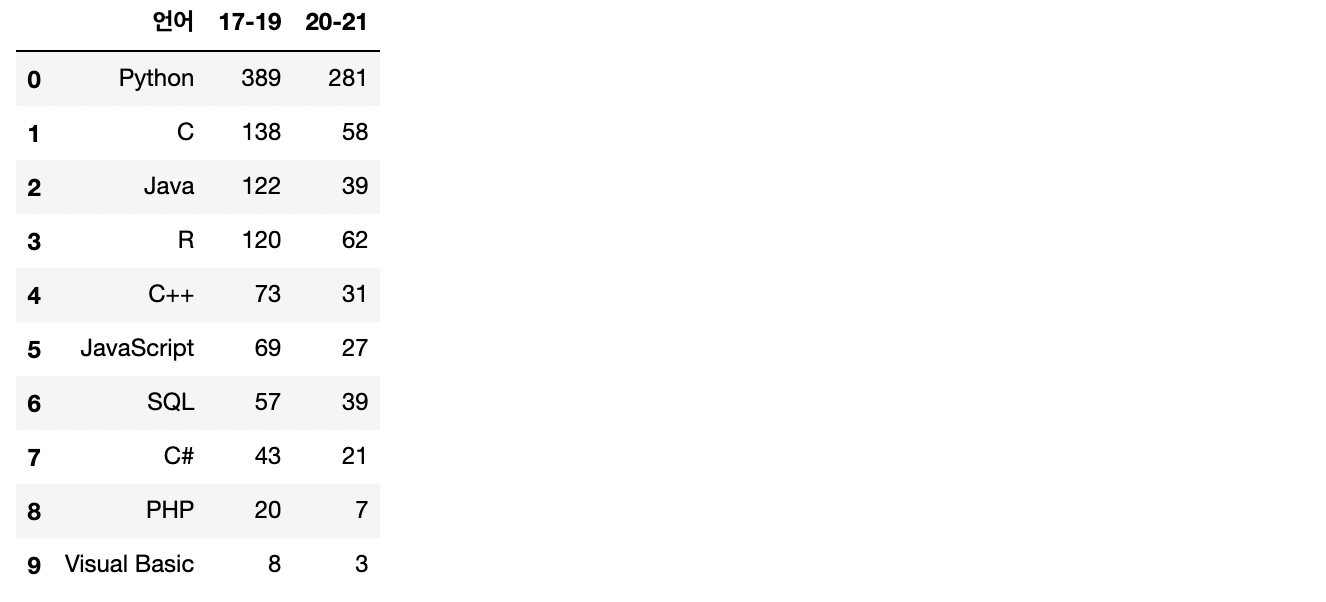
# 막대 그래프 그리기
plt.style.use('ggplot')
plt.figure(figsize=(14,8))
plt.bar(book_year['언어'], book_year['17-19'], color='tab:blue',label='17-19')
plt.bar(book_year['언어'], book_year['20-21'],  color='tab:orange',label='20-21')
plt.title('최근 5년간 언어별 연도별 책 출판 수', fontsize=24)
plt.legend(loc='upper center', fontsize=17)
plt.xticks(fontsize=15, weight='bold')
plt.yticks(fontsize=13, )
plt.show()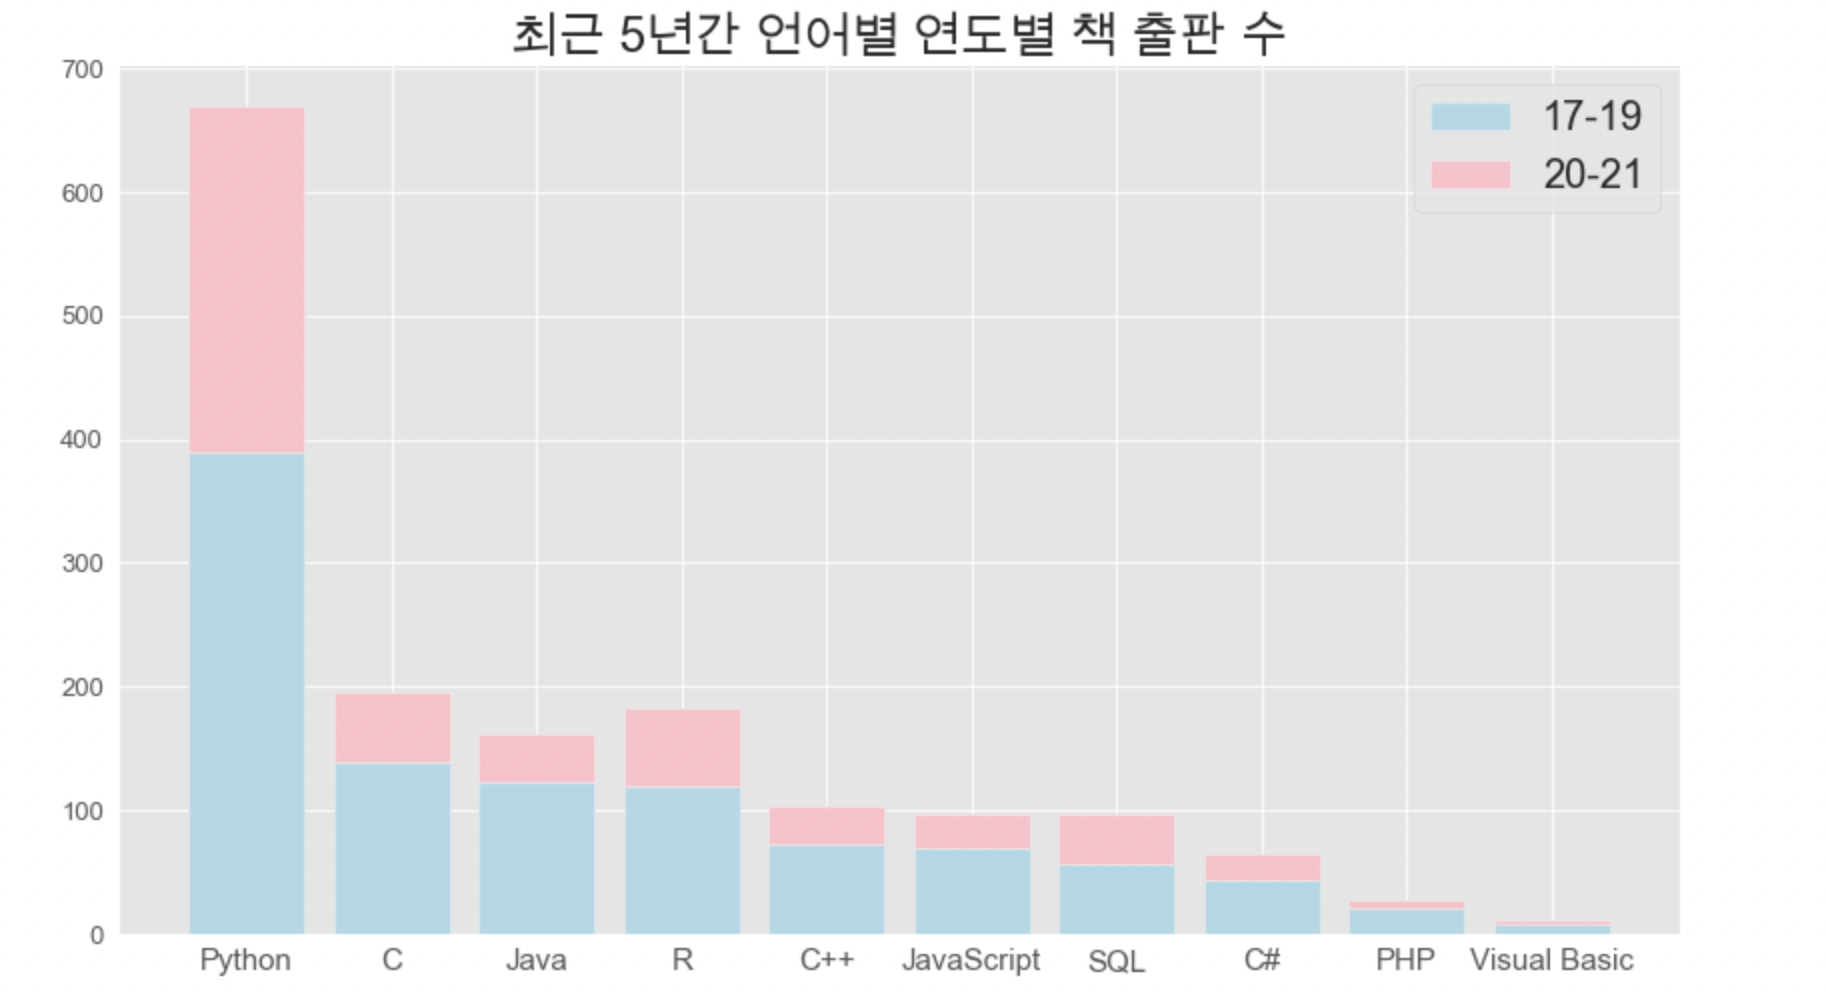
17-19년과 20-21년 모두 Python이 1위입니다.
- 17-19년 파이썬 출판량은 다른 언어의 약 세 배 이상
- 20-21년 파이썬 출판량은 다른 언어의 약 다섯 배 이상
4. 연도별 출판사별 각 언어 출판량 순위
"제목은 연도별 출판량 으로 하겠습니다. 그런데 이제 출판사를 곁들인,,,"
1) 피벗 테이블
# 피벗테이블 - 컬럼을 언어에 연도까지 추가한 버전 생성
publisher_year = result_year.pivot_table(index='출판사',columns=['연도','언어'], values='ISBN',aggfunc=np.count_nonzero)
publisher_year.fillna(0,inplace=True)
publisher_year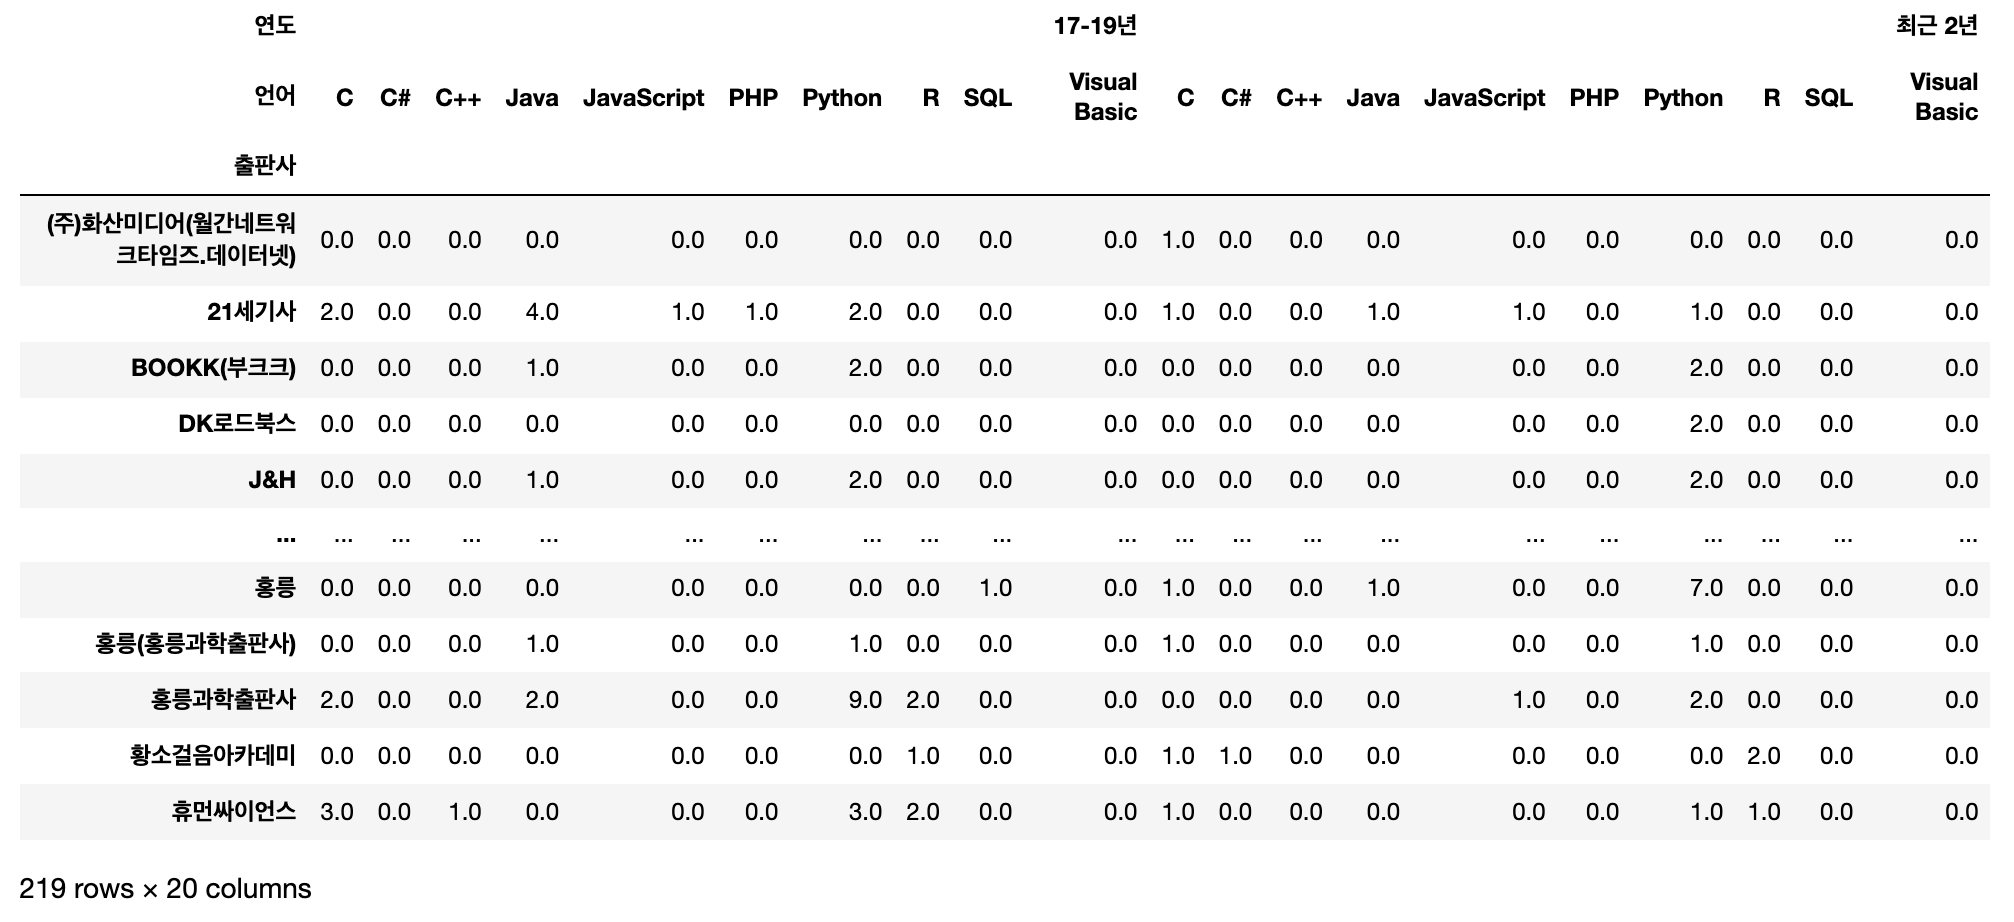
# 정렬을 위해 sum컬럼 추가
publisher_year['sum'] = publisher_year.sum(1)
publisher_year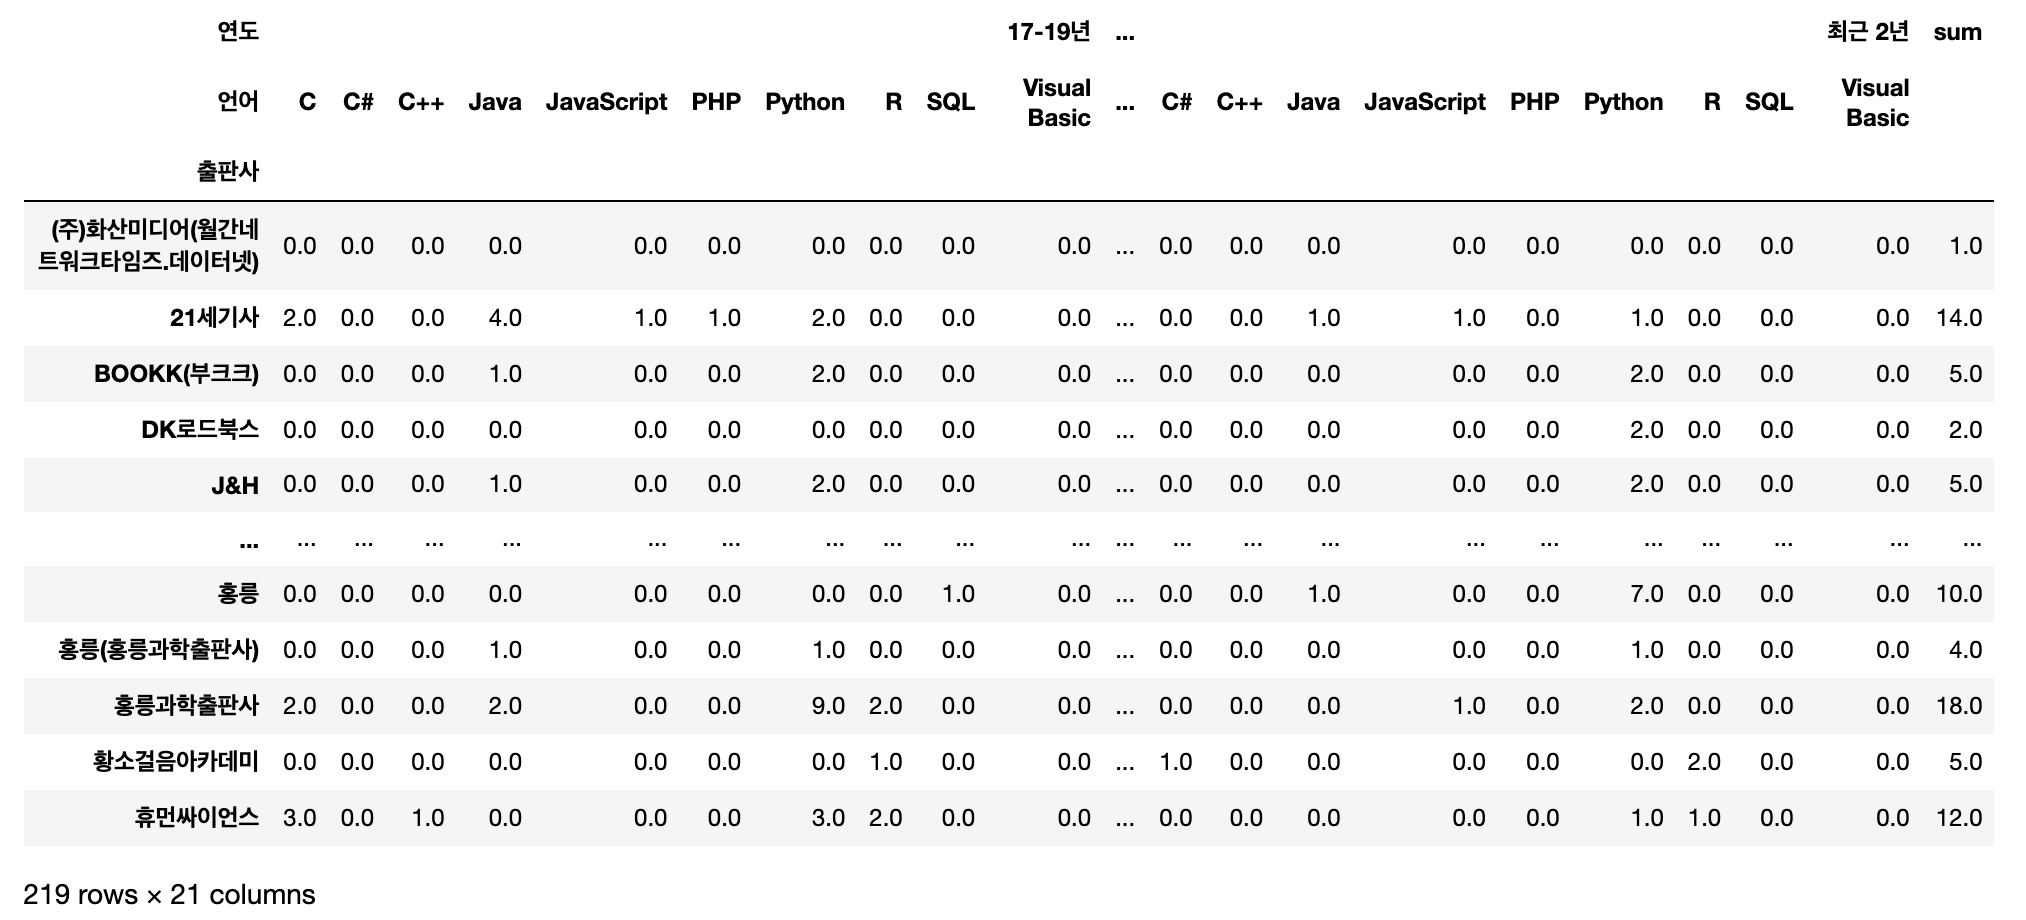
# 17-19년 데이터만 잘라내고 '합계'컬럼 추가
pv_1719 = publisher_year[publisher_year.columns[0:10]]
pv_1719['sum'] = pv_1719.sum(1)
pv_1719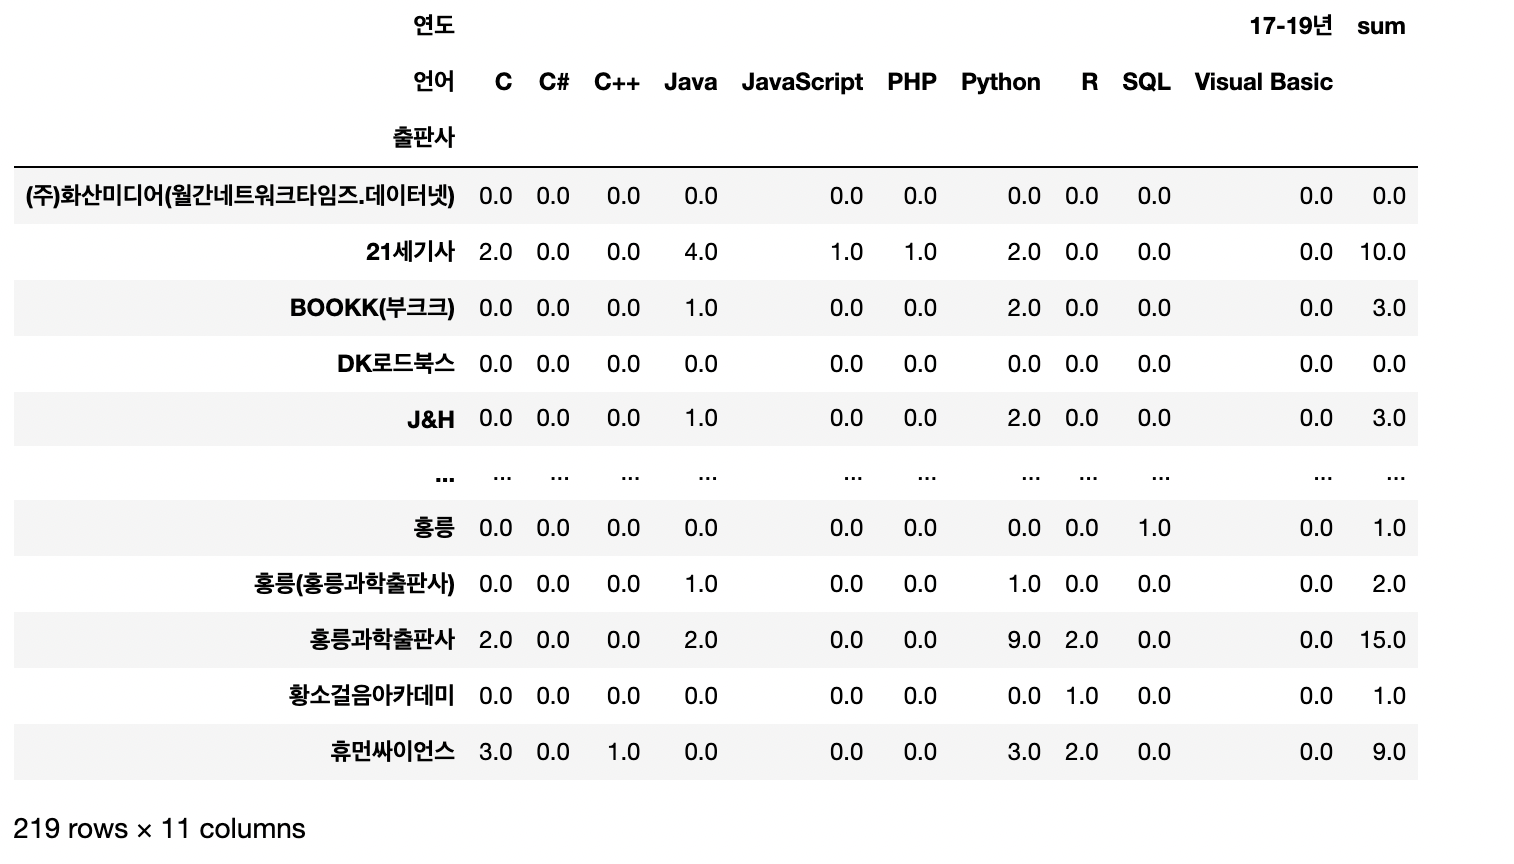
# 다중 컬럼 정리
pv_1719.columns = pv_1719.columns.get_level_values(0) + ' ' + pv_1719.columns.get_level_values(1)
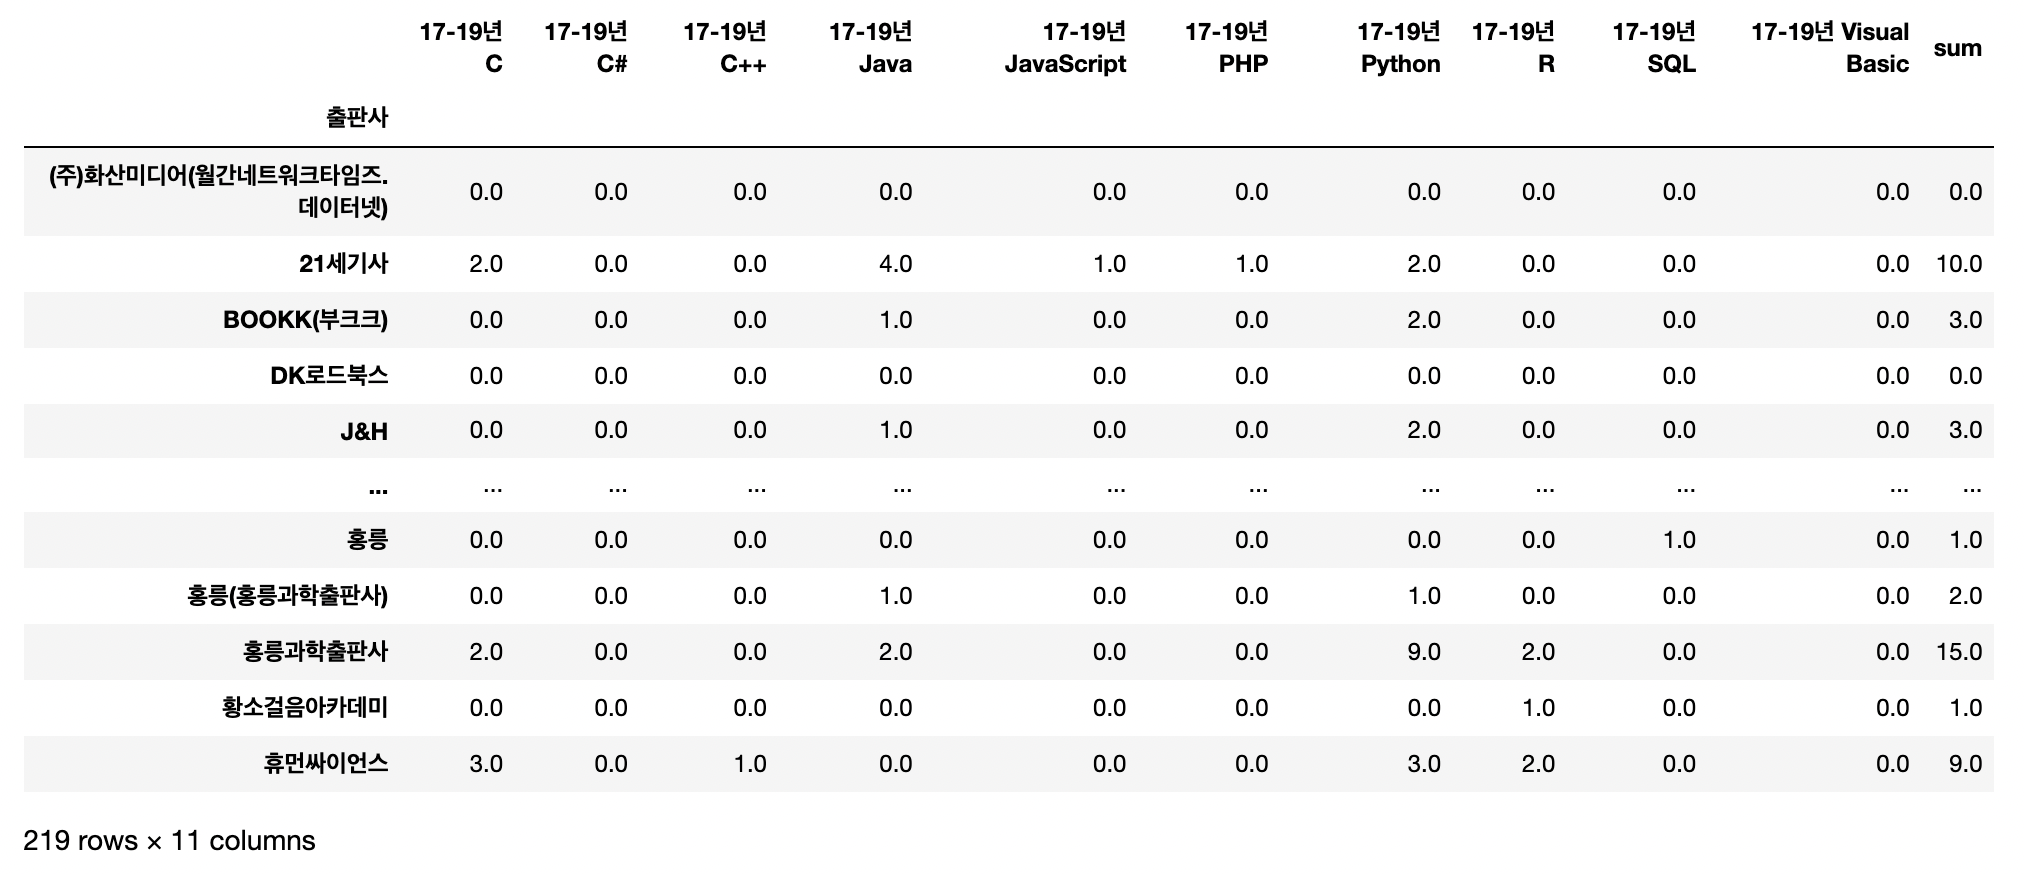
# 20-21년 데이터만 잘라내고 '합계'컬럼 추가
pv_2021 = publisher_year[publisher_year.columns[10:20]]
pv_2021['sum'] = pv_2021.sum(1)

# 다중 컬럼 정리
pv_2021.columns = pv_2021.columns.get_level_values(0) + ' ' + pv_2021.columns.get_level_values(1)


# 합계 컬럼명 변경
pv_1719.rename(columns={'sum ': '17-19년 합계'},inplace=True)
pv_2021.rename(columns={'sum ': '20-21년 합계'},inplace=True)
# 쪼개기 전 데이터프레임에 연도별 합계 컬럼 추가
publisher_year['sum_1719'] = pv_1719['17-19년 합계']
publisher_year['sum_2021'] = pv_2021['20-21년 합계']
# 17-19년 출판량 상위 20개 출판사
pv_1719.sort_values(by='17-19년 합계',ascending=False,inplace=True)
pv_1719_top20 = pv_1719.head(20)

# 그래프
plt.figure(figsize=(8,8))

colors=sns.color_palette('hls',20)
plt.bar(pv_1719_top20.index, pv_1719_top20['17-19년 합계'], color=colors)

plt.xticks(rotation=60, fontsize=12)
plt.tick_params(axis='x', direction='in', length=3, pad=6, labelsize=12, bottom=True)
plt.show();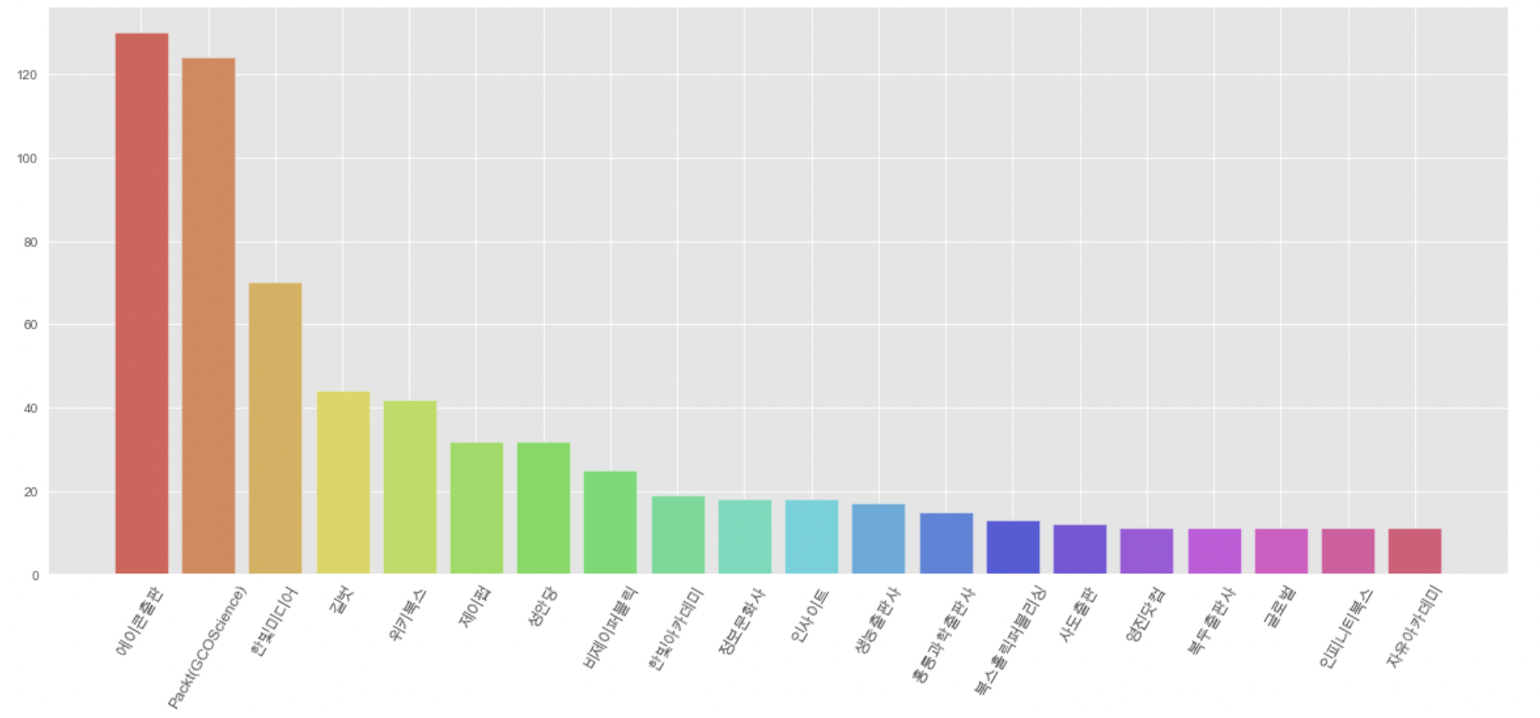
# 20-21년 출판량 상위 20개 출판사
pv_2021.sort_values(by='20-21년 합계',ascending=False,inplace=True)
pv_2021_top20 = pv_2021.head(20)


plt.figure(figsize=(8,8))

colors=sns.color_palette('husl',10)
plt.bar(pv_2021_top20.index, pv_2021_top20['20-21년 합계'], color=colors)

plt.xticks(rotation=60, fontsize=12)
plt.tick_params(axis='x', direction='in', length=3, pad=6, labelsize=12, bottom=True)
plt.show();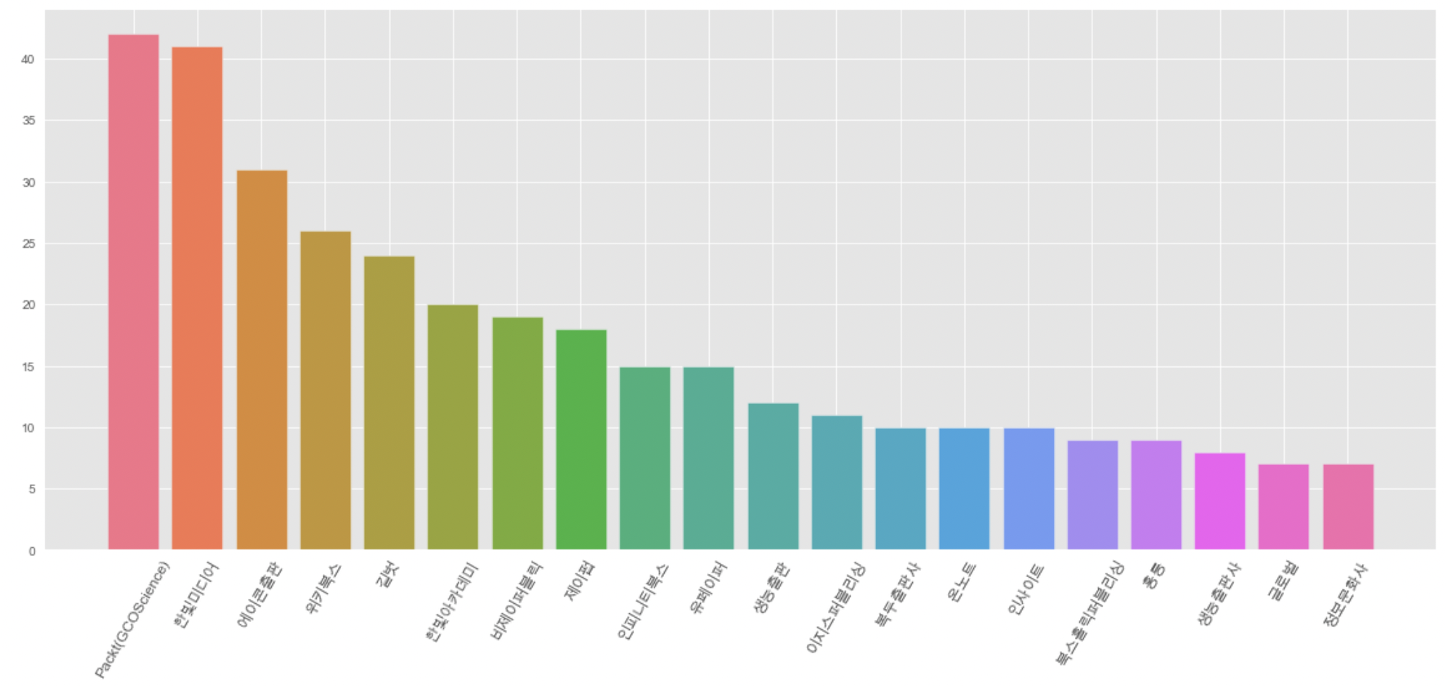
publisher_year.columns = publisher_year.columns.get_level_values(0) + publisher_year.columns.get_level_values(1)
publisher_year.columns
publi_year_top20 = publisher_year.sort_values(by='sum',ascending=False).head(20)


p_y_col = list(publi_year_top20.columns[:10])
p_y_col
p_y_col_2 = list(publi_year_top20.columns[10:20])
p_y_col_2
# 17-19 출판사별 언어별 출판량 누적 그래프

plt.style.use('ggplot')
plt.figure(figsize=(16,10))
colors = sns.color_palette('hls',10)


bott = 0
n = 0

for col in p_y_col:
    plt.bar(publi_year_top10.index, publi_year_top10[col], color=colors[n], bottom=bott, label=col)
    n += 1
    bott += publi_year_top10[col]
plt.legend(loc='upper right',fontsize=18)

plt.xticks(rotation=340)
plt.show();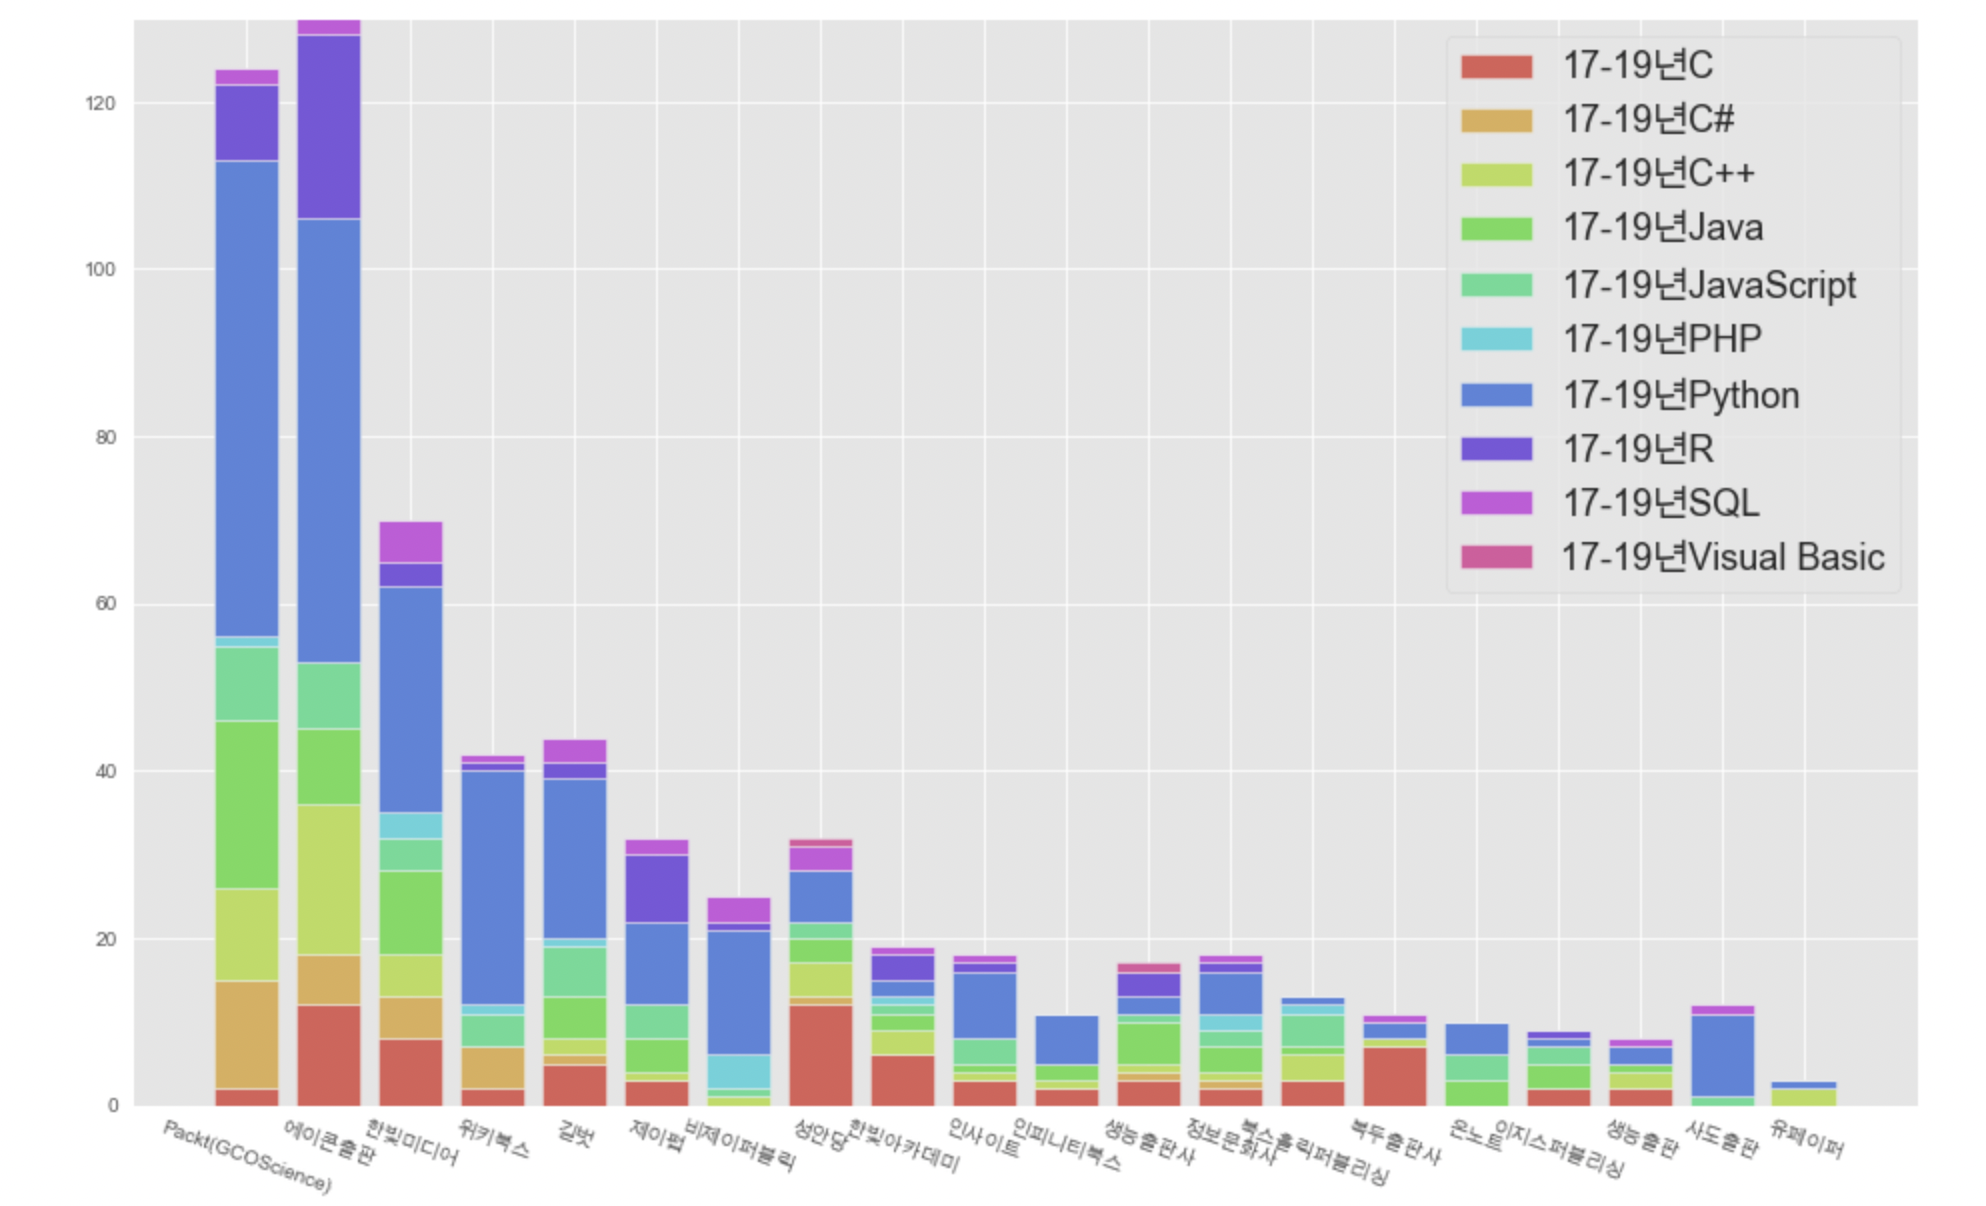
대충 봐도 파란색(=파이썬)이 많네요😮
# 20-21 출판사별 언어별 출판량 누적 그래프

plt.style.use('ggplot')
plt.figure(figsize=(16,10))
colors = sns.color_palette('hls',10)


bott = 0
n = 0

for col in p_y_col_2:
    plt.bar(publi_year_top10.index, publi_year_top10[col], color=colors[n], bottom=bott, label=col)
    n += 1
    bott += publi_year_top10[col]
plt.legend(loc='upper right',fontsize=18)

plt.xticks(rotation=340)
plt.show();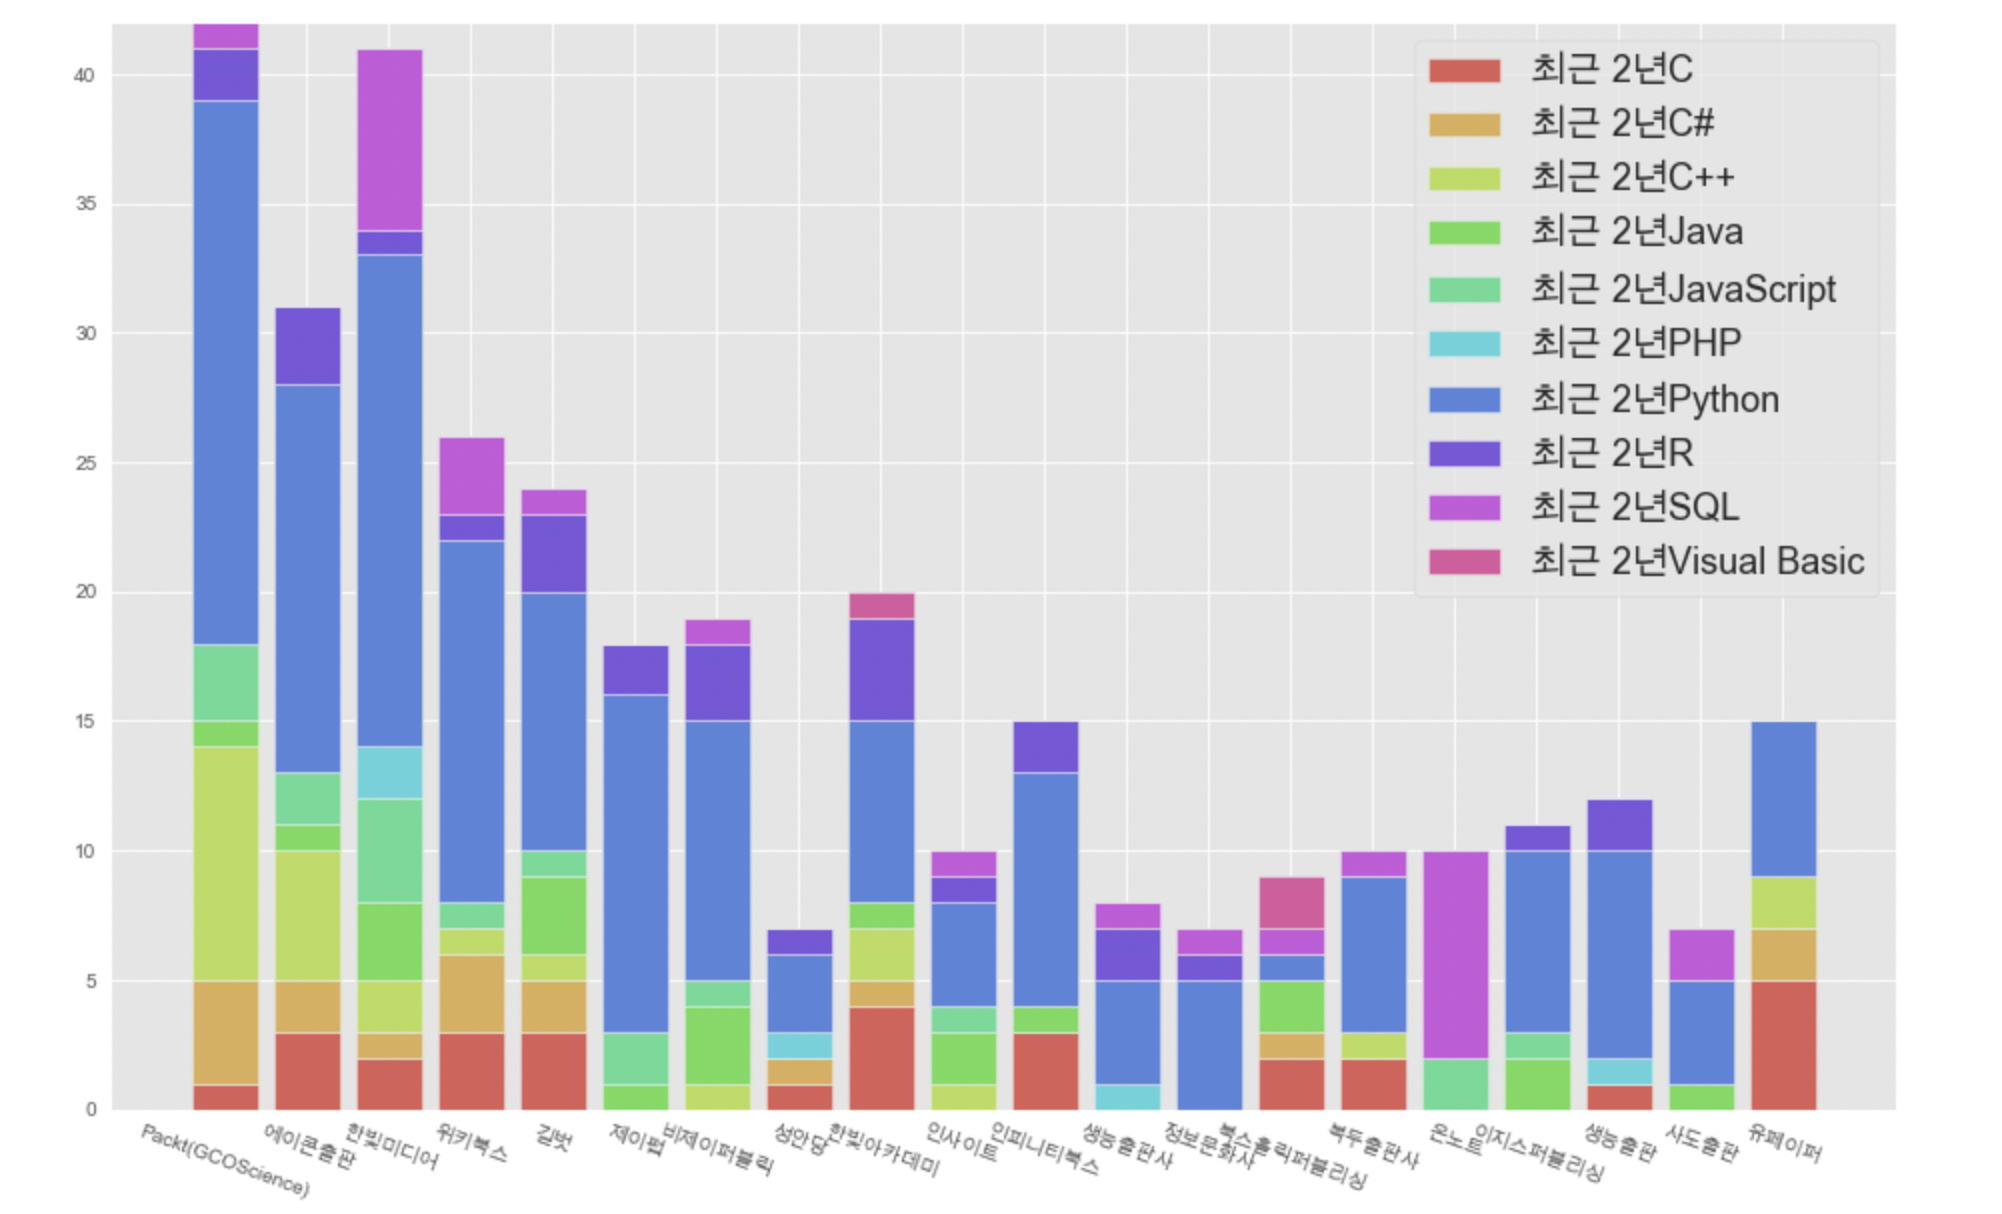
파란색이 더 더 많아졌네요! 🤭
이쯤에서 이번 프로젝트의 결론이 나왔습니다.
"Life is short. You need PYTHON!"
프로젝트의 목적은 달성하였지만,
여기서 분석을 마치기엔 약간 아쉬운 느낌이 들어
얻은 데이터들을 바탕으로 책 가격에 주목하여 더 분석을 해봤습니다!
5. 책 가격에 영향을 미치는 요인 분석
1) 책 가격과 페이지 수의 상관관계
