react-native-svg-charts tooltip 생성

react-native-svg-charts 라이브러리를 이용하여 chart 구현
tooltip, chartLabel 구현
사용 방법
▶️설치 react-native-svg-charts npm
react-native-svg 같이 설치되어 있어야 한다.
📌참고
👉 react-native-svg-charts-examples
📊차트 종류
1. bar, line, pie, ProgressCircle ,StackedArea 구현 가능
2. XAxis, YAxis 이용해 x,y 축 구현 가능.
💥단점
차트를 그리는것과 x,y축을 제외한 모든 기능을 react-native-svg를 통해 구현해야 한다.
- 그래프항목에 대한 값 표출
- 그래프내에 라인추가
- tooltip
사용법
   <View style={{ flex: 1 }} {...panResponder.current.panHandlers}>
   		<BarChart
        style={{ flex: 1, backgroundColor: 'transparent' }}
        spacingInner={0.4}
        data={nowData.points}
        gridMin={0}
        contentInset={{ top: 10, bottom: 10 }}
        svg={{ fill: '#FEB104' }}
        yAccessor={({ item }) => item.estimatedSavings}
        yMax={nowData.maxEstimatedSavings}>
        	<Tooltip />
            <HorizontalLine />
            <HorizontalText />
        </BarChart>
  </View>
  <XAxis
  style={{ marginHorizontal: -10 }}
  data={xData}
  formatLabel={(value, index) => {
  return index % chartCol === 0
  ? dateType === 'MONTH'
  ? index + 1
  : nowData.points[index].label
  : '';
  }}
  contentInset={
  dateType === 'WEEK'
  ? { left: 15, right: 15 }
  : dateType === 'MONTH'
  ? { left: 3, right: 10 }
  : { left: 10, right: 10 }
  }
  svg={{
  fontSize: 12,
  fill: '#1F1F1F',
  fontFamily: 'manrope-400',
  }}
  />
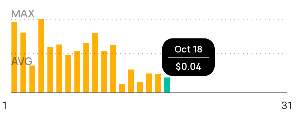
tooltip
- tooltip 인자는 BarChart의 값을 통해 받아옴.
- x, y, bandwidth, data, ticks
- 각 막대의 해당하는 tooltip을 띄우기 위해서는 x,y값의 계산이 필요하며, index를 구하기 위해 막대그래프의 넓이와, 추가로 넣은 간격값 그리고 positionx축값을 계산이 필요하다.
- 일정의 index가 넘어가면 차트영역을 벗어나 보이지 않기때문에 분기처리가 필요.
const Tooltip = ({ x, y, bandwidth, data, ticks }: any) => {
		//
    const index =
      Math.floor((positionX - 5) / (bandwidth + 0.3 + bandwidth * 0.6)) >=
      data.length
        ? data.length - 1
        : Math.floor((positionX - 5) / (bandwidth + 0.3 + bandwidth * 0.6)) < 0
        ? 0
        : Math.floor((positionX - 5) / (bandwidth + 0.3 + bandwidth * 0.6));

    const tooltipLast = data.length - Math.floor(50 / (bandwidth + 0.3)) - 1;

    nowData?.points.map((chart, i) => {
      if (i === index) {
        chart.svg = { fill: '#00C0A0' };
      } else {
        chart.svg = { fill: '#FEB104' };
      }
    });

    if (nowData?.points[index].estimatedSavings === 0) {
      return null;
    } else {
      setNowData(nowData);
    }

    return (
      <G x={10} key="tooltip">
        <G
          // index < data.length / 2 ? positionX - 20 : positionX - 40
          x={
            index > tooltipLast
              ? tooltipLast * (bandwidth + 0.3 + bandwidth * 0.6) + 10
              : index * (bandwidth + 0.3 + bandwidth * 0.6) - 10
          }
          y={
            nowData?.maxEstimatedSavings
              ? y(nowData?.maxEstimatedSavings / 2)
              : y(0)
          }
        >
          <Rect
            y={-20}
            rx={12} // borderRadius
            ry={12} // borderRadius
            width={60}
            height={43}
            fill="black"
          />

          <ForeignObject y={-15} width={60} height={20} textAnchor={'middle'}>
            <View
              style={{
                backgroundColor: 'black',
                justifyContent: 'center',
                width: 60,
                borderRadius: 12,
              }}
            >
              <Text
                style={{
                  fontSize: 10,
                  color: '#fff',
                  alignSelf: 'center',
                  fontFamily: 'manrope-600',
                }}
              >
                {dateType === 'YEAR'
                  ? fullyearLable[index] || '-'
                  : dateType === 'WEEK'
                  ? fullweekLable[index] || '-'
                  : data[index].label}
              </Text>
            </View>
          </ForeignObject>
          <ForeignObject y={1} width={46} x={7} height={2} opacity={0.2}>
            <View
              style={{
                borderTopWidth: 1,
                borderColor: '#fff',
              }}
            />
          </ForeignObject>
          <ForeignObject y={5} fontSize={10} fontWeight="bold">
            <View
              // 'transparented'
              style={{
                backgroundColor: 'black',
                justifyContent: 'center',
                width: 60,
                borderRadius: 12,
              }}
            >
              <Text
                style={{
                  fontSize: 10,
                  color: '#fff',
                  alignSelf: 'center',
                  fontFamily: 'manrope-600',
                }}
              >
                ${data[index].estimatedSavings.toFixed(2)}
              </Text>
            </View>
          </ForeignObject>
        </G>
      </G>
    );
  };
- HorizontalText
- 차트내에 들어가는 텍스트
- x,y축값을 이용하여 원하는 위치에 원하는 문구를 삽입한다.
- 컴포넌트를 사용해야 react-native Text 컴포넌트를 사용할 수 있다.
- react-native-svg내에도 Text 컴포넌트가 있지만 해당컴포넌트에는 폰트를 입힐 수 없기 때문에 아래와 같이 사용.
- 차트내에 들어가는 텍스트
  const HorizontalText = ({ x, y }: any) => (
    <>
      <ForeignObject
        x={0}
        y={y(nowData?.avgEstimatedSavings)}
        fill={'rgba(31, 31, 31, 0.5)'}
      >
        <Text
          style={{
            fontFamily: 'manrope-600',
            fontSize: 12,
            color: 'rgba(31, 31, 31, 0.5)',
          }}
        >
          {nowData?.avgEstimatedSavings !== 0 ? 'AVG' : ' '}
        </Text>
      </ForeignObject>
      <ForeignObject
        x={0}
        y={y(nowData?.maxEstimatedSavings) - 15}
        fill={'#1F1F1F'}
      >
        <Text
          style={{
            fontFamily: 'manrope-600',
            fontSize: 12,
            color: 'rgba(31, 31, 31, 0.5)',
          }}
        >
          {nowData?.maxEstimatedSavings !== 0 ? 'MAX' : ''}
        </Text>
      </ForeignObject>
</>-
HorizontalLine
const HorizontalLine = ({ y }: any) => (
  <>
    <Line
      key={'avg'}
      x1={'0%'}
      x2={'100%'}
      y1={y(nowData?.avgEstimatedSavings)}
      y2={y(nowData?.avgEstimatedSavings)}
      stroke={'rgba(31, 31, 31, 0.5)'}
      strokeDasharray={[1, 4]}
      strokeWidth={1}
    />
    <Line
      key={'max'}
      x1={'0%'}
      x2={'100%'}
      y1={y(nowData?.maxEstimatedSavings)}
      y2={y(nowData?.maxEstimatedSavings)}
      stroke={'rgba(31, 31, 31, 0.5)'}
      strokeDasharray={[1, 4]}
      strokeWidth={1}
    />
    <Line
      key={'default'}
      x1={'0%'}
      x2={'100%'}
      y1={y(0)}
      y2={y(0)}
      stroke={'rgba(31, 31, 31, 0.5)'}
      // strokeDasharray={[1, 4]}
      strokeWidth={1}
    />
  </>
);

Front-end 개발자입니다.