library(party)
library(datasets)
str(airquality)
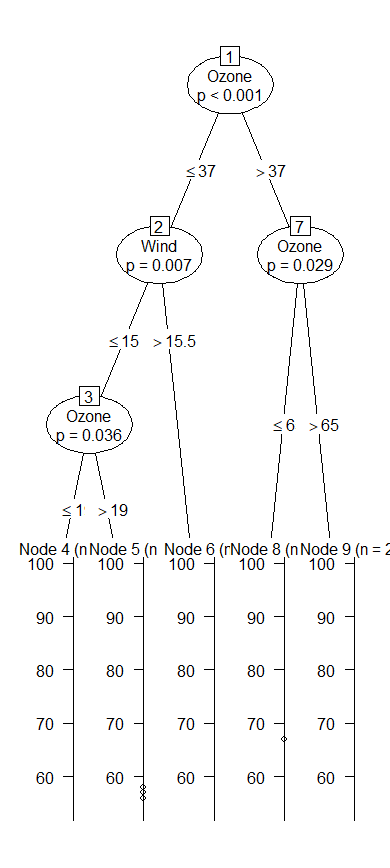
formula <- Temp ~ Solar.R + Wind + Ozone
air_ctree <- ctree(formula, data = airquality)
air_ctree
plot(air_ctree)
set.seed(1234)
idx <- sample(1:nrow(iris), nrow(iris) * 0.7)
train <- iris[idx, ]
test <- iris[-idx, ]
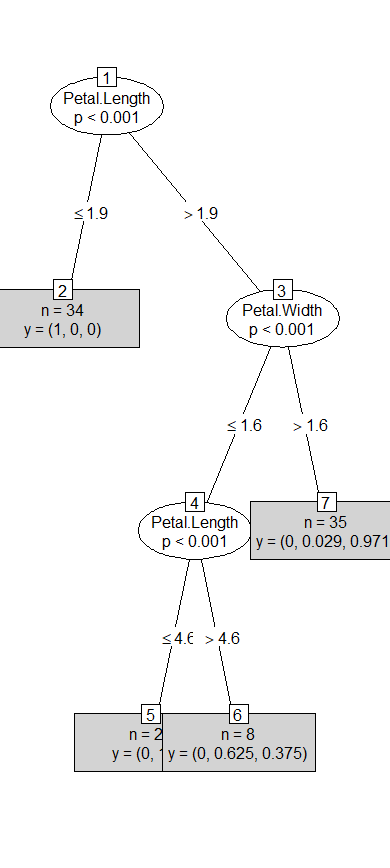
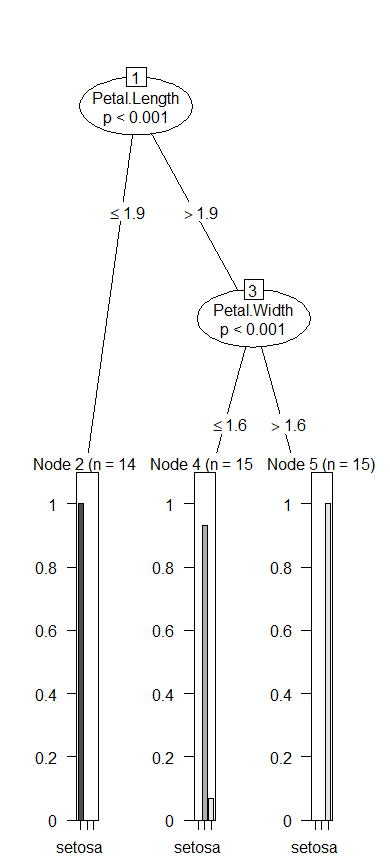
formula <- Species ~ Sepal.Length + Sepal.Width + Petal.Length + Petal.Width

iris_ctree <- ctree(formula, data = train)
iris_ctree

plot(iris_ctree, type = "simple")
pred <- predict(iris_ctree, test)
table(pred, test$Species)
(14 + 16 + 13) / nrow(test)
library(cvTools)
cross <- cvFolds(nrow(iris), K = 3, R = 2)
str(cross)
cross
length(cross$which)
dim(cross$subsets)
table(cross$which)
R = 1:2
K = 1:3
CNT = 0
ACC <- numeric()
for(r in R) {
cat('\n R = ', r, '\n')
for(k in K) {
datas_ids <- cross$subsets[cross$which == k, r]
test <- iris[datas_ids, ]
cat('test : ', nrow(test), '\n')
formual <- Species ~ .
train <- iris[-datas_ids, ]
cat('train : ', nrow(train), '\n')
model <- ctree(Species ~ ., data = train)
pred <- predict(model, test)
t <- table(pred, test$Species)
print(t)
CNT <- CNT + 1
ACC[CNT] <- (t[1, 1] + t[2, 2] + t[3, 3]) / sum(t)
}
}
CNT
ACC
length(ACC)
result_acc <- mean(ACC, na.rm = T)
result_acc
library(ggplot2)
data(mpg)
t <- sample(1:nrow(mpg), 120)
train <- mpg[-t, ]
test <- mpg[t, ]
dim(train)
dim(test)
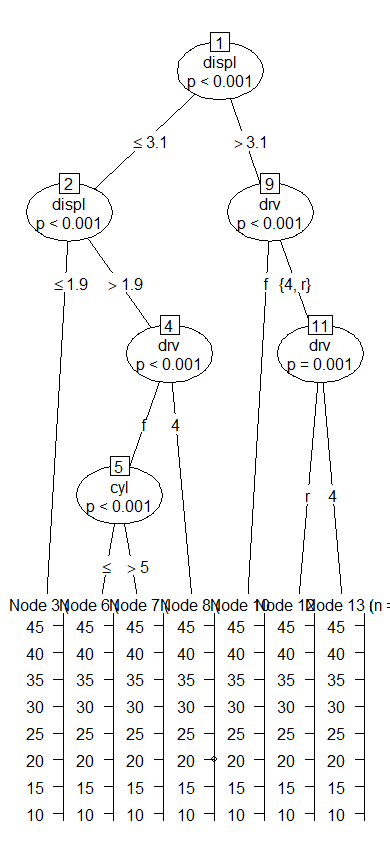
test$drv <- factor(test$drv)
formula <- hwy ~ displ + cyl + drv
tree_model <- ctree(formula, data = test)
plot(tree_model)
library(arules)
data(AdultUCI)
str(AdultUCI)
names(AdultUCI)
set.seed(1234)
choice <- sample(1:nrow(AdultUCI), 10000)
choice
adult.df <- AdultUCI[choice, ]
str(adult.df)
capital <- adult.df$`capital-gain`
hours <- adult.df$`hours-per-week`
education <- adult.df$`education-num`
race <- adult.df$race
age <- adult.df$age
income <- adult.df$income
adult_df <- data.frame(capital = capital, age = age, race = race,
hours = hours, education = education, income = income)
str(adult_df)
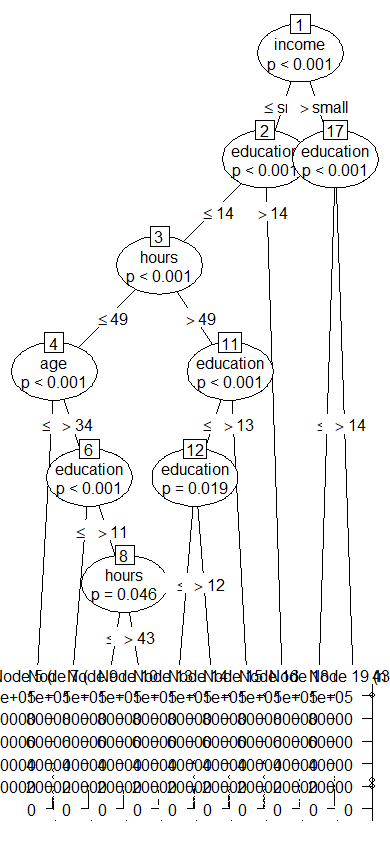
formula <- capital ~ income + education + hours + race + age
adult_ctree <- ctree(formula, data = adult_df)
adult_ctree
plot(adult_ctree)
adultResult <- subset(adult_df,
                      adult_df$income == 'large' &
                        adult_df$education > 14)
length(adultResult$education)
summary(adultResult$capital)
boxplot(adultResult$capital)

library(party)
# sampling
str(iris)
set.seed(1000)
sampnum <- sample(2, nrow(iris), replace=TRUE, prob=c(0.7,0.3))
sampnum
# training & testing data 구분
trData <- iris[sampnum==1,]
head(trData)
teData <- iris[sampnum == 2, ]
head(teData)
shortvar <- Species~Sepal.Length+Sepal.Width+Petal.Length+Petal.Width
# 학습
citreeResult <- ctree(shortvar, data=trData)
# 예측값과 실제값 비교
table(predict(citreeResult), trData$Species)
citreeResult2 <- ctree(shortvar, data=teData)
# 테스트 데이터를 이용하여 분류
forcasted2 <- predict(citreeResult2, data=teData)
# forcasted
# teData$Species
# 예측결과와 실제값 비교
table(forcasted2, teData$Species)
#시각화
plot(citreeResult2)
library(rpart)
library(rpart.plot)
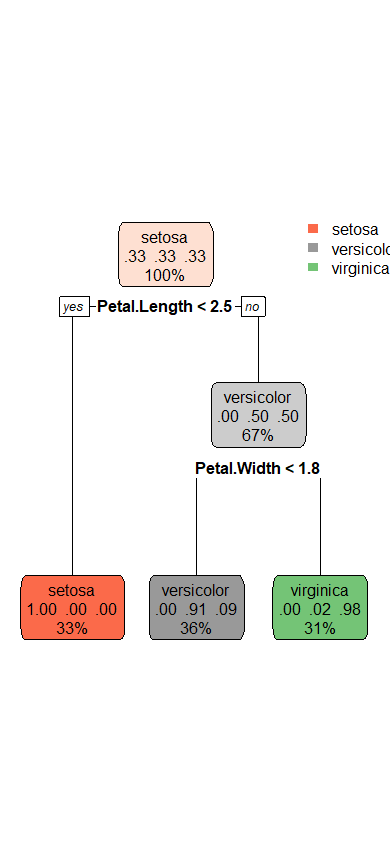
data(iris)
rpart_model <- rpart(Species ~ ., data = iris)
rpart_model
rpart.plot(rpart_model)
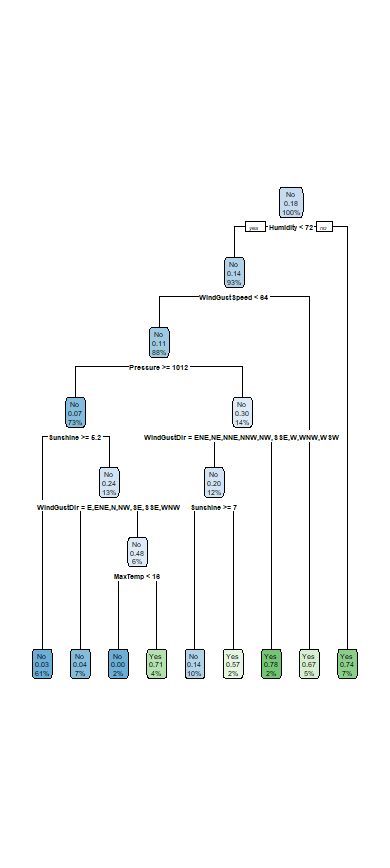
weather = read.csv("C:/Rwork/dataset4/weather.csv", header = TRUE)
str(weather)
head(weather)
weather.df <- rpart(RainTomorrow ~ ., data = weather[ , c(-1, -14)], cp = 0.01)
rpart.plot(weather.df)
weather_pred <- predict(weather.df, weather)
weather_pred
weather_pred2 <- ifelse(weather_pred[ , 2] >= 0.5, 'Yes', 'No')

table(weather_pred2, weather$RainTomorrow)
(278 + 53) / nrow(weather)
library(rpart)
CARTTree <- rpart(Species~., data=iris)
CARTTree
plot(CARTTree, margin=0.2)
text(CARTTree, cex=1)
predict(CARTTree, newdata=iris, type="class")
predicted <- predict(CARTTree, newdata=iris, type="class")
sum(predicted == iris$Species) / NROW(predicted)
real <- iris$Species
table(real, predicted)