2022-04-26 ~ 2022-05-01
멋사 1주차
Python에 입문한지 5개월이 지났다. 정리도 할겸 프로젝트 경험을 쌓고자 멋사 부트캠프를 시작하게 되었다.
1주차는 기본적인 개념을 정리하는 시간을 가졌다.
1. AI, ML, DL의 정의
2. ML의 학습방법
3. Regression
4. Classification
5. ML의 분류
- Training data의 형태에 따라 분류
- Supervised Learning (지도학습) - Training with labeled datasets
- Unsupervised Learning (비지도학습) - Training with unlabeled datasets
- Reinforcement Learning (강화학습)
- Learns from a series of reinforcements – rewards or punishments
- Semi-supervised learning, Self-supervised learning
6. Python
Python은 훌륭한 general-purpose 프로그래밍 언어이기도 하지만, NumPy, Scipy, Matplotlib 등의 유용한 라이브러리들을 활용하면 데이터 엔지니어링을 위한 강력한 도구가 될 수 있다.
Jupyter notebook만 사용해서 Colab은 처음 사용해봤는데 비슷하다.
(1) Google colab cheat-sheet

https://www.analyticsvidhya.com/blog/2020/04/5-amazing-google-colab-hacks-you-should-try-today/
(2) colab mount
from google.colab import drive
drive.mount('/content/drive')
(3) Basic data types
- Numbers
- Booleans
- Strings
(4) Container types
- List
- Dictionaries
- Sets
- Tuples
7. NumPy
NumPy is the core library for scientific computing in Python. It provides a high-performance multidimensional array object, and tools for working with these arrays. If you are already familiar with MATLAB, you might find this tutorial useful to get started with Numpy.
8. Matplotlib
Matplotlib is a plotting library. In this section give a brief introduction to the matplotlib.pyplot module, which provides a plotting system similar to that of MATLAB.
Subplots
# Compute the x and y coordinates for points on sine and cosine curves
x = np.arange(0, 3 * np.pi, 0.1)
y_sin = np.sin(x)
y_cos = np.cos(x)

# Set up a subplot grid that has height 2 and width 1,
# and set the first such subplot as active.
plt.subplot(2, 1, 1)

# Make the first plot
plt.plot(x, y_sin)
plt.title('Sine')

# Set the second subplot as active, and make the second plot.
plt.subplot(2, 1, 2)
plt.plot(x, y_cos)
plt.title('Cosine')

# Show the figure.
plt.show()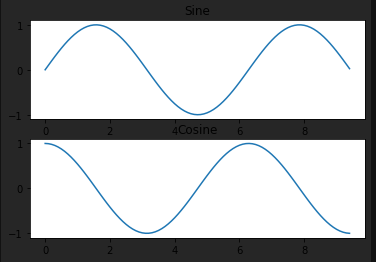
멀캠 프로젝트 3주차
1. DTW 알고리즘
DTW (Dynamic Time Warping Algorithm) 은 2개의 시퀀스 간 유사도를 구할 때 시간(위상)의 차이가 있어도 사람의 눈으로 보는 것과 비슷하게 패턴을 인식해 유사도(혹은 거리)를 구하는 알고리즘
https://www.youtube.com/watch?v=03J4xzymOWM
2. K-Shape
K-Shape Clustering은 시계열 (time series) 자료를 clustering 하는 분석 방법으로, Euclidian distance를 주로 사용하여 개별 관측치 간의 동질성에 따라 cluster를 분류하는 K-Means Clustering과는 다르게 Dynamic Time Warping (DTW)을 사용
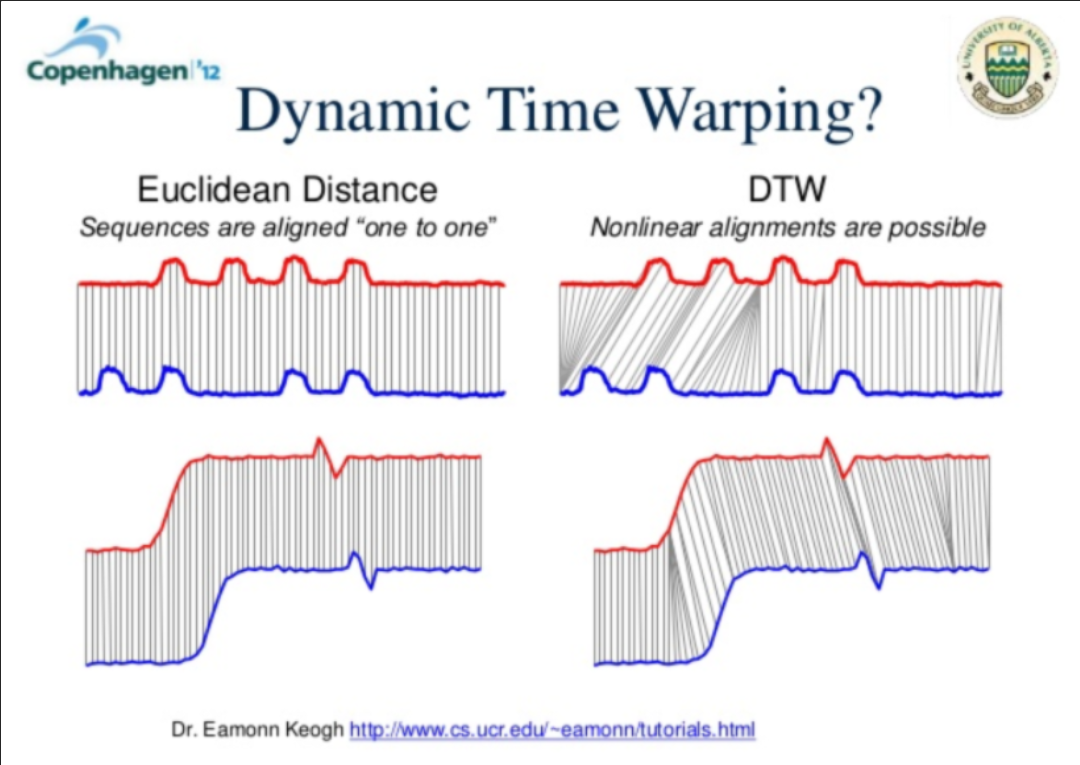
DTW 방식을 사용하게 되면 Mean 값에 대응되는 점을 찾는 대신 각 지점과 가장 유사한 위상의 점을 찾기 때문에 시계열 자료의 시퀀스를 보다 정확하게 측정할 수 있다.
https://techy8855.tistory.com/m/21