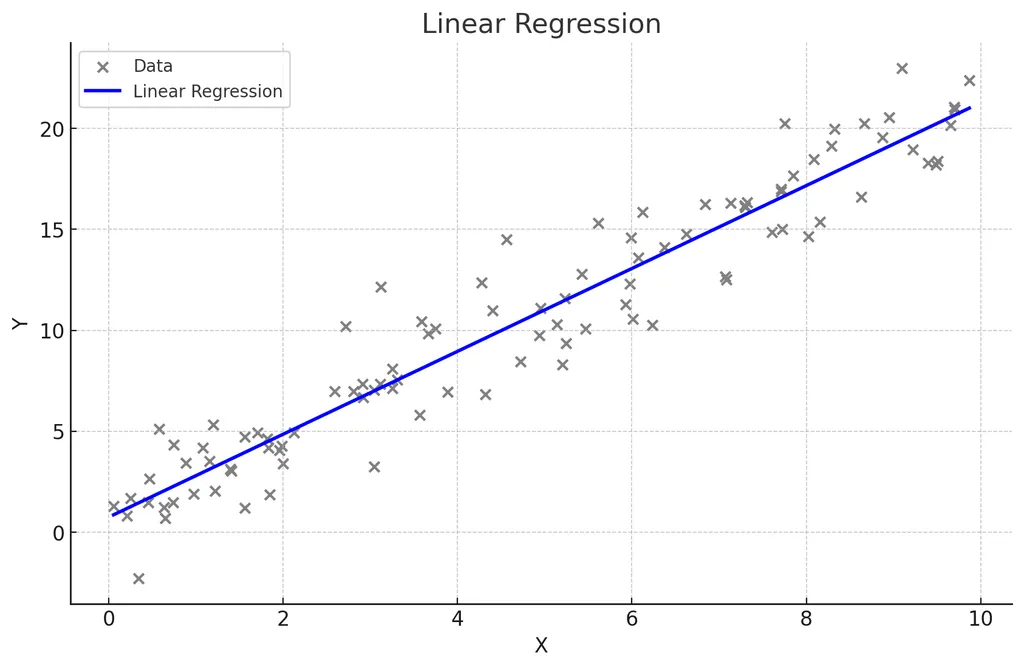
단순선형회귀
- 하나의 독립변수 X와 하나의 종속변수 Y 간의 관계를 직선으로 모델링하는 방
회귀식
특징
- 독립변수의 변화에 따라 종속 변수가 어떻게 변화하는지 설명하고 예측
- 데이터가 직선적 경향을 따를 때 사용
- 간단하고 해석이 용이
- 데이터가 비선형적인 경우 부적합
- 하나의 독립변수와 종속변수 관의 관계 분석 및 예측
ex) 광고비(X)와 매출(Y) 간의 관계 분석 현재의 광고비를 바탕으로 예상 매출 예측 가능
실습
import numpy as np
import pandas as pd
import matplotlib.pyplot as plt
from sklearn.linear_model import LinearRegression
from sklearn.model_selection import train_test_split
from sklearn.metrics import mean_squared_error, r2_score

# 예시 데이터 생성
np.random.seed(0)
X = 2 * np.random.rand(100, 1)
y = 4 + 3 * X + np.random.randn(100, 1)

# 데이터 분할
X_train, X_test, y_train, y_test = train_test_split(X, y, test_size=0.2, random_state=42)

# 단순선형회귀 모델 생성 및 훈련
model = LinearRegression()
model.fit(X_train, y_train)

# 예측
y_pred = model.predict(X_test)

# 회귀 계수 및 절편 출력
print("회귀 계수:", model.coef_)
print("절편:", model.intercept_)

# 모델 평가
mse = mean_squared_error(y_test, y_pred)
r2 = r2_score(y_test, y_pred)
print("평균 제곱 오차(MSE):", mse)
print("결정 계수(R2):", r2)

# 시각화
plt.scatter(X, y, color='blue')
plt.plot(X_test, y_pred, color='red', linewidth=2)
plt.title('linear regeression')
plt.xlabel('X : cost')
plt.ylabel('Y : sales')
plt.show()
결과:
회귀 계수: [[2.9902591]]
절편: [4.20634019]
평균 제곱 오차(MSE): 0.9177532469714291
결정 계수(R2): 0.6521157503858556


To Dare is To Do