1. 특정 열에서 조건에 만족하는 행 개수 세기
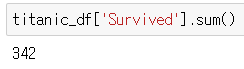
titanic_df['Survived'].sum()
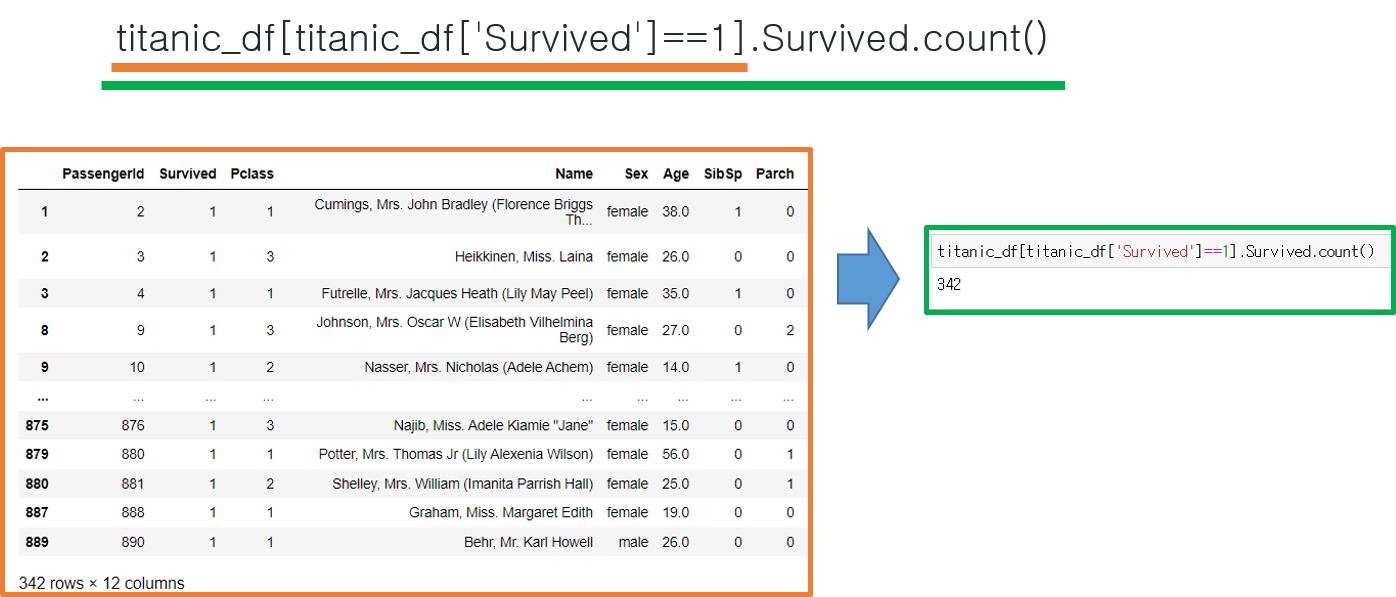
생존자 수가 몇 명인지 확인하기(0이 사망자고 1이 생존자이기 때문에 쓸 수 있음)
titanic_df[titanic_df['Survived']==1].Survived.count()
데이터에서 'Survived' 열의 값이 1인 애들을 모아 표를 만든다 > 그중에서 Survived 열만 추출한다 > 그 열의 개수를 센다.

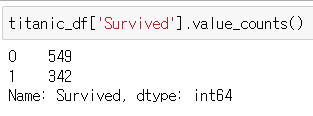
titanic_df['Survived'].value_counts()
value_count() 메소드를 통해 각각 세기
2. 두 값이 있는 열을 막대 그래프로 그리기
생존자수와 사망자수를 countplot으로 그려보기
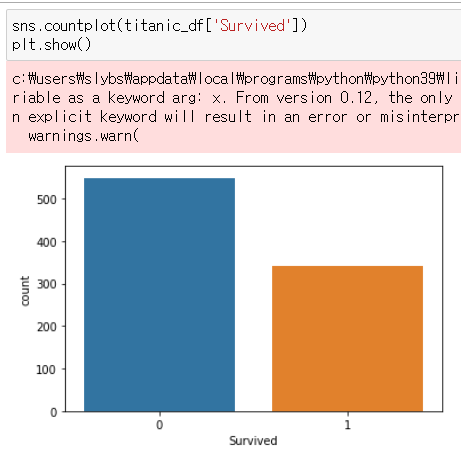
1.특정 열을 기준으로 그래프 그리기
sns.countplot(titanic_df['Survived'])
plt.show()
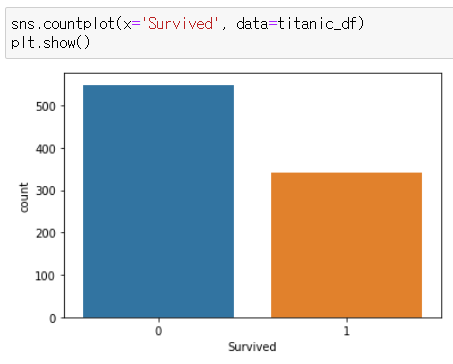
2. x값을 특정 열로 지정하기
sns.countplot(x='Survived', data=titanic_df)
plt.show()
3. 두 열을 한 그래프에 그리기
Pclass와 Survived 간의 관계
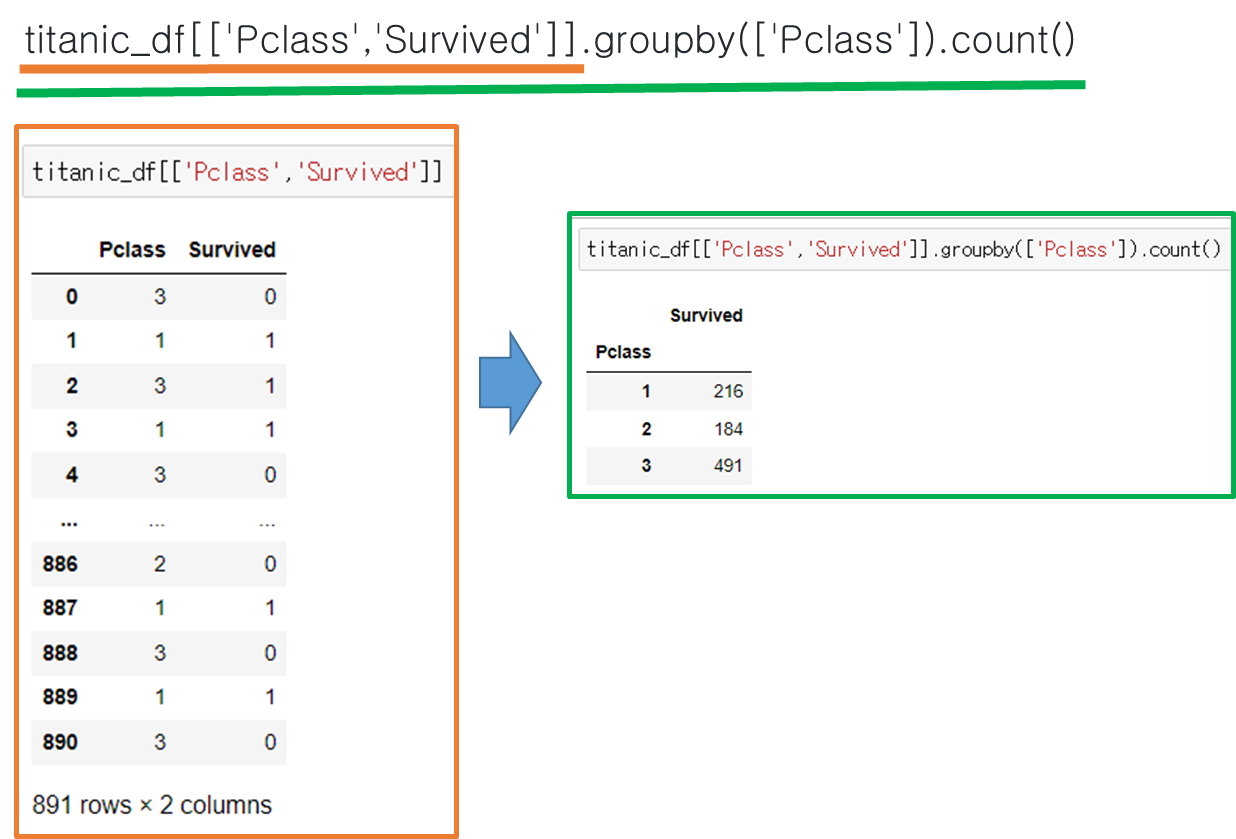
1. 열 두개의 데이터를 한 열을 기준으로 count
titanic_df[['Pclass','Survived']].groupby(['Pclass']).count()
‘Pclass’와 ‘Survived’ 열만 추출한다 > 그 데이터를 그룹바이 하는데, ‘Pclass’열을 기준으로 count
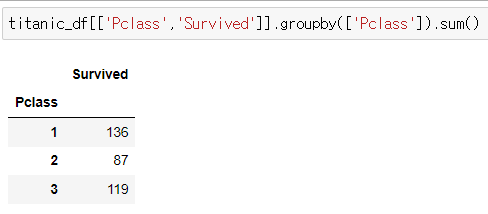
2. sum을 이용해서 count하기
titanic_df[['Pclass','Survived']].groupby(['Pclass']).sum()
(0이 사망자고 1이 생존자이기 때문에 쓸 수 있음)
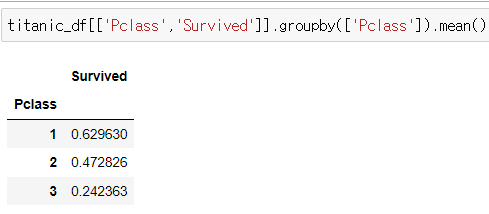
3. 전체인원 대비 생존 비율 파악하기
titanic_df[['Pclass','Survived']].groupby(['Pclass']).mean()
(0이 사망자고 1이 생존자이기 때문에 쓸 수 있음)
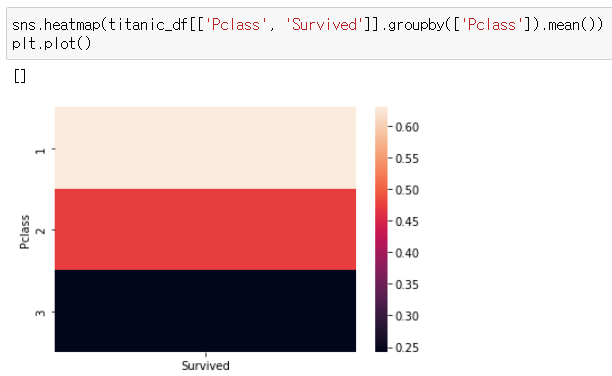
4. 비율을 그래프로 표현하기(히트맵이용)
(0이 사망자고 1이 생존자이기 때문에 쓸 수 있음)
sns.heatmap(titanic_df[['Pclass','Survived']].groupby(['Pclass']).mean())
plt.plot()
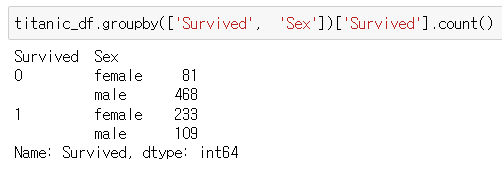
4. 열 두개 groupby하기
titanic_df.groupby(['Survived', 'Sex']).count()
두 열을 행으로 옮겨서 이를 기준으로 count하기
?????????????
titanic_df.groupby(['Survived', 'Sex'])['Survived'].count()
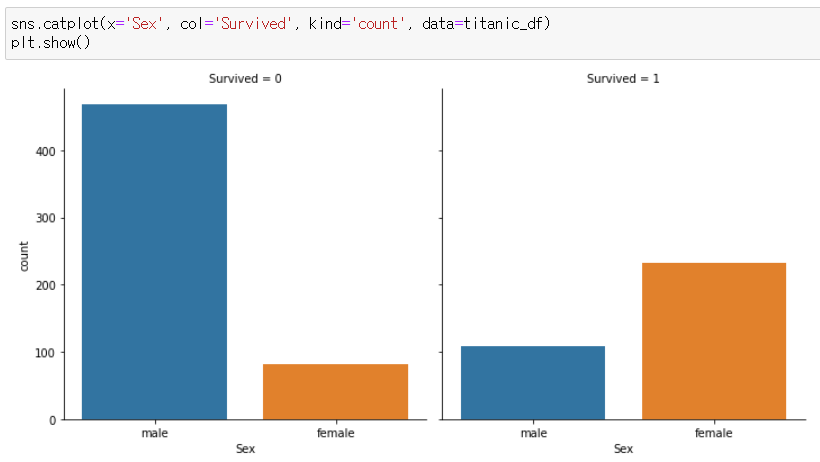
열 두개 catplot하기
sns.catplot(x='Sex', col='Survived', kind='count', data=titanic_df)
plt.show()
y = 'Survived'가 아닌 이유 : Survived로 두 그래프를 나눌 것이기 때문!

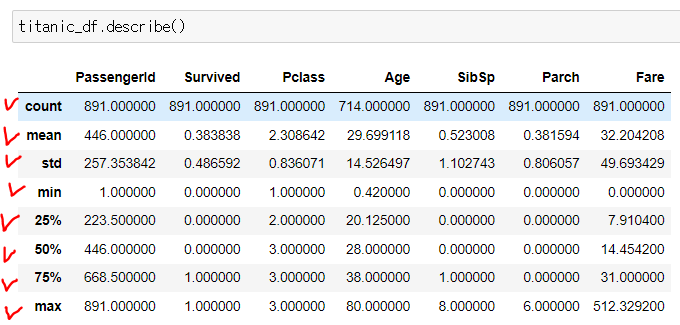
5. describe()
titanic_df.describe()
필요한 값들을 계산해서 보여줌
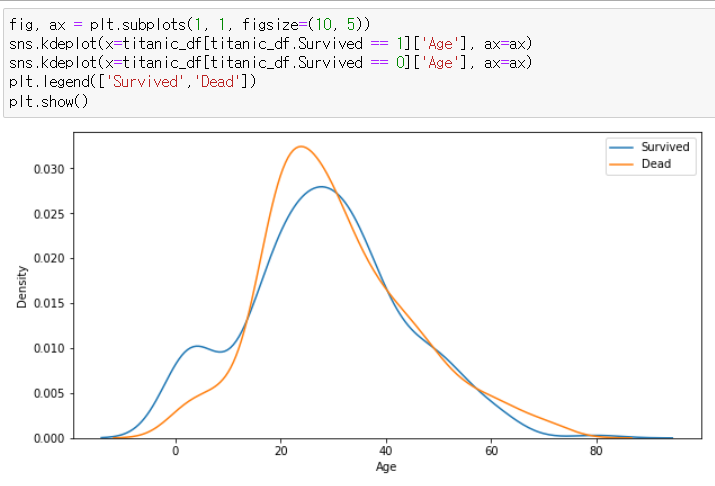
6. kde plot으로 열 두 개 표현하기
fig, ax = plt.subplots(1, 1, figsize=(10, 5))
subplot : 여러개의 plot을 한번에 보여줄 때 씀. 가로에 몇 개, 세로에 몇 개 그래프를 그릴 것인지
figsize : 그래프 크기
(가로 1개 세로 1개의 그래프를 그리겠다. 그래프의 크기는 (10, 5))
sns.kdeplot(x=titanic_df[titanic_df.Survived == 1]['Age'], ax=ax)
sns.kdeplot(x=titanic_df[titanic_df.Survived == 0]['Age'], ax=ax)
plt.legend(['Survived','Dead'])>> 그래프 선에 대해 설명 추가
plt.show()
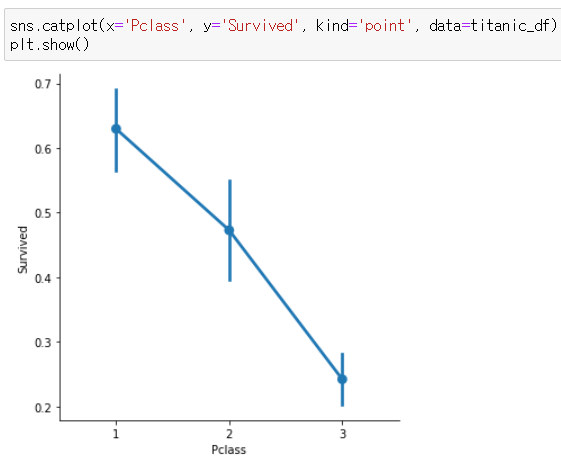
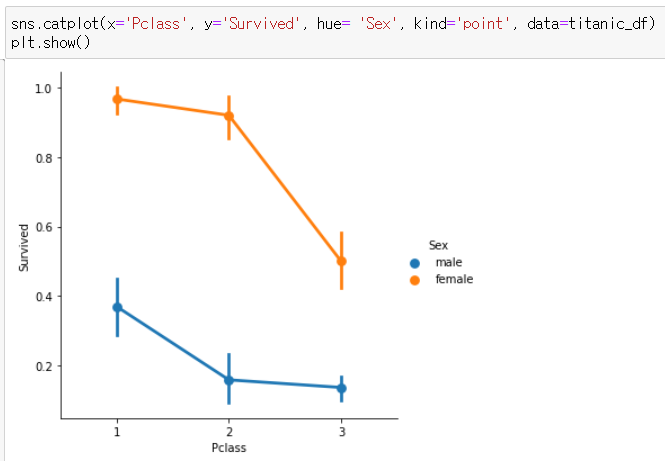
7. 3개 열 한 그래프에 표현하기 (catplot이용)
성별+Pclass VS 생존
sns.catplot(x='Pclass', y='Survived', kind='point', data=titanic_df)
plt.show()
점 : 각 Pclass별 Survived 추정치를 의미
sns.catplot(x='Pclass', y='Survived', hue= 'sex', kind='point', data=titanic_df)
hue : 그래프를 다른 범주로 또 나눌 수 있는 키워드
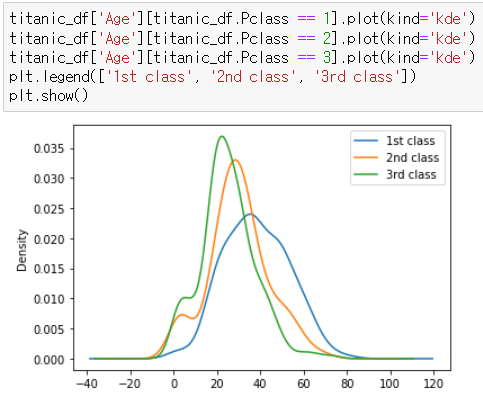
8. Pclass별로 age kde 그래프 그리기
titanic_df['Age'][titanic_df.Pclass == 1].plot(kind='kde')
titanic_df['Age'][titanic_df.Pclass == 2].plot(kind='kde')
titanic_df['Age'][titanic_df.Pclass == 3].plot(kind='kde')
plt.legend(['1st class', '2nd class', '3rd class'])