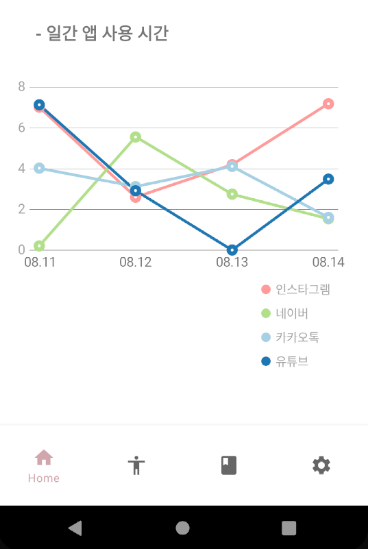
지난 글이었던 HorizontalBarChart에 이어서 MPAnroidChart의 LineChart에 대하여 설명할 것이다.
LineChart View 추가
- xml 레이아웃에 com.github.mikephil.charting.charts.LineChart 를 추가한다.
<com.github.mikephil.charting.charts.LineChart
            android:id="@+id/day_time_chart"
            android:layout_width="360dp"
            android:layout_height="320dp"
            android:layout_gravity="center"
            android:layout_marginTop="30dp"
            android:visibility="gone" />
LineChart 코드
- LineChart의 기본적인 것들을 세팅해준다.
private void configureChartAppearance(LineChart lineChart, int range) {

        lineChart.setExtraBottomOffset(15f); // 간격
        lineChart.getDescription().setEnabled(false); // chart 밑에 description 표시 유무

        // Legend는 차트의 범례
        Legend legend = lineChart.getLegend();
        legend.setVerticalAlignment(Legend.LegendVerticalAlignment.BOTTOM);
        legend.setHorizontalAlignment(Legend.LegendHorizontalAlignment.CENTER);
        legend.setForm(Legend.LegendForm.CIRCLE);
        legend.setFormSize(10);
        legend.setTextSize(13);
        legend.setTextColor(Color.parseColor("#A3A3A3"));
        legend.setOrientation(Legend.LegendOrientation.VERTICAL);
        legend.setDrawInside(false);
        legend.setYEntrySpace(5);
        legend.setWordWrapEnabled(true);
        legend.setXOffset(80f);
        legend.setYOffset(20f);
        legend.getCalculatedLineSizes();

        // XAxis (아래쪽) - 선 유무, 사이즈, 색상, 축 위치 설정
        XAxis xAxis = lineChart.getXAxis();
        xAxis.setDrawAxisLine(false);
        xAxis.setDrawGridLines(false);
        xAxis.setPosition(XAxis.XAxisPosition.BOTTOM); // x축 데이터 표시 위치
        xAxis.setGranularity(1f);
        xAxis.setTextSize(14f);
        xAxis.setTextColor(Color.rgb(118, 118, 118));
        xAxis.setSpaceMin(0.1f); // Chart 맨 왼쪽 간격 띄우기
        xAxis.setSpaceMax(0.1f); // Chart 맨 오른쪽 간격 띄우기

        // YAxis(Right) (왼쪽) - 선 유무, 데이터 최솟값/최댓값, 색상
        YAxis yAxisLeft = lineChart.getAxisLeft();
        yAxisLeft.setTextSize(14f);
        yAxisLeft.setTextColor(Color.rgb(163, 163, 163));
        yAxisLeft.setDrawAxisLine(false);
        yAxisLeft.setAxisLineWidth(2);
        yAxisLeft.setAxisMinimum(0f); // 최솟값
        yAxisLeft.setAxisMaximum((float) RANGE[0][range]); // 최댓값
        yAxisLeft.setGranularity((float) RANGE[1][range]);

        // YAxis(Left) (오른쪽) - 선 유무, 데이터 최솟값/최댓값, 색상
        YAxis yAxis = lineChart.getAxisRight();
        yAxis.setDrawLabels(false); // label 삭제
        yAxis.setTextColor(Color.rgb(163, 163, 163));
        yAxis.setDrawAxisLine(false);
        yAxis.setAxisLineWidth(2);
        yAxis.setAxisMinimum(0f); // 최솟값
        yAxis.setAxisMaximum((float) RANGE[0][range]); // 최댓값
        yAxis.setGranularity((float) RANGE[1][range]);

        // XAxis에 원하는 String 설정하기 (날짜)
        xAxis.setValueFormatter(new ValueFormatter() {

            @Override
            public String getFormattedValue(float value) {
                return LABEL[range][(int) value];
            }
        });
}- HorizontalBarChart와 마찬가지로 LineChart에 표시될 데이터를 생성한다. 다른 점은 DataSet이 하나가 아닌 4개이다. 따라서, BarChart에 보여질 데이터에는 4의 BarDataSet이 있다.
private LineData createChartData(int range) {
        ArrayList<Entry> entry1 = new ArrayList<>(); // 앱1
        ArrayList<Entry> entry2 = new ArrayList<>(); // 앱2
        ArrayList<Entry> entry3 = new ArrayList<>(); // 앱3
        ArrayList<Entry> entry4 = new ArrayList<>(); // 앱4

        LineData chartData = new LineData();

        // 랜덤 데이터 추출
        for (int i = 0; i < 4; i++) {

            float val1 = (float) (Math.random() * RANGE[0][range]); // 앱1 값
            float val2 = (float) (Math.random() * RANGE[0][range]); // 앱2 값
            float val3 = (float) (Math.random() * RANGE[0][range]); // 앱3 값
            float val4 = (float) (Math.random() * RANGE[0][range]); // 앱4 값
            entry1.add(new Entry(i, val1));
            entry2.add(new Entry(i, val2));
            entry3.add(new Entry(i, val3));
            entry4.add(new Entry(i, val4));
        }

        // 4개 앱의 DataSet 추가 및 선 커스텀

        // 앱1
        LineDataSet lineDataSet1 = new LineDataSet(entry1, APPS[0]);
        chartData.addDataSet(lineDataSet1);

        lineDataSet1.setLineWidth(3);
        lineDataSet1.setCircleRadius(6);
        lineDataSet1.setDrawValues(false);
        lineDataSet1.setDrawCircleHole(true);
        lineDataSet1.setDrawCircles(true);
        lineDataSet1.setDrawHorizontalHighlightIndicator(false);
        lineDataSet1.setDrawHighlightIndicators(false);
        lineDataSet1.setColor(Color.rgb(255, 155, 155));
        lineDataSet1.setCircleColor(Color.rgb(255, 155, 155));

        // 앱2
        LineDataSet lineDataSet2 = new LineDataSet(entry2, APPS[1]);
        chartData.addDataSet(lineDataSet2);

        lineDataSet2.setLineWidth(3);
        lineDataSet2.setCircleRadius(6);
        lineDataSet2.setDrawValues(false);
        lineDataSet2.setDrawCircleHole(true);
        lineDataSet2.setDrawCircles(true);
        lineDataSet2.setDrawHorizontalHighlightIndicator(false);
        lineDataSet2.setDrawHighlightIndicators(false);
        lineDataSet2.setColor(Color.rgb(178, 223, 138));
        lineDataSet2.setCircleColor(Color.rgb(178, 223, 138));

        // 앱3
        LineDataSet lineDataSet3 = new LineDataSet(entry3, APPS[2]);
        chartData.addDataSet(lineDataSet3);

        lineDataSet3.setLineWidth(3);
        lineDataSet3.setCircleRadius(6);
        lineDataSet3.setDrawValues(false);
        lineDataSet3.setDrawCircleHole(true);
        lineDataSet3.setDrawCircles(true);
        lineDataSet3.setDrawHorizontalHighlightIndicator(false);
        lineDataSet3.setDrawHighlightIndicators(false);
        lineDataSet3.setColor(Color.rgb(166, 208, 227));
        lineDataSet3.setCircleColor(Color.rgb(166, 208, 227));

        // 앱4
        LineDataSet lineDataSet4 = new LineDataSet(entry4, APPS[3]);
        chartData.addDataSet(lineDataSet4);

        lineDataSet4.setLineWidth(3);
        lineDataSet4.setCircleRadius(6);
        lineDataSet4.setDrawValues(false);
        lineDataSet4.setDrawCircleHole(true);
        lineDataSet4.setDrawCircles(true);
        lineDataSet4.setDrawHorizontalHighlightIndicator(false);
        lineDataSet4.setDrawHighlightIndicators(false);
        lineDataSet4.setColor(Color.rgb(31, 120, 180));
        lineDataSet4.setCircleColor(Color.rgb(31, 120, 180));

        chartData.setValueTextSize(15);
        return chartData;
}- 위의 생성된 BarData를 실제 BarChart 객체에 전달하고 BarChart를 갱신해 데이터를 표시한다.
private void prepareChartData(LineData data, LineChart lineChart) {
lineChart.setData(data); // LineData 전달
lineChart.invalidate(); // LineChart 갱신해 데이터 표시
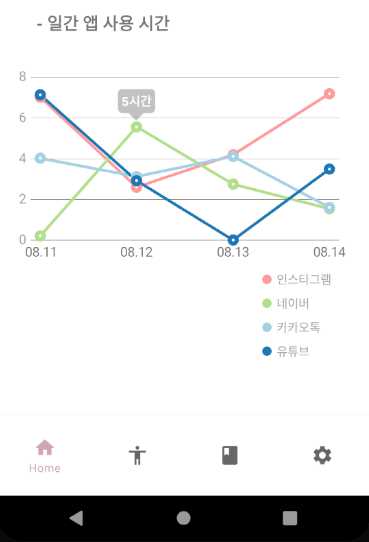
}추가) LineChart의 MarkerView
MarkerView란 Chart에서 특정 데이터 클릭 시 데이터 값을 말풍선으로 보여준다. 여기서는 말풍선 모양의 Marker을 생성한다.
- Marker 커스텀
drawable/bg_marker.xml
<?xml version="1.0" encoding="utf-8"?>
<shape xmlns:android="http://schemas.android.com/apk/res/android"
    android:shape="rectangle">
    <corners android:radius="5dp" />
    <solid android:color="#66676767" />
</shape>
drawable/bg_marker_tail.xml
<?xml version="1.0" encoding="utf-8"?>
<layer-list xmlns:android="http://schemas.android.com/apk/res/android">
    <item>
        <rotate
            android:fromDegrees="45"
            android:pivotX="130%"
            android:pivotY="13%"
            android:toDegrees="45">
            <shape android:shape="rectangle">
                <solid android:color="#66676767" />
                <padding
                    android:bottom="0dp"
                    android:left="0dp"
                    android:right="0dp"
                    android:top="0dp" />
            </shape>
        </rotate>
    </item>
</layer-list>
custom_marker_view.xml
<?xml version="1.0" encoding="utf-8"?>
<RelativeLayout xmlns:android="http://schemas.android.com/apk/res/android"
    xmlns:app="http://schemas.android.com/apk/res-auto"
    android:id="@+id/tvContent"
    android:layout_width="wrap_content"
    android:layout_height="wrap_content"
    android:gravity="center"
    android:orientation="vertical">

    <LinearLayout
        android:layout_width="50dp"
        android:layout_height="40dp"
        android:gravity="center"
        android:orientation="vertical">

    <TextView
        android:id="@+id/tvContentHead"
        android:layout_width="wrap_content"
        android:layout_height="wrap_content"
        android:ellipsize="end"
        android:singleLine="true"
        android:background="@drawable/bg_marker"
        android:layout_centerHorizontal="true"
        android:padding="4dp"
        android:text=""
        android:textAppearance="?android:attr/textAppearanceSmall"
        android:textColor="@android:color/white"
        android:textSize="13sp"
        android:textStyle="bold" />

    <ImageView
        android:id="@+id/tvContentTail"
        android:layout_width="15dp"
        android:layout_height="15dp"
        android:layout_gravity="center_horizontal"
        android:background="@drawable/bg_marker_tail"
        app:layout_constraintTop_toBottomOf="@+id/tvContentHead" />
    </LinearLayout>
</RelativeLayout>- MarkerView 코드
MyMarkerView.java
import android.content.Context;
import android.widget.TextView;

import com.github.mikephil.charting.components.MarkerView;
import com.github.mikephil.charting.data.CandleEntry;
import com.github.mikephil.charting.data.Entry;
import com.github.mikephil.charting.highlight.Highlight;
import com.github.mikephil.charting.utils.MPPointF;
import com.github.mikephil.charting.utils.Utils;

public class MyMarkerView extends MarkerView {

    private TextView tvContent;

    public MyMarkerView(Context context, int layoutResource) {
        super(context, layoutResource);
        tvContent = (TextView) findViewById(R.id.tvContentHead);

    }

    // callbacks everytime the MarkerView is redrawn, can be used to update the
    // content (user-interface)
    @Override
    public void refreshContent(Entry e, Highlight highlight) {

        if (e instanceof CandleEntry) {
            CandleEntry ce = (CandleEntry) e;
            tvContent.setText("" + Utils.formatNumber((int)ce.getHigh(), 0, true) + "시간");
        } else {
            tvContent.setText("" + Utils.formatNumber((int)e.getY(), 0, true) + "시간");
        }

        super.refreshContent(e, highlight);
    }

    @Override
    public MPPointF getOffset() {
        return new MPPointF(-(getWidth() / 2), -getHeight());
    }

}- MarkerView LineChart에 붙이기
MyMarkerView mv1 = new MyMarkerView(getContext(), R.layout.custom_marker_view);
mv1.setChartView(lineChart1);
MyMarkerView mv2 = new MyMarkerView(getContext(), R.layout.custom_marker_view);
mv2.setChartView(lineChart2);
MyMarkerView mv3 = new MyMarkerView(getContext(), R.layout.custom_marker_view);
mv3.setChartView(lineChart3);
lineChart1.setMarker(mv1);
lineChart2.setMarker(mv2);
lineChart3.setMarker(mv3);
결과
- 특정 데이터 클릭 시
HorizontalChart
[안드로이드] MPAndroidChart를 활용한 HorizontalBarChart 사용
참고

Studying!!
혹시 github 주소 알 수 있나요?