Matplotlib 그래프 그리기
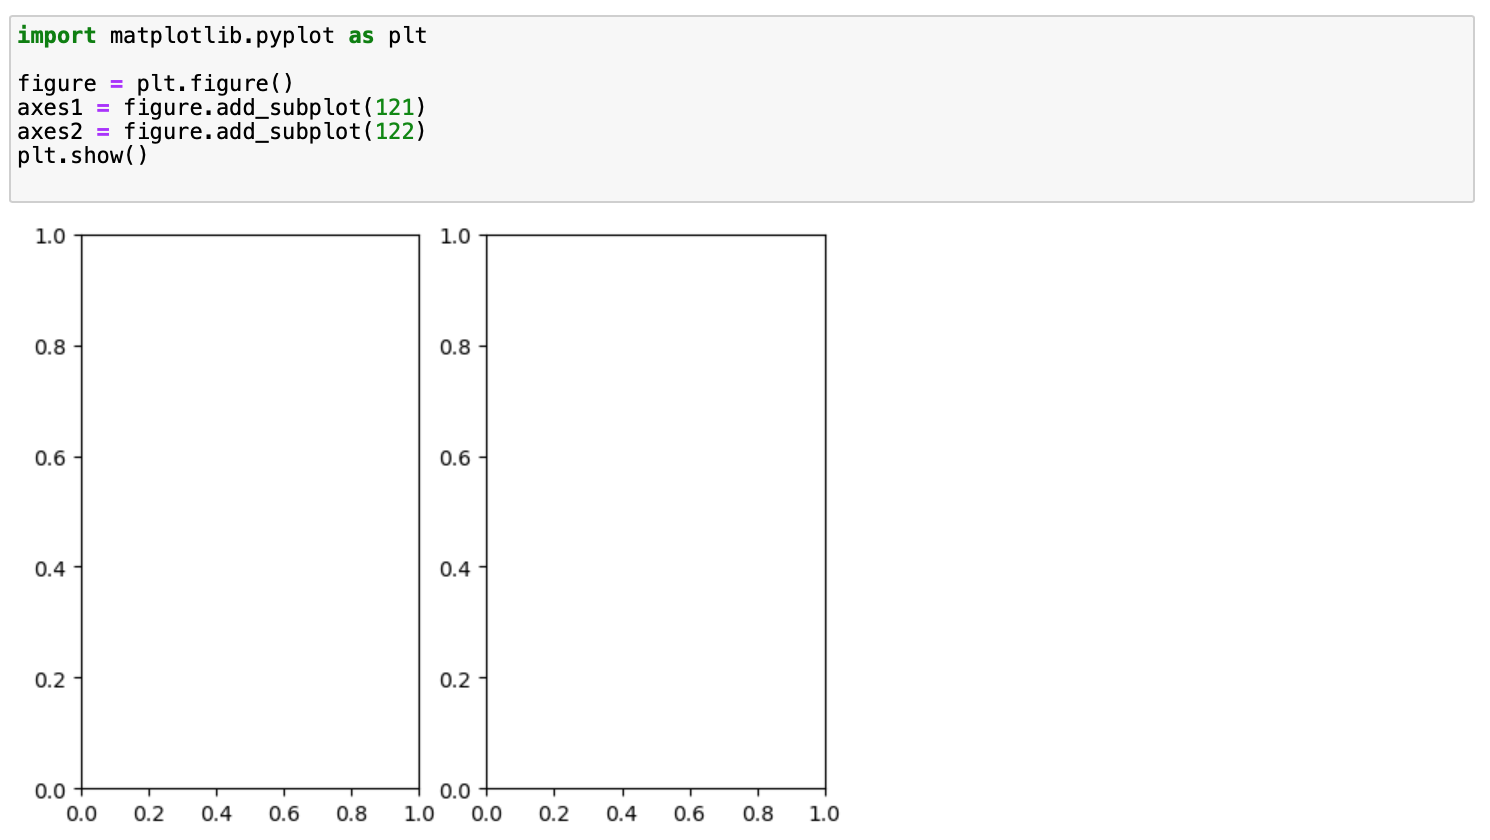
import matplotlib.pyplot as plt

figure = plt.figure()
axes1 = figure.add_subplot(121)
axes2 = figure.add_subplot(122)
plt.show()
📑 bar() 함수를 사용한 기본 막대그래프
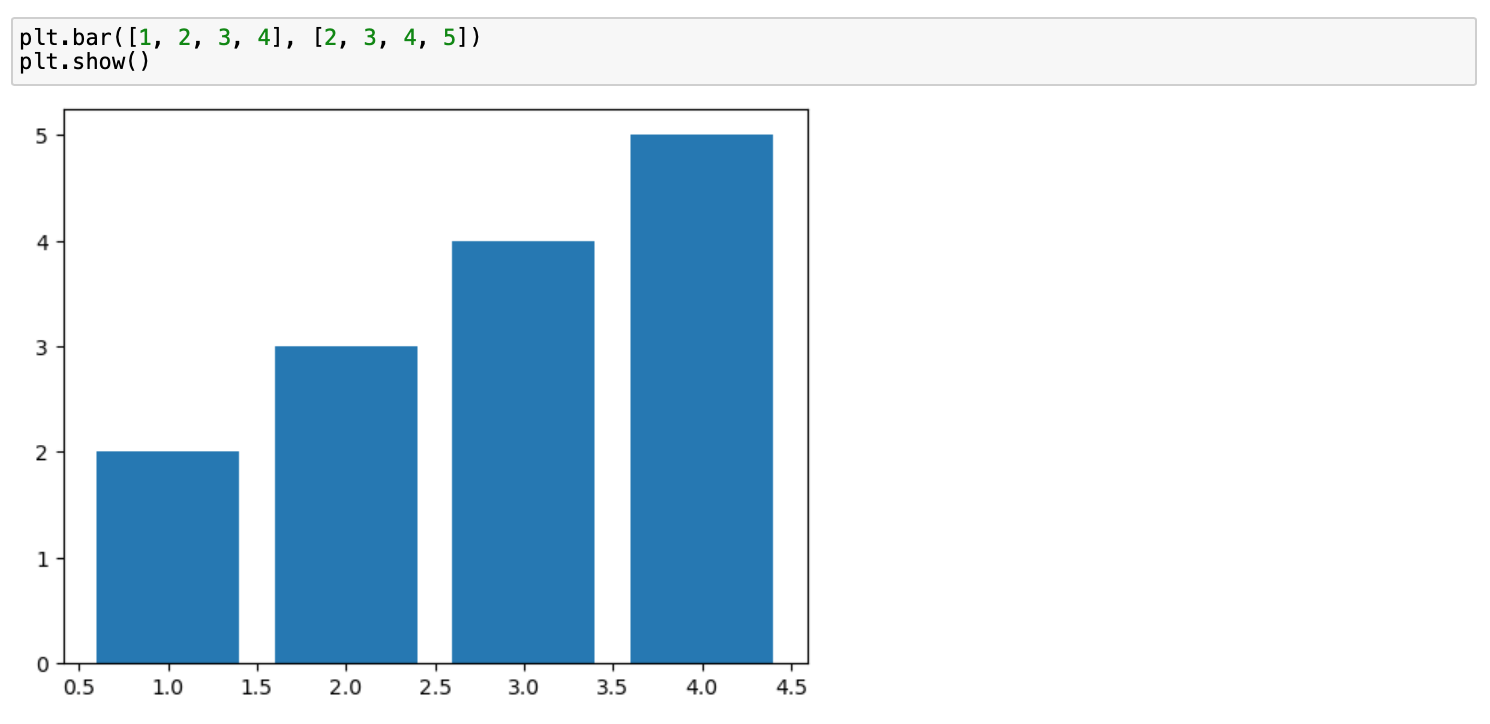
plt.bar([1, 2, 3, 4], [2, 3, 4, 5])
plt.show()
📑 이중 꺾은선 그래프
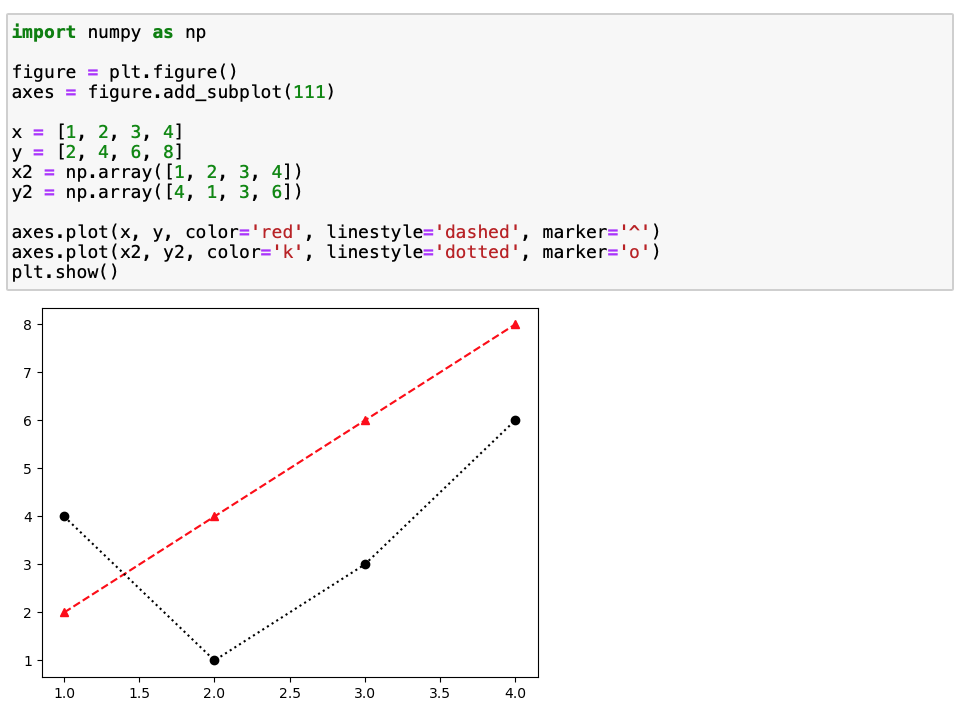
import numpy as np

figure = plt.figure()
axes = figure.add_subplot(111)

x = [1, 2, 3, 4]
y = [2, 4, 6, 8]
x2 = np.array([1, 2, 3, 4])
y2 = np.array([4, 1, 3, 6])

axes.plot(x, y, color='red', linestyle='dashed', marker='^')
axes.plot(x2, y2, color='k', linestyle='dotted', marker='o')
plt.show()
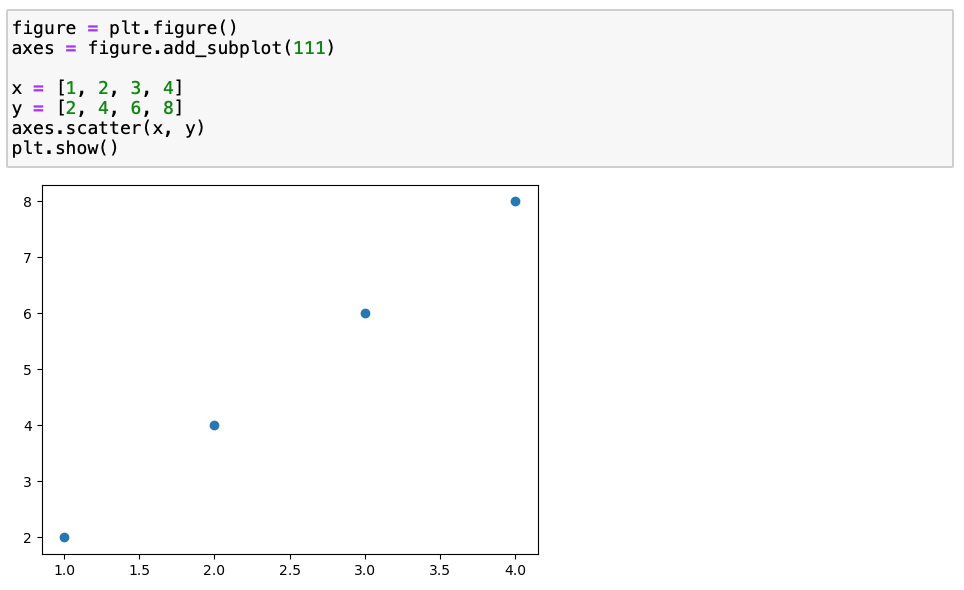
📑 산점도 그리기
figure = plt.figure()
axes = figure.add_subplot(111)

x = [1, 2, 3, 4]
y = [2, 4, 6, 8]
axes.scatter(x, y)
plt.show()
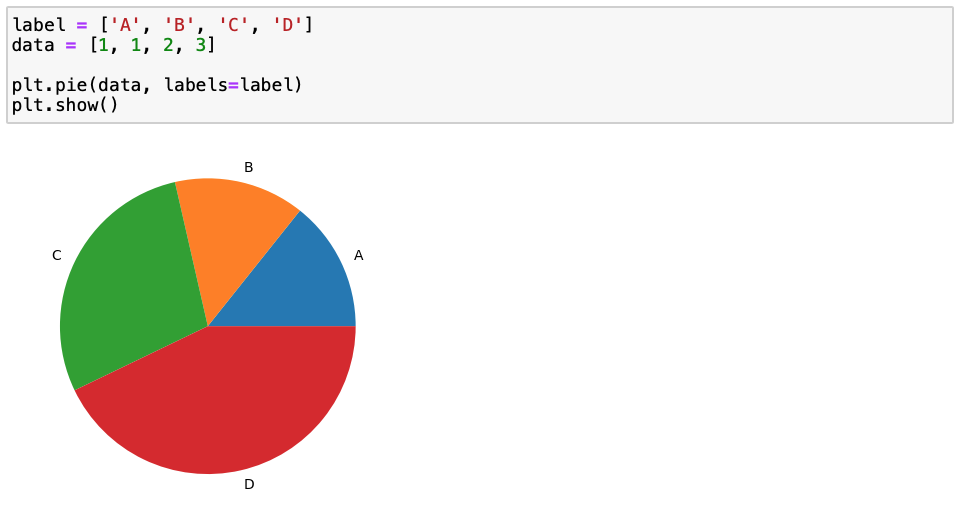
📑 pie() 함수로 원 그래프 그리기
label = ['A', 'B', 'C', 'D']
data = [1, 1, 2, 3]

plt.pie(data, labels=label)
plt.show()
📑 한글 폰트 적용하기
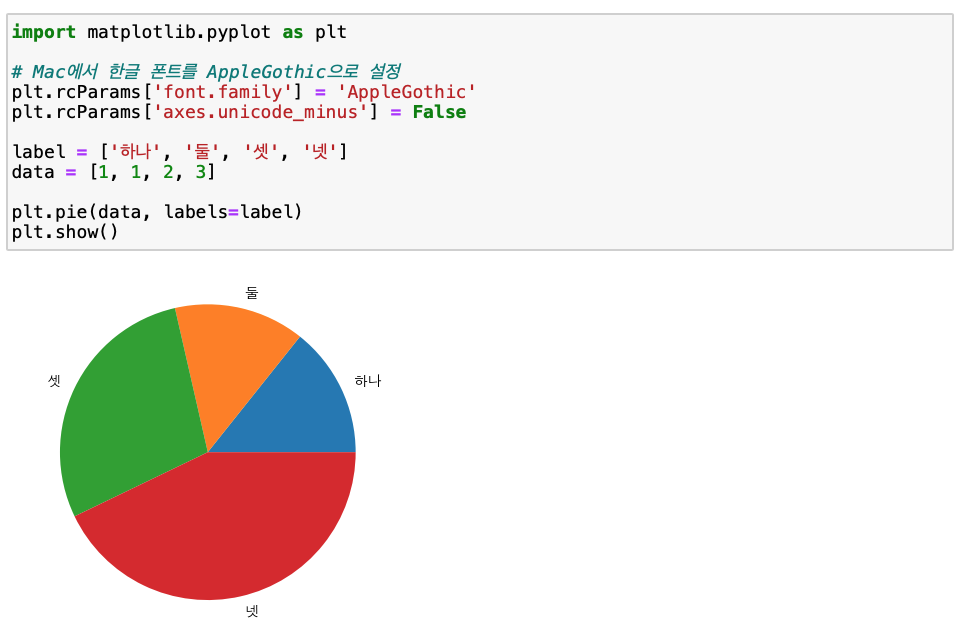
import matplotlib.pyplot as plt
plt.rcParams['font.family'] = 'AppleGothic'
plt.rcParams['axes.unicode_minus'] = False
label = ['하나', '둘', '셋', '넷']
data = [1, 1, 2, 3]
plt.pie(data, labels=label)
plt.show()