Matplotlib 그래프 그리기
Matplotlib 소개 및 설치
pip install matplotlib
기본 선 그래프 그리기
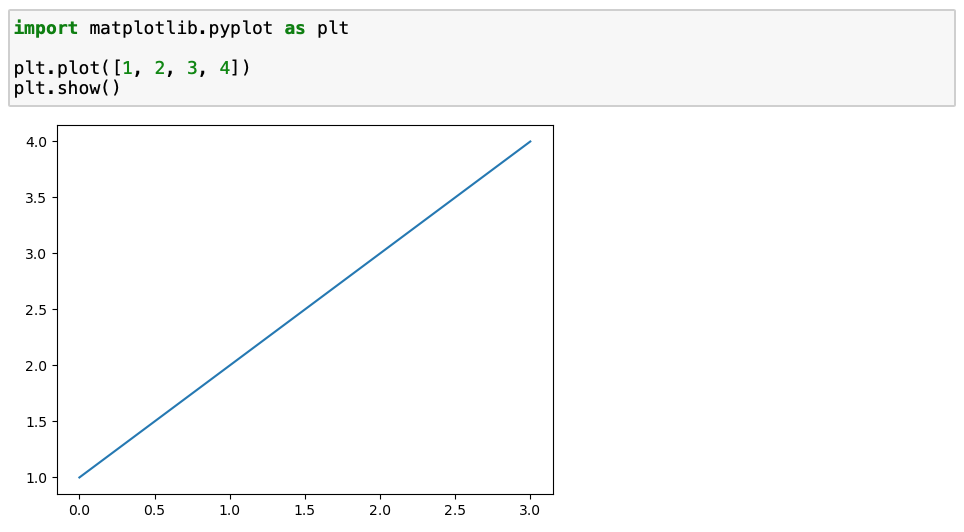
📑 기본 선 그래프
import matplotlib.pyplot as plt

plt.plot([1, 2, 3, 4])
plt.show()
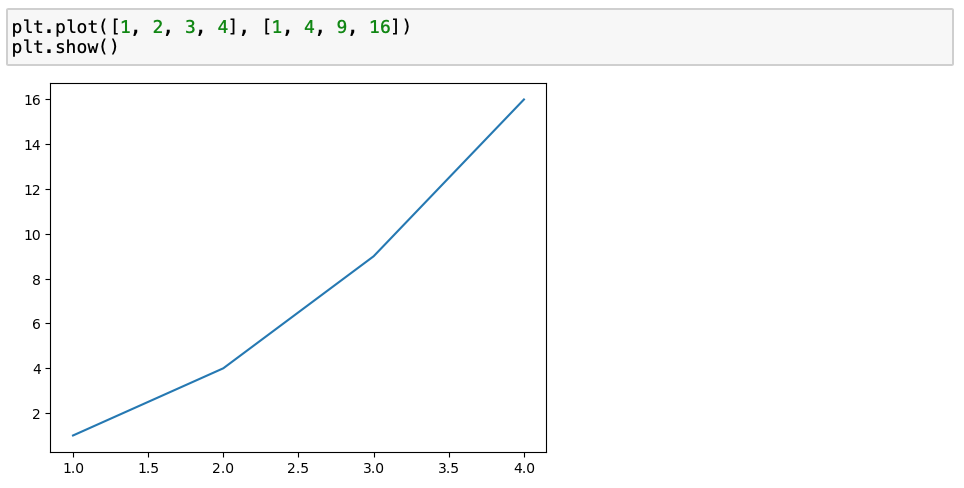
📑 x, y 값 입력하기
plt.plot([1, 2, 3, 4], [1, 4, 9, 16])
plt.show()
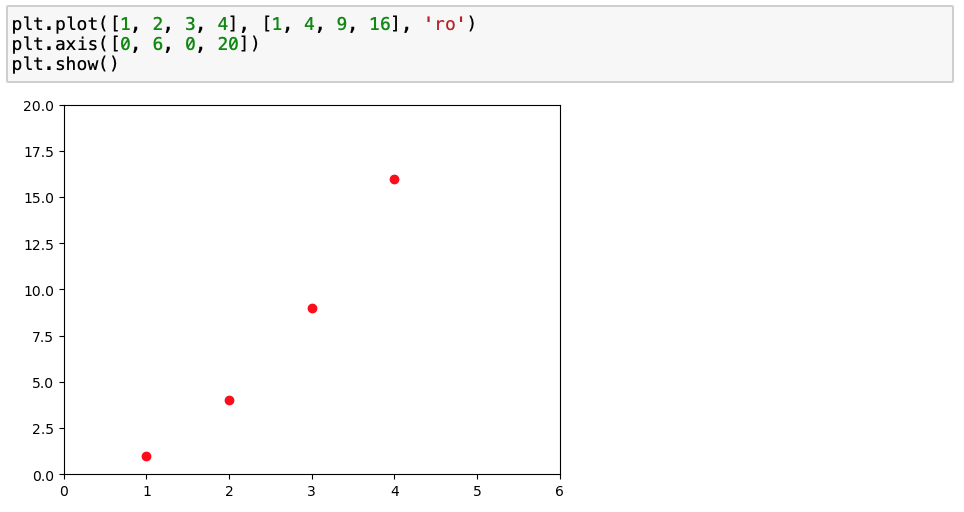
📑 마커, 색상 지정하기
plt.plot([1, 2, 3, 4], [1, 4, 9, 16], 'ro')
plt.axis([0, 6, 0, 20])
plt.show()
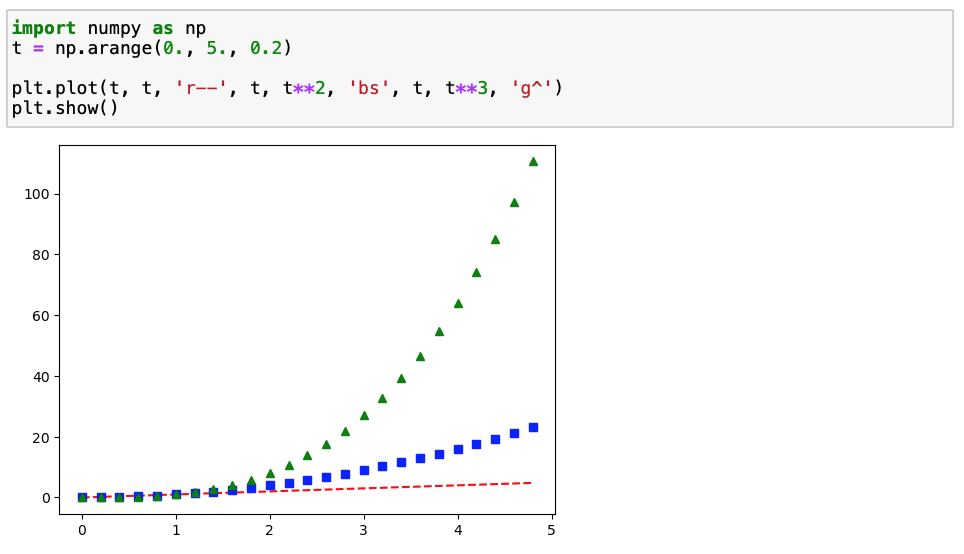
📑 다중 그래프 그리기
import numpy as np
t = np.arange(0., 5., 0.2)

plt.plot(t, t, 'r--', t, t**2, 'bs', t, t**3, 'g^')
plt.show()
레이블 추가하기
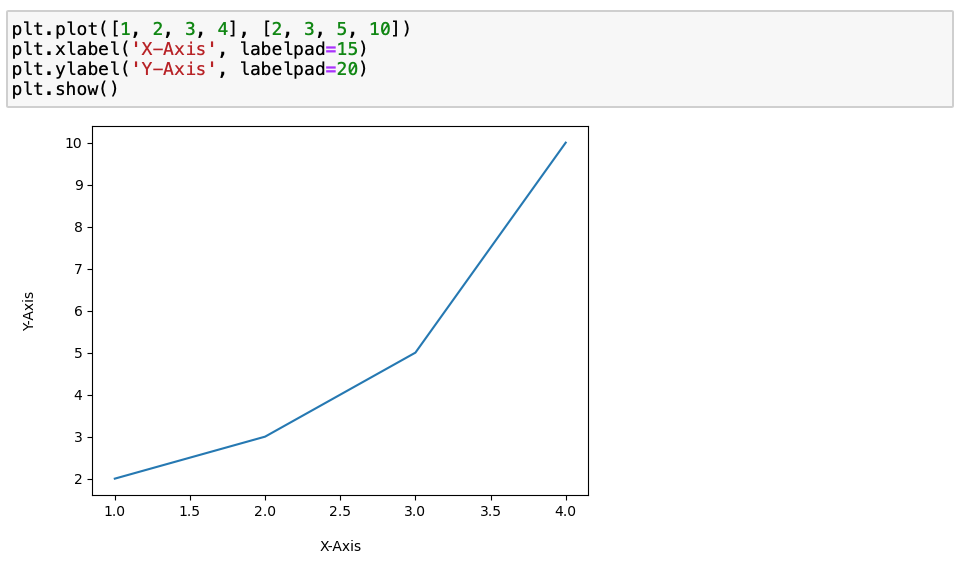
📑 x, y 축 레이블과 여백 설정
plt.plot([1, 2, 3, 4], [2, 3, 5, 10])
plt.xlabel('X-Axis', labelpad=15)
plt.ylabel('Y-Axis', labelpad=20)
plt.show()
범례 추가하기
📑 범례 위치 지정
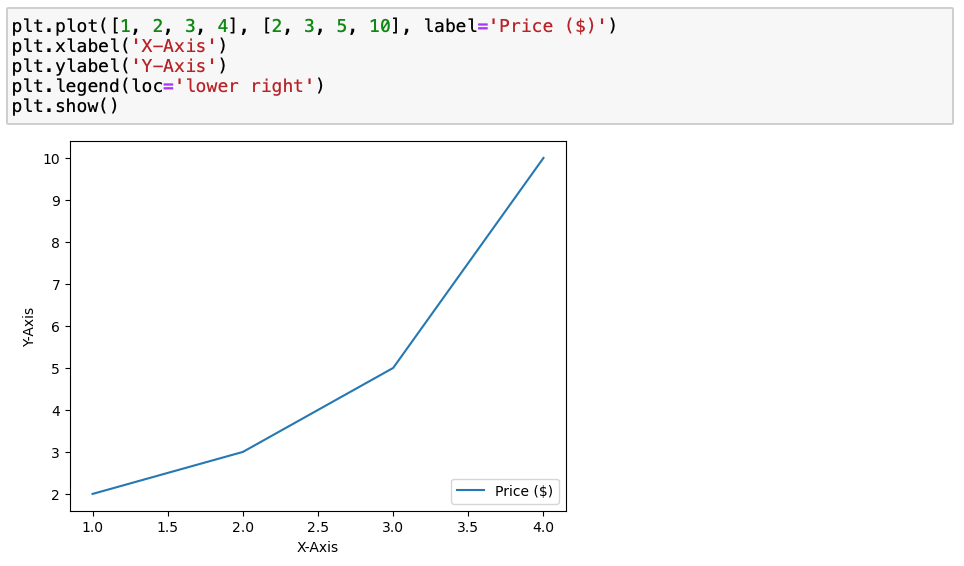
plt.plot([1, 2, 3, 4], [2, 3, 5, 10], label='Price ($)')
plt.xlabel('X-Axis')
plt.ylabel('Y-Axis')
plt.legend(loc='lower right')
plt.show()