# $.ajax 를 사용한 유효성 검사

Controller > Service > Mapper 를 통해
입력받은 id, pw의 중복을 검사하고

결과값을 Controller에서 받아
중복이 있으면 1, 없으면 0을 리턴한다

리턴한 값은 $.ajax에서 json 값으로 들어오며

$.ajax에서 function(json)의 형태로 json의 값에 따라

html(view)에서 어떤 결과를 보여줄지 작성하면 된다

이 때 $.ajax의 url 은 Controller의 Mapping 주소가 되고
method는 post, data값은 id 혹은 pw가 된다
$('#id').val() > id의 value값을 이용하는 $.ajax 문법
success : function(~~)


# chart.js 사용
w3school chart.js 에서 예시코드 가져와서 틀만 가져오고
사용할 데이터만 가공해서 넘기기

ex) List<Map>형태로 컬럼명과 COUNT(*) cnt 값을 가져와서

const xValues = [];
const yValues = [];

json.forEach(function(item){
	xValues.push(item.컬럼명);
	yValues.push(item.cnt);
});
처럼 데이터 넣어서 차트로 데이터 출력하기


# $.ajax의 동기식 방식
$.ajax는 비동기 방식으로 동작하는것이 default이지만
때에 따라 동기식 방식으로 사용하는 경우가 있다

비동기 방식 : 프로그램 실행과 동시에 동작하는것이 아닌
특정 조건에 따라 이벤트가 발생할 때
ex) 버튼 누르기, 이벤트 발생(alert)

동기 방식 : 프로그램 실행과 동시에 동작하는 방식
ex) 그래프 출력, 차트 출력 등

$.ajax를 동기 방식으로 동작시키게 하기 위해서
$.ajax의 속성에 async : false 속성을 추가하면 된다.
(jQuery의 ajax호출은 async : true 가 기본이다 (비동기 방식))


# 405 not allowed method 발생
차트 만들기 프로젝트 진행 중 위 에러 발생

원인 : $.ajax의 method가 post로 되어있는데
url에 적은 /chart/rest/getCountGender RestController의
Mapping 방식이 @GetMapping 으로 되어 있어
$.ajax의 method(Post)와 RestController의(Get)이 충돌하여 발생

해결 : RestController의 Mapping명을
GetMapping에서 PostMapping으로 변경 후 정상 작동


# AWS Lightsail Docker 설치
https://cafe.naver.com/jjdev/16139
HomeController.java (Controller)
package com.gd.chart.controller;

import org.springframework.stereotype.Controller;
import org.springframework.transaction.annotation.Transactional;
import org.springframework.web.bind.annotation.GetMapping;

import lombok.extern.slf4j.Slf4j;

@Controller
@Transactional
@Slf4j
public class HomeController {

	@GetMapping("/home")
	public String home() {

		return "home";
	}

	@GetMapping("/chart2")
	public String chart2() {

		return "chart2";
	}

	@GetMapping("/chart3")
	public String chart3() {

		return "chart3";
	}

	@GetMapping("/chart4")
	public String chart4() {

		return "chart4";
	}
}
HomeRest.java (RestController 데이터 전달용)
package com.gd.chart.rest;

import java.util.List;
import java.util.Map;

import org.springframework.beans.factory.annotation.Autowired;
import org.springframework.web.bind.annotation.PostMapping;
import org.springframework.web.bind.annotation.RestController;

import com.gd.chart.mapper.EmployeesMapper;

@RestController
public class HomeRest {

	@Autowired
	EmployeesMapper employeesMapper;

	@PostMapping("/rest/getCountGender")
	public List<Map<String, Object>> getCountGender(){

		return employeesMapper.selectCountGender();
	}

	@PostMapping("/rest/getCountYear")
	public List<Map<String, Object>> getCountYear(){

		return employeesMapper.selectCountYear();
	}

	@PostMapping("/rest/getCountDname")
	public List<Map<String, Object>> getCountDname(){

		return employeesMapper.selectCountDname();
	}

	@PostMapping("/rest/getSalaryByDname")
	public List<Map<String, Object>> getSalaryByDname(){

		return employeesMapper.selectSalaryByDname();
	}
}
EmployeesMapper.java (Mapper)
package com.gd.chart.mapper;

import java.util.List;
import java.util.Map;

import org.apache.ibatis.annotations.Mapper;

@Mapper
public interface EmployeesMapper {

	List<Map<String, Object>> selectCountGender();

	List<Map<String, Object>> selectCountYear();

	List<Map<String, Object>> selectCountDname();

	List<Map<String, Object>> selectSalaryByDname();
}
EmployeesMapper.xml (Mapper.xml)
<?xml version="1.0" encoding="UTF-8"?>
<!DOCTYPE mapper PUBLIC "-//mybatis.org//DTD Mapper 3.0//EN" "http://mybatis.org/dtd/mybatis-3-mapper.dtd">
<mapper namespace="com.gd.chart.mapper.EmployeesMapper">
	<select id="selectCountGender" resultType="Map">
		SELECT
			gender, COUNT(*) cnt
		FROM
			employees
		GROUP BY
			gender
	</select>

	<select id="selectCountYear" resultType="Map">
		SELECT
			YEAR(hire_date) hireYear, COUNT(*) cnt
		FROM
			employees
		GROUP BY
			YEAR(hire_date)
		ORDER BY
			YEAR(hire_date)
	</select>

	<select id="selectCountDname" resultType="Map">
		SELECT
			t.dept_name dname, COUNT(*) cnt
		FROM
			(SELECT emp_no, dept_name
			FROM dept_emp de INNER JOIN departments d
			ON de.dept_no = d.dept_no
			WHERE to_date = '9999-01-01') t
		GROUP BY
			t.dept_name
	</select>

	<select id="selectSalaryByDname" resultType="Map">
		SELECT
			t.dept_name dname, SUM(t.salary) salSum, ROUND(AVG(t.salary)) salAvg, MAX(t.salary) salMax, MIN(t.salary) salMin
		FROM
			(SELECT s.emp_no emp_no, s.salary salary, d.dept_name dept_name
			FROM
				(SELECT emp_no, salary
				FROM salaries
				WHERE to_date = '9999-01-01') s
					INNER join
					(SELECT emp_no, dept_no
					FROM dept_emp
					WHERE to_date = '9999-01-01') de
					ON s.emp_no = de.emp_no
						INNER JOIN departments d
						ON de.dept_no = d.dept_no) t
		GROUP BY
			t.dept_name
		ORDER BY
			t.dept_name;
	</select>
</mapper>
home.jsp (view)
<%@ page language="java" contentType="text/html; charset=UTF-8" pageEncoding="UTF-8"%>
<!DOCTYPE html>
<html>
<head>
<meta charset="UTF-8">
<title>Insert title here</title>
<script src="https://ajax.googleapis.com/ajax/libs/jquery/3.7.1/jquery.min.js"></script>
<script src="https://cdnjs.cloudflare.com/ajax/libs/Chart.js/2.9.4/Chart.js"></script>
</head>
<body>
	<h1>HOME</h1>
	<canvas id="myChart" style="width:100%;max-width:700px"></canvas>

	<script>
		const xValues = [];
		const yValues = [];
		const barColors = ["blue", "red"];

		$.ajax({
			async:false,	// 동기로 요청 (default는 비동기)
			url:'/chart/rest/getCountGender',
			method:'post',
			success:function(json){
				console.log("json : " + json);
				// [{'M':179973}, {'F':120051}]
				json.forEach(function(item){
					xValues.push(item.gender);
					yValues.push(item.cnt);
				});
				console.log("xValues : " + xValues);
				console.log("yValues : " + yValues);
			}
		});

		new Chart("myChart", {
		  type: "bar",
		  data: {
		    labels: xValues,
		    datasets: [{
		      backgroundColor: barColors,
		      data: yValues
		    }]
		  },
		  options: {
		    legend: {display: false},
		    title: {
		      display: true,
		      text: "World Wine Production 2018"
		    },
		  scales : {
				yAxes : [ {
					ticks : {
						beginAtZero : true // 0부터 시작하게 합니다.
					}
				} ]
			}
		  }

		});
	</script>
</body>
</html>
home.jsp 출력결과
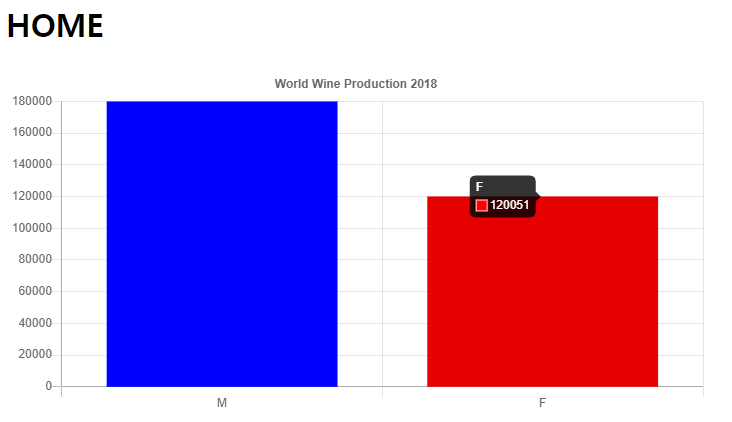
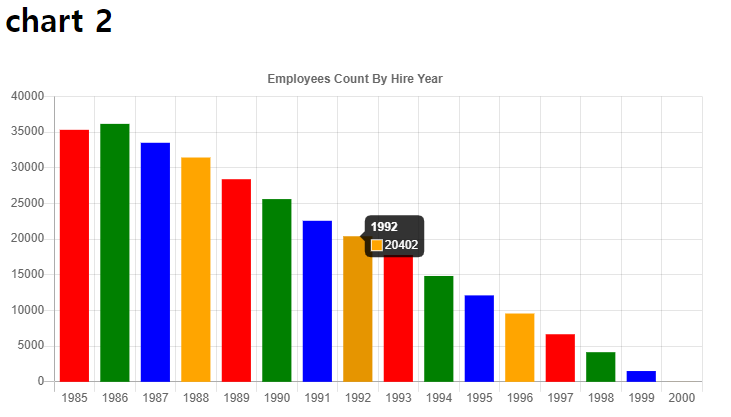
chart2.jsp (view)
<%@ page language="java" contentType="text/html; charset=UTF-8" pageEncoding="UTF-8"%>
<!DOCTYPE html>
<html>
<head>
<meta charset="UTF-8">
<title>Insert title here</title>
<script src="https://ajax.googleapis.com/ajax/libs/jquery/3.7.1/jquery.min.js"></script>
<script src="https://cdnjs.cloudflare.com/ajax/libs/Chart.js/2.9.4/Chart.js"></script>
</head>
<body>
	<h1>chart 2</h1>

	<canvas id="myChart" style="width:100%;max-width:700px"></canvas>

	<script>
		const xValues = [];
		const yValues = [];
		const barColors = ["red", "green","blue","orange", "red", "green","blue","orange", "red", "green","blue","orange", "red", "green","blue","orange"];

		$.ajax({
			async:false,	// $.ajax 를 동기식으로 바꿔주기
			url:'/chart/rest/getCountYear',	// RestController 를 이용하여 차트에 사용할 데이터 가져오기
			method:'post',	// 데이터를 가져올 RestController의 Mapping 방식과 맞춰주기 (post)
		//	data : // 데이터를 가져와서 단순히 출력하는 것이므로 data: 속성은 불필요
			success:function(json){
				console.log("json : " + json);

				json.forEach(function(item){
					xValues.push(item.hireYear);
					yValues.push(item.cnt);
				});
				console.log("xValues : " + xValues);
				console.log("yValues : " + yValues);
			}
		});

		new Chart("myChart", {
		  type: "bar",
		  data: {
		    labels: xValues,
		    datasets: [{
		      backgroundColor: barColors,
		      data: yValues
		    }]
		  },
		  options: {
		    legend: {display: false},
		    title: {
		      display: true,
		      text: "Employees Count By Hire Year"
		    },
		    scales : {
				yAxes : [ {
					ticks : {
						beginAtZero : true
					}
				} ]
			}
		  }
		});
	</script>
</body>
</html>
chart2.jsp 출력결과

chart3.jsp (view)
<%@ page language="java" contentType="text/html; charset=UTF-8" pageEncoding="UTF-8"%>
<!DOCTYPE html>
<html>
<head>
<meta charset="UTF-8">
<title>Insert title here</title>
<script src="https://ajax.googleapis.com/ajax/libs/jquery/3.7.1/jquery.min.js"></script>
<script src="https://cdnjs.cloudflare.com/ajax/libs/Chart.js/2.9.4/Chart.js"></script>
</head>
<body>
	<h1>Count Employees By Department Name</h1>

	<canvas id="myChart" style="width:100%;max-width:700px"></canvas>

	<script>
		const xValues = [];
		const yValues = [];
		const barColors = ["red", "green","blue","orange","brown", "red", "green","blue","orange"];

		$.ajax({
			async:false,
			url:'/chart/rest/getCountDname',
			method:'post',
		//	data:	데이터 가져와서 출력하는 것 뿐이므로 data 속성 필요없음
			success:function(json){
				console.log("json : " + json);

				json.forEach(function(item){
					xValues.push(item.dname);
					yValues.push(item.cnt);
				});
				console.log("xValues : " + xValues);
				console.log("yValues : " + yValues);

			}
		});

		new Chart("myChart", {
		  type: "horizontalBar",
		  data: {
		    labels: xValues,
		    datasets: [{
		      backgroundColor: barColors,
		      data: yValues
		    }]
		  },
		  options: {
		    legend: {display: false},
		    title: {
		      display: true,
		      text: "Count Employees By Department Name"
		    },
		    scales : {
				yAxes : [ {
					ticks : {
						beginAtZero : true
					}
				} ]
			}
		  }
		});
	</script>
</body>
</html>
chart3.jsp 출력결과
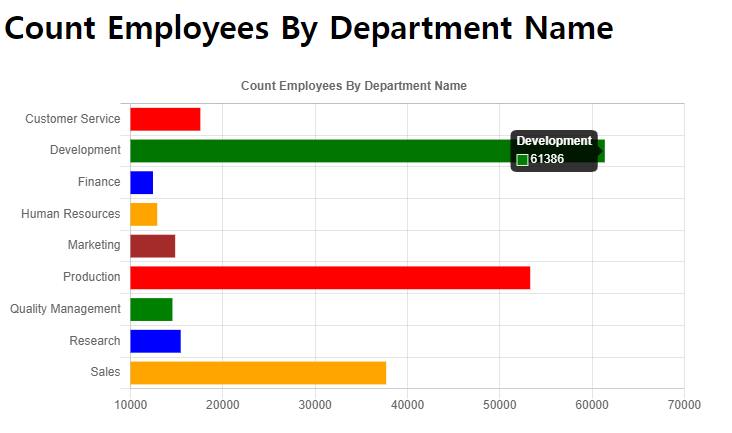
chart4.jsp (view)
<%@ page language="java" contentType="text/html; charset=UTF-8" pageEncoding="UTF-8"%>
<!DOCTYPE html>
<html>
<head>
<meta charset="UTF-8">
<title>Total Salaries By DepartMent Name</title>
<script src="https://ajax.googleapis.com/ajax/libs/jquery/3.7.1/jquery.min.js"></script>
<script src="https://cdnjs.cloudflare.com/ajax/libs/Chart.js/2.9.4/Chart.js"></script>
</head>
<body>
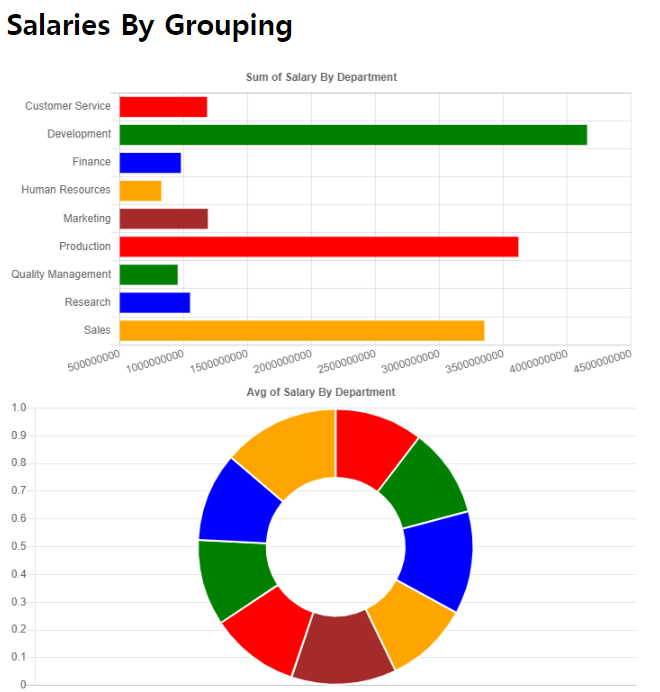
<h1>Salaries By Grouping</h1>
<canvas id="myChart" style="width:100%;max-width:700px"></canvas>
<canvas id="myChart2" style="width:100%;max-width:700px"></canvas>
<canvas id="myChart3" style="width:100%;max-width:700px"></canvas>
<canvas id="myChart4" style="width:100%;max-width:700px"></canvas>
<script>
const xValues = [];
const yValues = [];
const xAvgValues = [];
const yAvgValues = [];
const xMaxValues = [];
const yMaxValues = [];
const xMinValues = [];
const yMinValues = [];
const barColors = ["red", "green","blue","orange","brown", "red", "green","blue","orange"];
$.ajax({
async:false, // 비동기방식 ajax를 동기식으로 작동하도록 설정
url:'/chart/rest/getSalaryByDname',
method:'post',
// data: // select 한 데이터를 출력할 뿐이라 data 속성은 필요없음
success:function(json){
console.log("json : " + json);
json.forEach(function(item){
xValues.push(item.dname);
yValues.push(item.salSum);
xAvgValues.push(item.dname);
yAvgValues.push(item.salAvg);
xMaxValues.push(item.dname);
yMaxValues.push(item.salMax);
xMinValues.push(item.dname);
yMinValues.push(item.salMin);
});
console.log("xValues : " + xValues);
console.log("yValues : " + yValues);
}
});
new Chart("myChart", {
type: "horizontalBar",
data: {
labels: xValues,
datasets: [{
backgroundColor: barColors,
data: yValues
}]
},
options: {
legend: {display: false},
title: {
display: true,
text: "Sum of Salary By Department"
},
scales : {
yAxes : [ {
ticks : {
beginAtZero : true
}
} ]
}
}
});
new Chart("myChart2", {
type: "doughnut",
data: {
labels: xAvgValues,
datasets: [{
backgroundColor: barColors,
data: yAvgValues
}]
},
options: {
legend: {display: false},
title: {
display: true,
text: "Avg of Salary By Department"
},
scales : {
yAxes : [ {
ticks : {
beginAtZero : true
}
} ]
}
}
});
new Chart("myChart3", {
type: "pie",
data: {
labels: xMaxValues,
datasets: [{
backgroundColor: barColors,
data: yMaxValues
}]
},
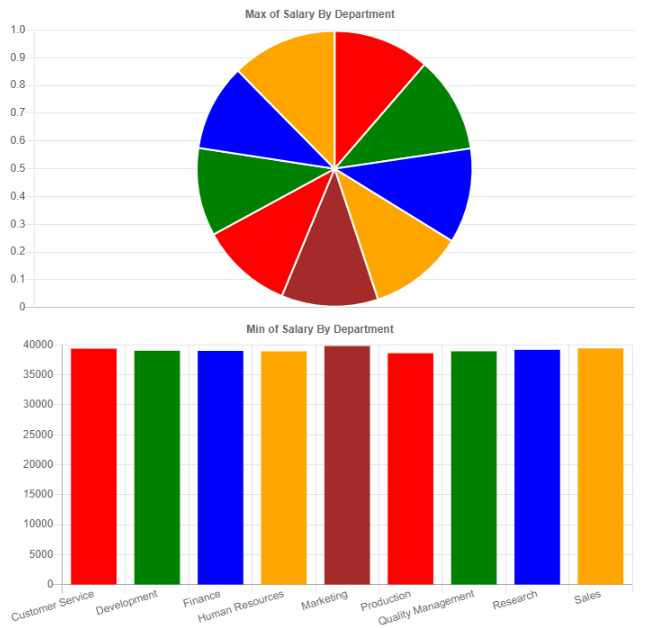
options: {
legend: {display: false},
title: {
display: true,
text: "Max of Salary By Department"
},
scales : {
yAxes : [ {
ticks : {
beginAtZero : true
}
} ]
}
}
});
new Chart("myChart4", {
type: "bar",
data: {
labels: xMinValues,
datasets: [{
backgroundColor: barColors,
data: yMinValues
}]
},
options: {
legend: {display: false},
title: {
display: true,
text: "Min of Salary By Department"
},
scales : {
yAxes : [ {
ticks : {
beginAtZero : true
}
} ]
}
}
});
</script>
</body>
</html>chart4.jsp 출력결과

Road OF Developer