
# 클라우드의 흐름

온프레미스 > 가상머신(VM) > 컨테이너 방식

온프레미스 : 하나의 OS에서 하나의 App만 운영 가능
가상머신(VM) : 하나의 OS위에 여러 OS를 사용할 수 있음
컨테이너 방식(Docker) : 하나의 OS위에 여러 네트워크를 컨테이너로
가상화시켜 배포할 수 있음

컨테이너 운영/관리 환경(쿠버네티스)
: 컨테이너들을 운영/관리할 수 있는 Sass


# 성별에 따른 입사년도 cnt로 차트 만들기 ★★
입사년도, 남자cnt, 여자cnt가 있을 때

내가 한 방법 : 쿼리에 where 조건을 줘서 ajax를 두번썼다
>> interface도 2번 들어가서 매우 비효율적인 코드 방식이었음

우리 팀 방법 : ajax의 json 코드 안에서 if 조건을 주어
>> gender가 남자일때만 남자cnt를 넣고 그렇지 않으면
여자cnt를 넣는 방식으로 짜서 코드가 매우 간결해지고 효율적이됨
chart5.jsp (view)
<%@ page language="java" contentType="text/html; charset=UTF-8" pageEncoding="UTF-8"%>
<!DOCTYPE html>
<html>
<head>
<meta charset="UTF-8">
<title>Insert title here</title>
<script src="https://ajax.googleapis.com/ajax/libs/jquery/3.7.1/jquery.min.js"></script>
<script src="https://cdnjs.cloudflare.com/ajax/libs/Chart.js/2.9.4/Chart.js"></script>
</head>
<body>
	<h1>Gender Count By Hire Date</h1>
	<canvas id="myChart" style="width:100%;max-width:600px"></canvas>
</body>
<script>
	const xValues = [];
	const mData = [];
	const fData = [];

	$.ajax({
		async:false,	// ajax의 비동기방식을 동기화시키기
		url:'/chart/rest/getGenderCountByHiredate',
		method:'post',
		success:function(json){
			console.log("json : " + json);

			json.forEach(function(item){
				if(item.gender === 'M'){
					xValues.push(item.y);
					mData.push(item.cnt);
				}else{
					fData.push(item.cnt);
				}
			});

			console.log("xValues : " + xValues);
			console.log("mData : " + mData);
			console.log("fData : " + fData);
		}
	});

	new Chart("myChart", {
	  type: "line",
	  data: {
	    labels: xValues,
	    datasets: [{
	      data: mData,
	      borderColor: "blue",
	      fill: false
	    }, {
	      data: fData,
	      borderColor: "red",
	      fill: false
	    }]
	  },
	  options: {
	    legend: {display: false}
	  }
	});
</script>
</html>
chart5.jsp 출력결과
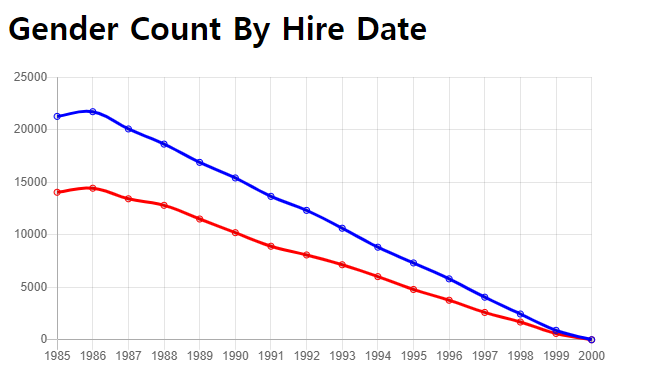
chart6.jsp (view)
<%@ page language="java" contentType="text/html; charset=UTF-8" pageEncoding="UTF-8"%>
<!DOCTYPE html>
<html>
<head>
<meta charset="UTF-8">
<title>Insert title here</title>
<script src="https://ajax.googleapis.com/ajax/libs/jquery/3.7.1/jquery.min.js"></script>
<script src="https://cdnjs.cloudflare.com/ajax/libs/Chart.js/2.9.4/Chart.js"></script>
</head>
<body>
	<h1>연도별 부서인원</h1>

	<canvas id="myChart" style="width:100%;max-width:700px"></canvas>

	<script>
		const xValues = [];
		const aData = [];
		const bData = [];
		const cData = [];
		const dData = [];
		const eData = [];
		const fData = [];
		const gData = [];
		const hData = [];
		const iData = [];

		$.ajax({
			async:false,
			url:'/chart/rest/getselectCountByDept',
			method:'post',
			success:function(json){
				console.log("json : " + json);

				json.forEach(function(item){
					if(item.deptName === 'Customer Service'){
						xValues.push(item.y);
						aData.push(item.cnt);
					}else if(item.deptName === 'Development'){
						bData.push(item.cnt);
					}else if(item.deptName === 'Finance'){
						cData.push(item.cnt);
					}else if(item.deptName === 'Human Resources'){
						dData.push(item.cnt);
					}else if(item.deptName === 'Marketing'){
						eData.push(item.cnt);
					}else if(item.deptName === 'Production'){
						fData.push(item.cnt);
					}else if(item.deptName === 'Quality Management'){
						gData.push(item.cnt);
					}else if(item.deptName === 'Research'){
						hData.push(item.cnt);
					}else{
						iData.push(item.cnt);
					}
				});

				console.log("xValues : " + xValues);
				console.log("aData : " + aData);
				console.log("bData : " + bData);
				console.log("cData : " + cData);
				console.log("dData : " + dData);
				console.log("eData : " + eData);
				console.log("fData : " + fData);
				console.log("gData : " + gData);
				console.log("hData : " + hData);
				console.log("iData : " + iData);
			}
		});

		new Chart("myChart", {
			  type: "line",
			  data: {
			    labels: xValues,
			    datasets: [{
			      label: "Customer Service",
			      data: aData,
			      borderColor: "blue",
			      fill: false
			    }, {
			   	  label: "Development",
			      data: bData,
			      borderColor: "red",
			      fill: false
			    }, {
			      label: "Finance",
			      data: cData,
			      borderColor: "green",
			      fill: false
				}, {
				  label: "Human Resources",
			      data: dData,
			      borderColor: "yellow",
			      fill: false
				}, {
				  label: "Marketing",
			      data: eData,
			      borderColor: "orange",
			      fill: false
				}, {
				  label: "Production",
			      data: fData,
			      borderColor: "gray",
			      fill: false
				}, {
				  label: "Quality Management",
			      data: gData,
			      borderColor: "purple",
			      fill: false
				}, {
				  label: "Research",
			      data: hData,
			      borderColor: "skyblue",
			      fill: false
				}, {
				  label: "Sales",
			      data: iData,
			      borderColor: "black",
			      fill: false
				}]
			  },
			  options: {
			    legend: {display: true}
			  }
			});
	</script>
</body>
</html>
chart6.jsp 출력결과
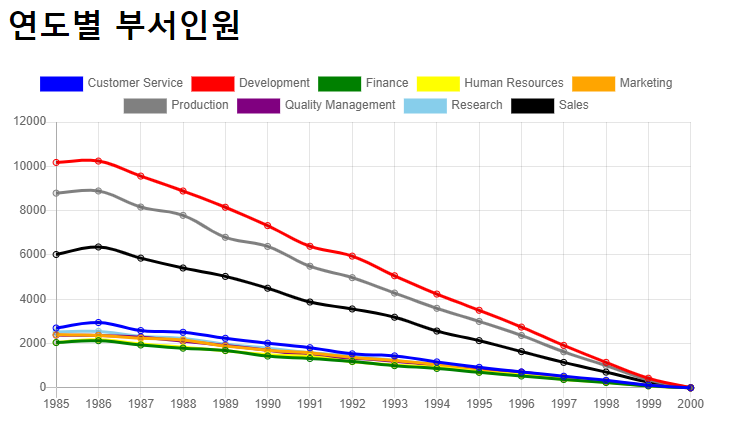
chart7.jsp (view)
<%@ page language="java" contentType="text/html; charset=UTF-8" pageEncoding="UTF-8"%>
<!DOCTYPE html>
<html>
<head>
<meta charset="UTF-8">
<title>Insert title here</title>
<script src="https://ajax.googleapis.com/ajax/libs/jquery/3.7.1/jquery.min.js"></script>
<script src="https://cdnjs.cloudflare.com/ajax/libs/Chart.js/2.9.4/Chart.js"></script>
</head>
<body>
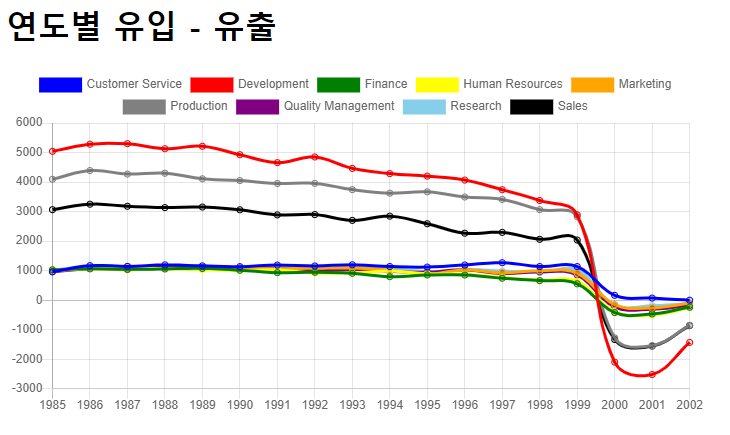
<h1>연도별 유입 - 유출</h1>
<canvas id="myChart" style="width:100%;max-width:700px"></canvas>
<script>
const xValues = [];
const aData = [];
const bData = [];
const cData = [];
const dData = [];
const eData = [];
const fData = [];
const gData = [];
const hData = [];
const iData = [];
$.ajax({
async:false,
url:'/chart/rest/getCountIn',
method:'post',
success:function(json){
console.log("json : " + json);
json.forEach(function(item){
if(item.deptName === 'Customer Service'){
xValues.push(item.y);
aData.push(item.cnt);
}else if(item.deptName === 'Development'){
bData.push(item.cnt);
}else if(item.deptName === 'Finance'){
cData.push(item.cnt);
}else if(item.deptName === 'Human Resources'){
dData.push(item.cnt);
}else if(item.deptName === 'Marketing'){
eData.push(item.cnt);
}else if(item.deptName === 'Production'){
fData.push(item.cnt);
}else if(item.deptName === 'Quality Management'){
gData.push(item.cnt);
}else if(item.deptName === 'Research'){
hData.push(item.cnt);
}else{
iData.push(item.cnt);
}
});
console.log("xValues : " + xValues);
console.log("aData : " + aData);
console.log("bData : " + bData);
console.log("cData : " + cData);
console.log("dData : " + dData);
console.log("eData : " + eData);
console.log("fData : " + fData);
console.log("gData : " + gData);
console.log("hData : " + hData);
console.log("iData : " + iData);
}
});
new Chart("myChart", {
type: "line",
data: {
labels: xValues,
datasets: [{
label: "Customer Service",
data: aData,
borderColor: "blue",
fill: false
}, {
label: "Development",
data: bData,
borderColor: "red",
fill: false
}, {
label: "Finance",
data: cData,
borderColor: "green",
fill: false
}, {
label: "Human Resources",
data: dData,
borderColor: "yellow",
fill: false
}, {
label: "Marketing",
data: eData,
borderColor: "orange",
fill: false
}, {
label: "Production",
data: fData,
borderColor: "gray",
fill: false
}, {
label: "Quality Management",
data: gData,
borderColor: "purple",
fill: false
}, {
label: "Research",
data: hData,
borderColor: "skyblue",
fill: false
}, {
label: "Sales",
data: iData,
borderColor: "black",
fill: false
}]
},
options: {
legend: {display: true}
}
});
</script>
</body>
</html>chart7.jsp 출력결과

Road OF Developer