이 글에서는 Prometheus와 Grafana가 무엇인지 그리고 라즈베리파이 4에 Prometheus와 Grafana 기반으로 시스템 리소스부터 데이터베이스 상태까지 통합으로 모니터링 하는 시스템을 구축하는 방법에 대해 다룹니다
목차
- 개요
- Prometheus와 Grafana 소개
- 사전 준비사항
- Docker Compose 설정
- 시스템 모니터링 구성
- 데이터베이스 모니터링 추가
- Grafana 대시보드 설정
- 알림 설정 구성
- 마무리
1. 개요
개인 프로젝트를 운영하면서 서버 상태를 실시간으로 모니터링하고 싶었습니다
회사에서 인프라 팀이 Prometheus와 Grafana를 사용 중이라 익숙하기도 하고
라즈베리파이4 (8G) 정도로도 충분히 돌릴 수 있어 세팅을 해보게 되었습니다
이번 프로젝트의 목표는 아래와 같은 모니터링 시스템 입니다
- 시스템 리소스 모니터링 (CPU, 메모리, 디스크, 네트워크)
- 데이터베이스 성능 모니터링
- 웹 애플리케이션 상태 확인
- 실시간 알림 및 대시보드 제공
2. Prometheus와 Grafana 소개
Prometheus
역할: 메트릭 수집 및 저장
Prometheus는 시계열 데이터베이스입니다.
쉽게 말해 "시간의 흐름에 따른 수치 변화"를 기록하는 저장소라고 생각하면 됩니다.
동작 방식:
- 수집: 30초마다 각 서버에 "CPU 사용률 몇 %야?" 하고 물어봄
- 저장: "2024-08-02 15:30:00 - CPU 75%" 이런 식으로 시간과 함께 저장
- 쿼리: PromQL로 "지난 1시간 동안 CPU 평균은?" 같은 질문에 답변
실제 데이터 예시:
node_cpu_usage{instance="raspberrypi"}
2024-08-02 15:30:00  75%
2024-08-02 15:30:30  78%
2024-08-02 15:31:00  72%
Grafana
역할: 시각화 및 대시보드
Grafana는 차트 제작 도구입니다. Prometheus에 저장된 숫자 데이터를 보기 좋은 그래프로 변환해줍니다.
동작 방식:
- 데이터 요청: Prometheus에게 "지난 1시간 CPU 데이터 주세요"
- 시각화: 받은 데이터를 선 그래프, 게이지, 표 등으로 표현
- 대시보드: 여러 그래프를 한 화면에 배치해서 종합 현황 제공
전체 시스템 구성도
┌─────────────────┐    ┌──────────────┐    ┌─────────────┐
│   Application   │    │  Database    │    │   System    │
│   Metrics       │    │  Metrics     │    │   Metrics   │
└─────────────────┘    └──────────────┘    └─────────────┘
         │                       │                  │
         ▼                       ▼                  ▼
┌─────────────────────────────────────────────────────────┐
│                  Prometheus                             │
│              (메트릭 수집 및 저장)                           │
└─────────────────────────────────────────────────────────┘
         │
         ▼
┌─────────────────────────────────────────────────────────┐
│                   Grafana                               │
│               (시각화 및 대시보드)                           │
└─────────────────────────────────────────────────────────┘
3. 사전 준비사항
Docker Compose 설치 확인:
# Docker Compose 버전 확인
docker compose version

# 설치되지 않은 경우
sudo apt update
sudo apt install docker-compose-plugin
디렉토리 구조 준비
# 모니터링 프로젝트 디렉토리 생성
mkdir -p ~/monitoring
cd ~/monitoring

# 필요한 하위 디렉토리 생성
mkdir -p prometheus grafana/data
4. Docker Compose 설정
4.1 기본 docker-compose.yml 작성
앞서 생성한 ~/monitoring 프로젝트 루트에 docker-compose.yml 파일을 생성합니다:
services:
  # Prometheus - 메트릭 수집 및 저장
  prometheus:
    image: prom/prometheus:latest
    container_name: prometheus
    restart: unless-stopped
    ports:
      - "9090:9090"                    # 웹 UI 접속 포트 (외부:내부)
    volumes:
      - ./prometheus/prometheus.yml:/etc/prometheus/prometheus.yml  # 설정파일 연결
      - prometheus-data:/prometheus    # 데이터 저장 공간
    command:
      - '--config.file=/etc/prometheus/prometheus.yml'           # 설정 파일 위치
      - '--storage.tsdb.path=/prometheus'                        # 데이터 저장 경로
      - '--web.console.libraries=/etc/prometheus/console_libraries'  # 웹콘솔 라이브러리
      - '--web.console.templates=/etc/prometheus/consoles'       # 웹콘솔 템플릿
      - '--storage.tsdb.retention.time=30d'                      # 데이터 보존기간 (30일)
      - '--web.enable-lifecycle'                                 # 설정 리로드 허용

  # Grafana - 시각화 대시보드
  grafana:
    image: grafana/grafana:latest
    container_name: grafana
    restart: unless-stopped
    ports:
      - "3000:3000"                    # 웹 UI 접속 포트
    environment:
      - GF_SECURITY_ADMIN_USER=admin          # 관리자 계정
      - GF_SECURITY_ADMIN_PASSWORD=admin123!  # 관리자 비밀번호
      - GF_USERS_ALLOW_SIGN_UP=false          # 신규 가입 차단
    volumes:
      - grafana-data:/var/lib/grafana  # 설정 및 데이터 저장

  # Node Exporter - 시스템 메트릭 수집
  node-exporter:
    image: prom/node-exporter:latest
    container_name: node-exporter
    restart: unless-stopped
    ports:
      - "9100:9100"                    # 메트릭 수집 포트
    volumes:
      - /proc:/host/proc:ro            # 프로세스 정보 (읽기전용)
      - /sys:/host/sys:ro              # 시스템 정보 (읽기전용)
      - /:/rootfs:ro                   # 루트 파일시스템 (읽기전용)
    command:
      - '--path.procfs=/host/proc'     # 프로세스 정보 경로
      - '--path.rootfs=/rootfs'        # 루트 파일시스템 경로
      - '--path.sysfs=/host/sys'       # 시스템 정보 경로
      - '--collector.filesystem.mount-points-exclude=^/(sys|proc|dev|host|etc)($|/)'  # 제외할 마운트 포인트

volumes:
  prometheus-data:    # Prometheus 데이터 저장용 Docker 볼륨
  grafana-data:       # Grafana 데이터 저장용 Docker 볼륨
주요 설정 항목
포트 설정:
9090: Prometheus 웹 UI 접속 포트
3000: Grafana 대시보드 접속 포트
9100: Node Exporter 메트릭 수집 포트
볼륨 마운트:
./prometheus/prometheus.yml: 호스트의 설정 파일을 컨테이너로 연결
prometheus-data:/prometheus: 수집된 메트릭 데이터 저장소
/proc:/host/proc:ro: 라즈베리파이의 프로세스 정보를 읽기전용으로 연결
보안 설정:
Grafana 기본 계정: admin/admin123!
신규 사용자 가입 차단
모든 시스템 볼륨을 읽기전용(:ro)으로 마운트
4.2 Prometheus 설정 파일 작성
prometheus/prometheus.yml 파일을 생성합니다:
global:
  scrape_interval: 30s
  evaluation_interval: 30s

# 알림 규칙 파일
rule_files: []

scrape_configs:
  # Prometheus 자체 모니터링
  - job_name: 'prometheus'
    static_configs:
      - targets: ['라즈IP:9090']

  # 시스템 메트릭 수집
  - job_name: 'node'
    static_configs:
      - targets: ['라즈IP:9100']
5. 시스템 모니터링 구성
5.1 모니터링 시스템 시작
# 모니터링 스택 시작
cd ~/monitoring
docker compose up -d

# 컨테이너 상태 확인
docker compose ps

# 로그 확인
docker compose logs -f
5.2 접속 확인
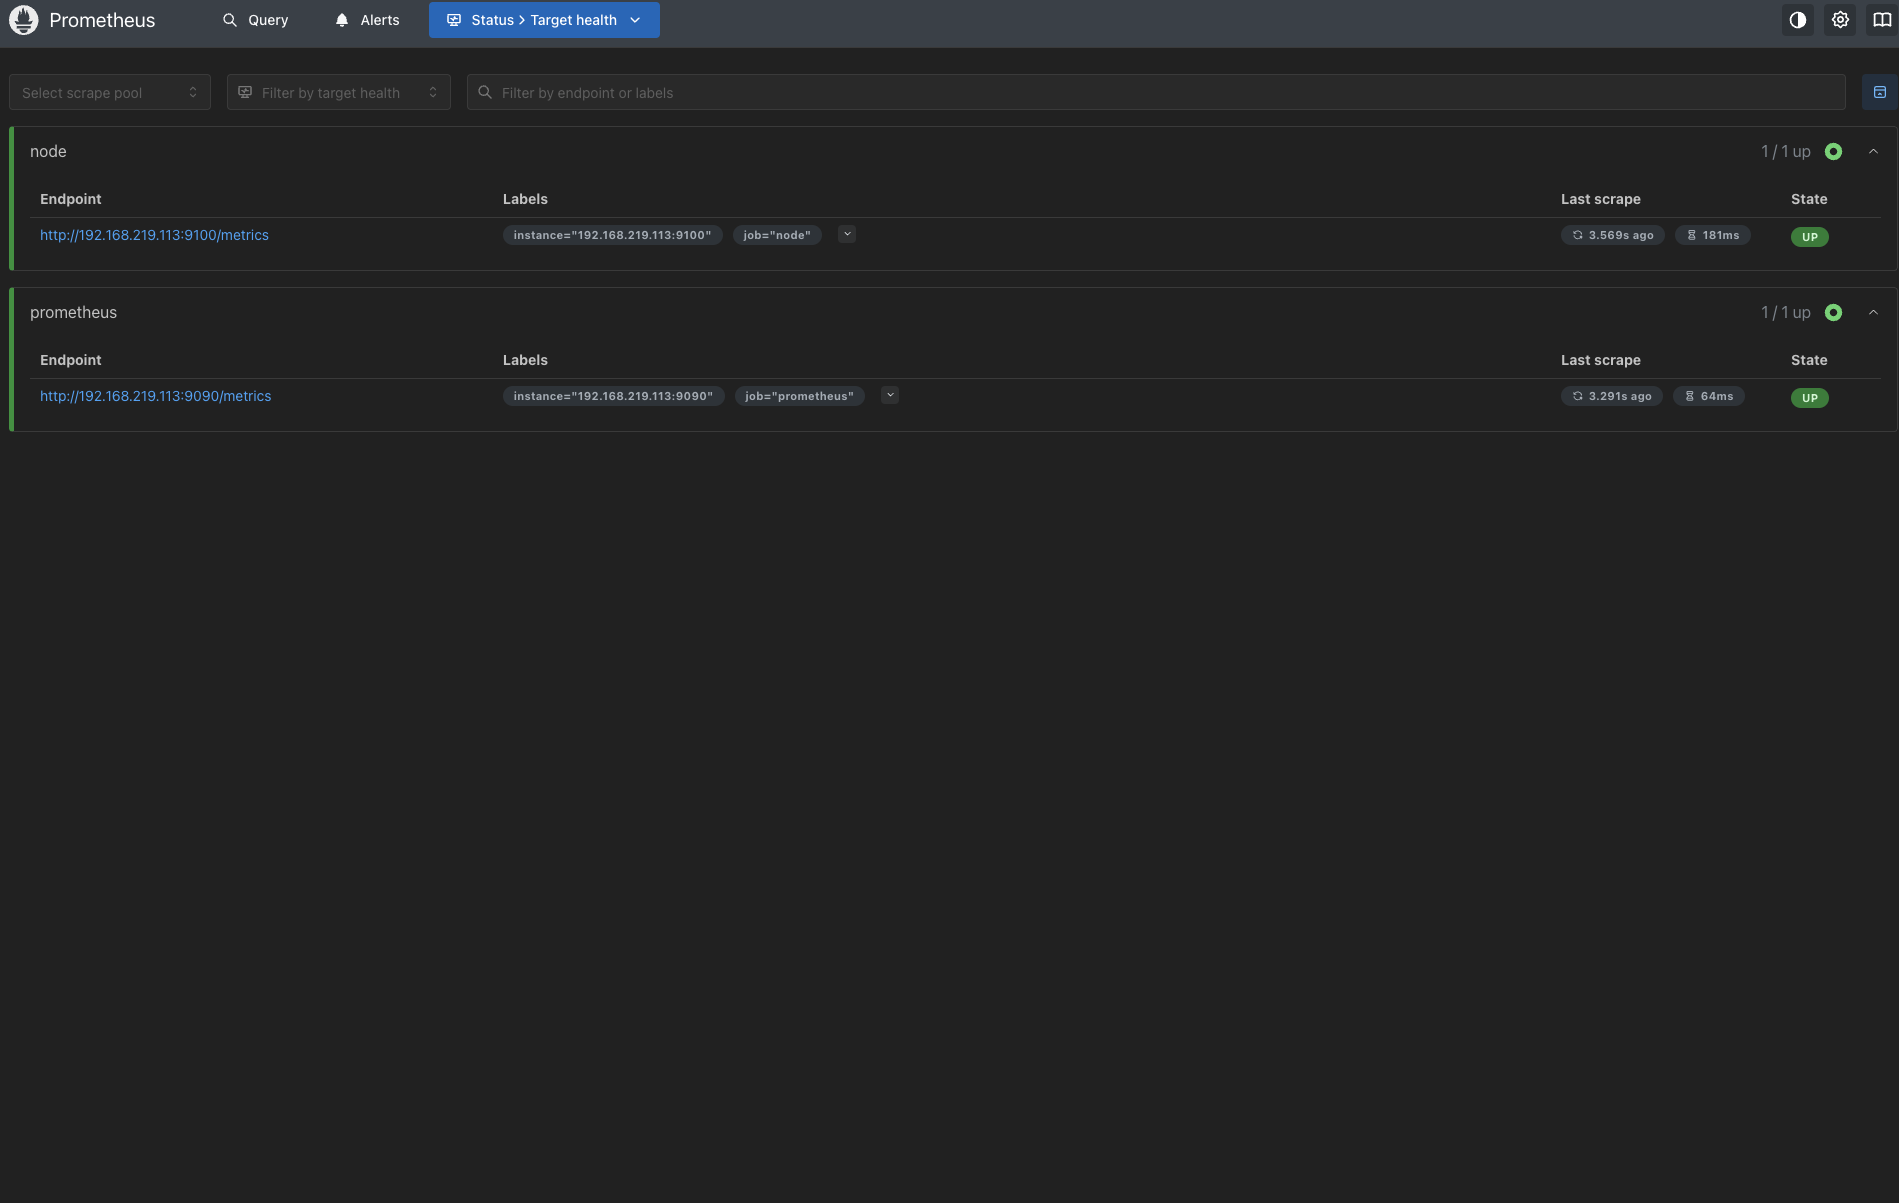
Prometheus 접속:
- URL:
http://라즈베리파이IP:9090 - Status → Targets health에서 수집 상태 확인
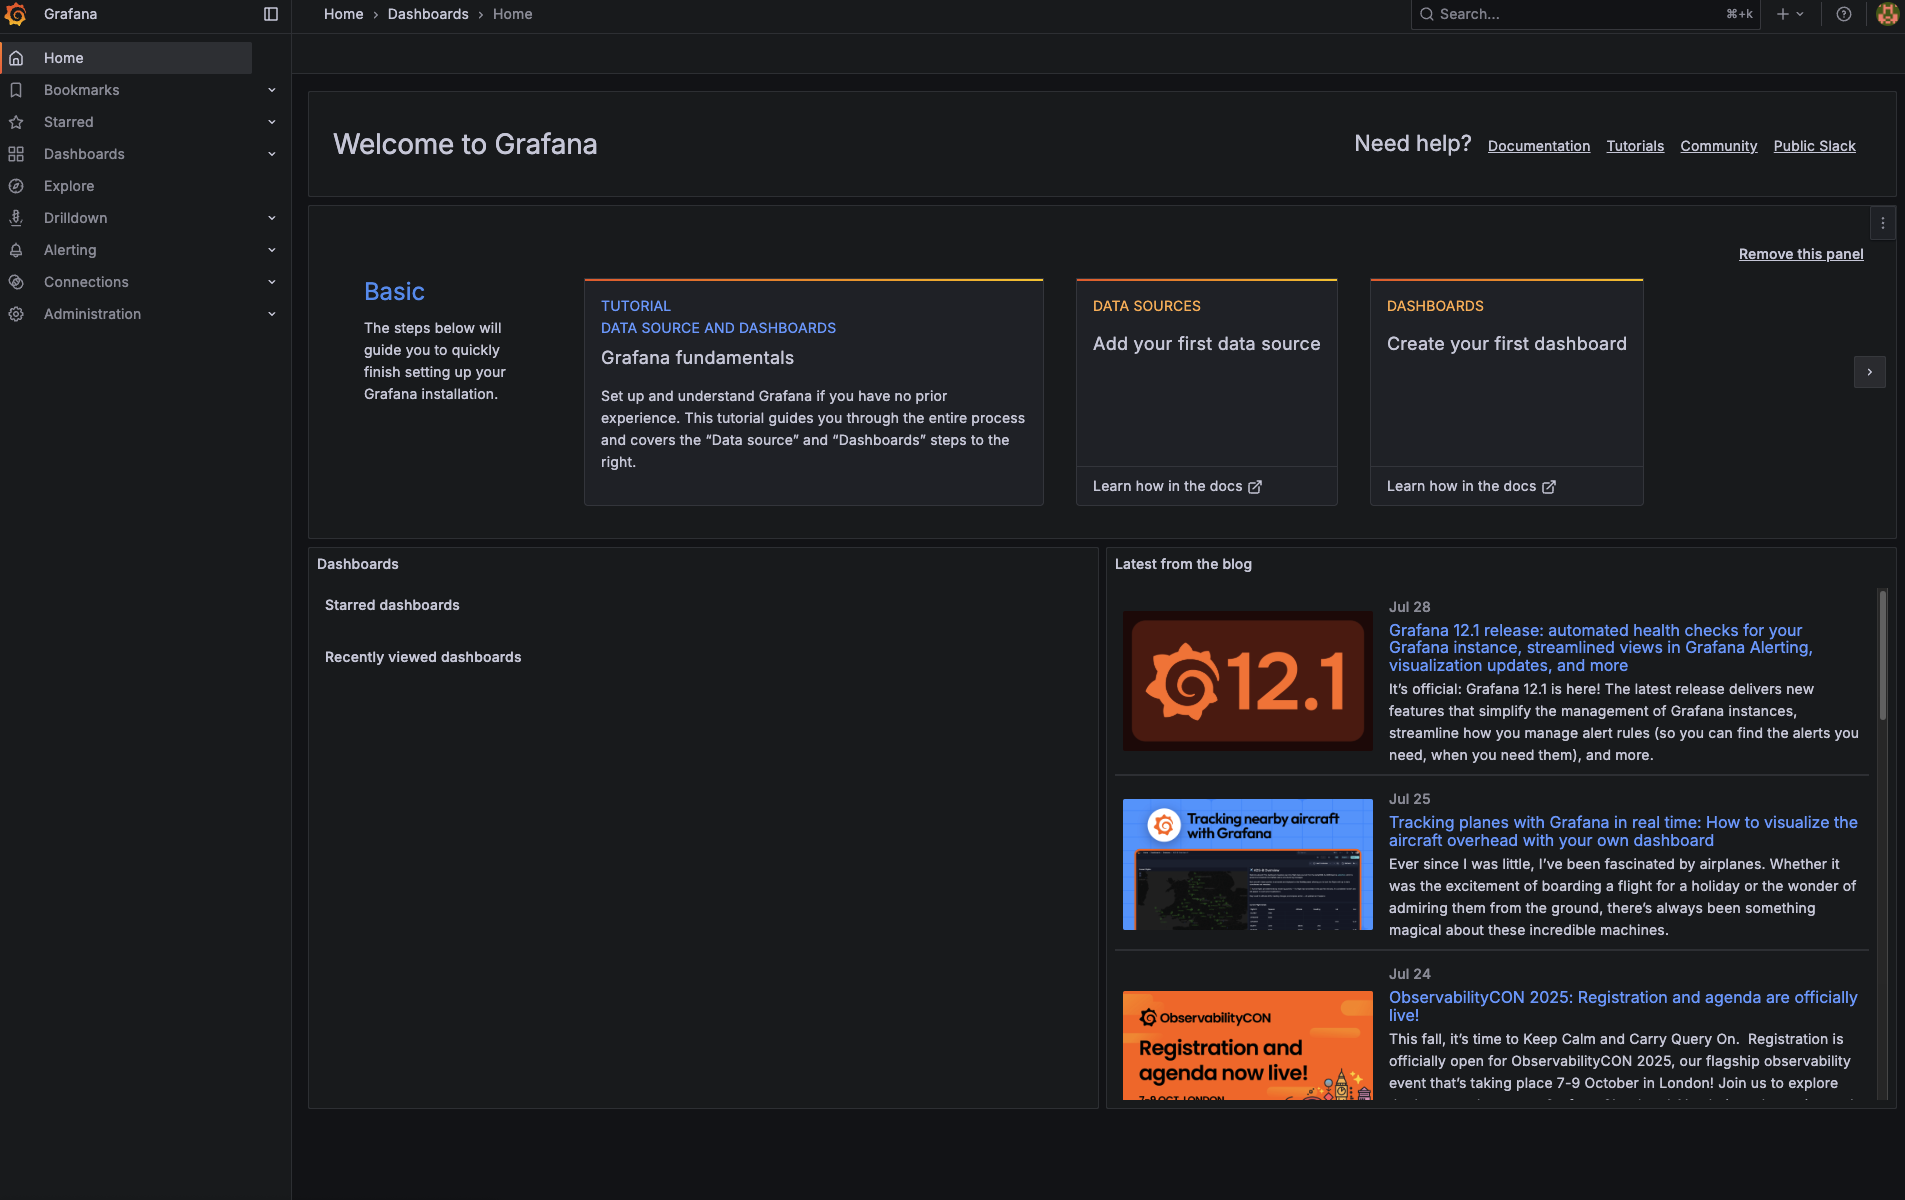
Grafana 접속:
- URL:
http://라즈베리파이IP:3000 - 로그인: admin / admin123!
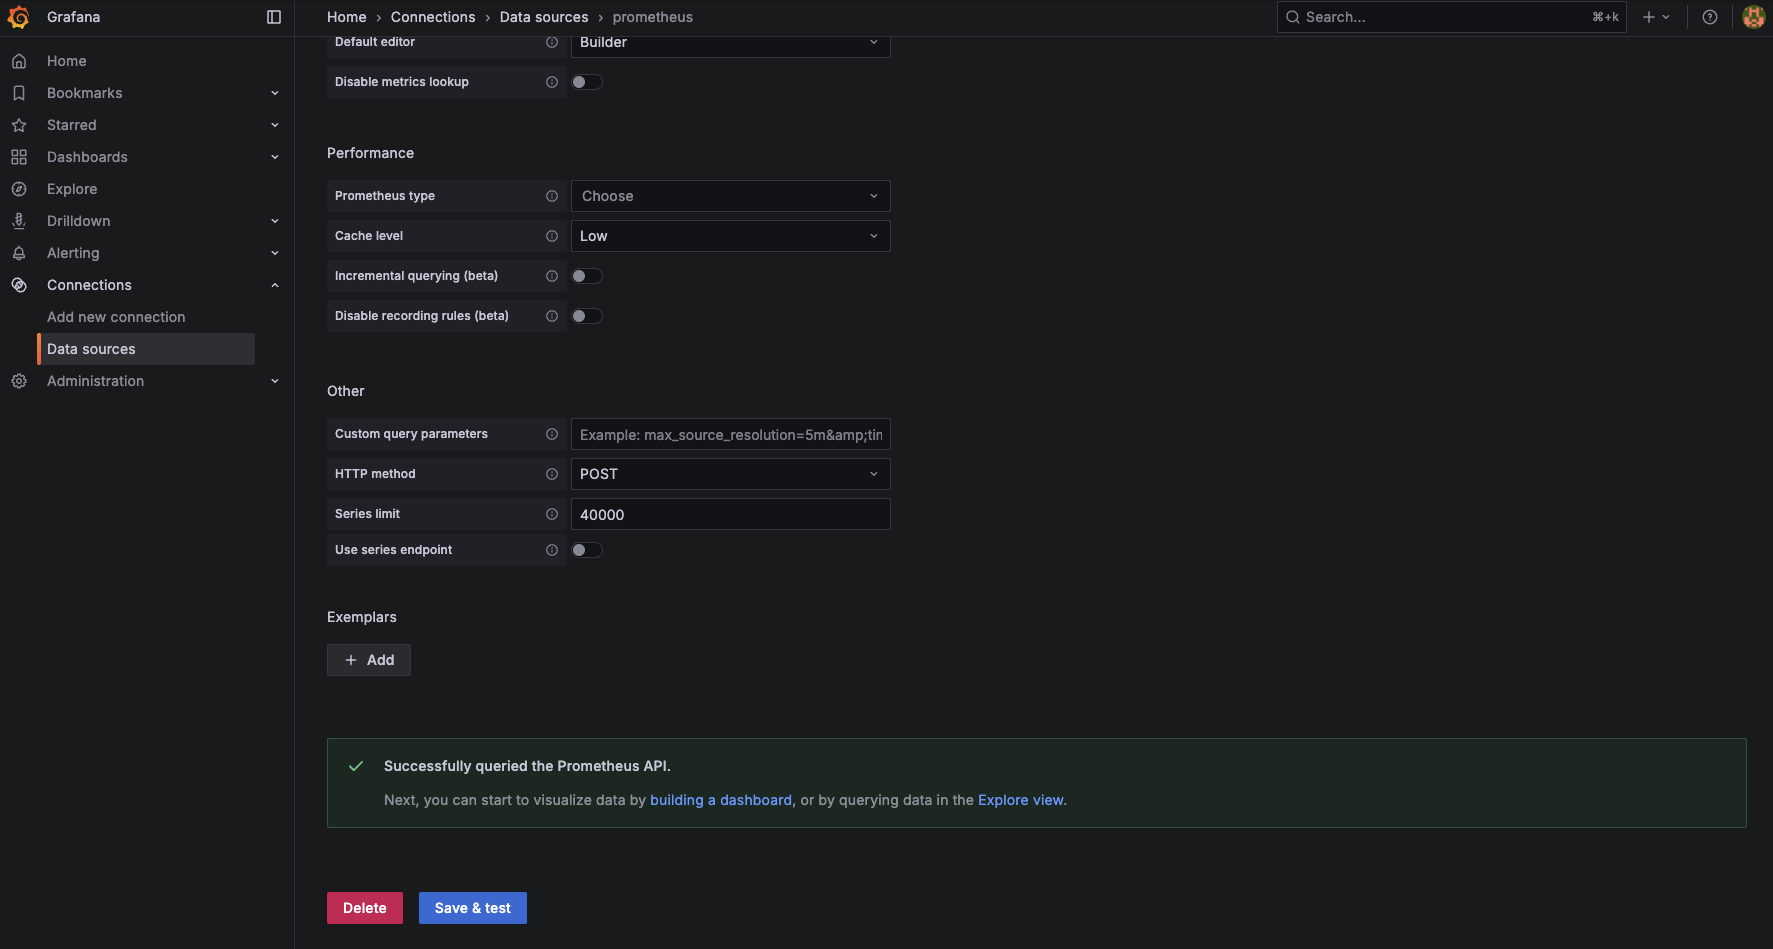
5.3 Grafana 데이터 소스 설정
- Grafana 로그인 후 좌측 메뉴에서 Connections → Data Sources 클릭
- Add data source 버튼 클릭
- Prometheus 선택
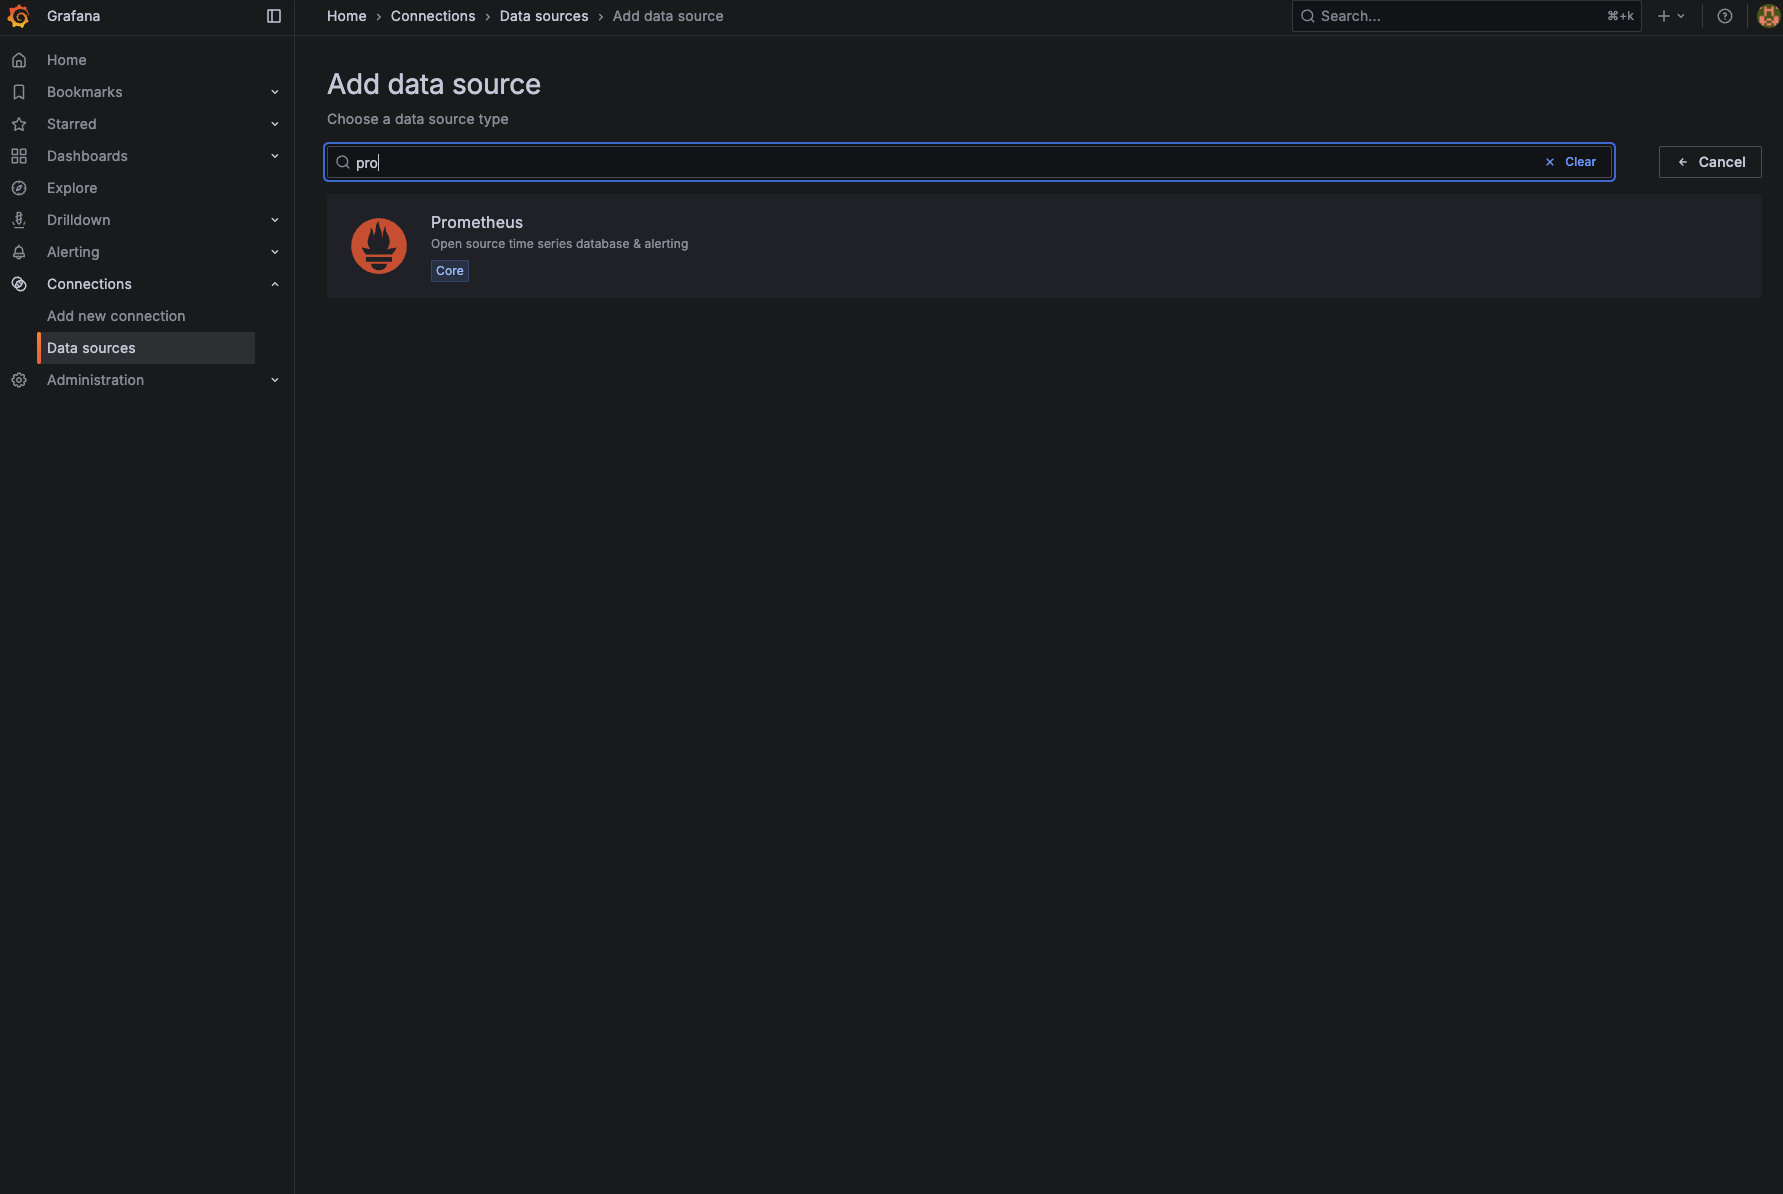
- URL에
http://라즈ip:9090입력 (프로메테우스 실행중인 Url)
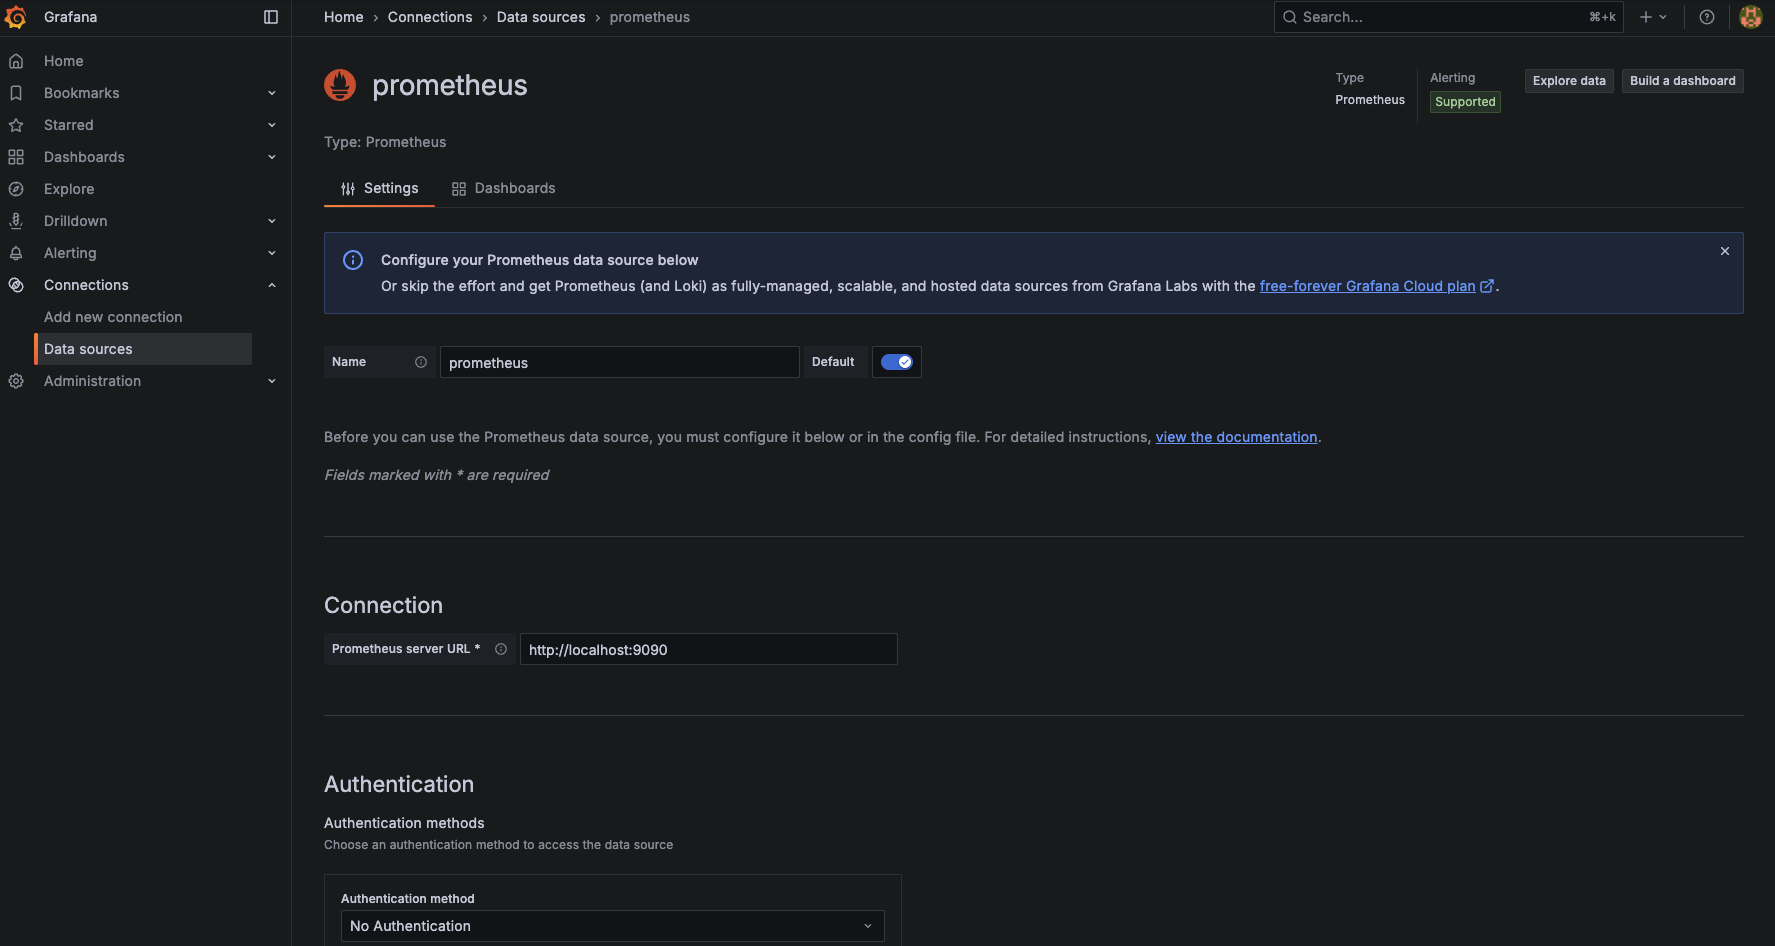
- Save & Test 클릭하여 연결 확인
6. 데이터베이스 모니터링 추가
6.1 Mariadb 모니터링 설정
기존 docker-compose.yml에 모니터링할 데이터 베이스를 추가 설정합니다
저는 mariadb와 redis를 도커를 사용하지 않고 직접 설치하였습니다
따라서 network_mode를 호스트로 사용하였으며 포트 매핑이 필요하지않아 ports 설정을 생략 하였습니다 그리고 mariadb는 DATA_SOURCE_NAME 을 0.15 버전부터 지원하지 않아 cnf 파일을 생성하여 연결하였습니다
  mysql-exporter:
    image: prom/mysqld-exporter:latest
    container_name: mysql-exporter
    restart: unless-stopped
    network_mode: "host"
    volumes:
      - ./my.cnf:/.my.cnf:ro

  # Redis Exporter - Redis 모니터링
  redis-exporter:
    image: oliver006/redis_exporter:latest
    container_name: redis-exporter
    restart: unless-stopped
    network_mode: "host"
    environment:
      REDIS_ADDR: "redis://localhost:6379"
      # Redis에 비밀번호가 있다면: REDIS_PASSWORD: "redis비밀번호"
~/monitoring 디렉토리에 my.cnf 파일을 아래 처럼 생성합니다
[client]
host = localhost
port = 3306
user = root
password = root계정비밀번호
6.2 Prometheus 설정 업데이트
prometheus/prometheus.yml에도 데이터베이스 모니터링을 추가합니다:
scrape_configs:
  # 기존 설정...

  # MariaDB 메트릭 수집
  - job_name: 'mariadb'
    static_configs:
      - targets: ['192.168.219.113:9104']

  # Redis 메트릭 수집
  - job_name: 'redis'
    static_configs:
      - targets: ['192.168.219.113:9121']
6.3 설정 적용
# 컨테이너 재시작
docker compose down
docker compose up -d

# 데이터베이스 동작 확인

# 마리아db
curl http://라즈IP:9104/metrics
# 레디스db
curl http://라즈IP:9121/metrics
7. Grafana 대시보드 설정
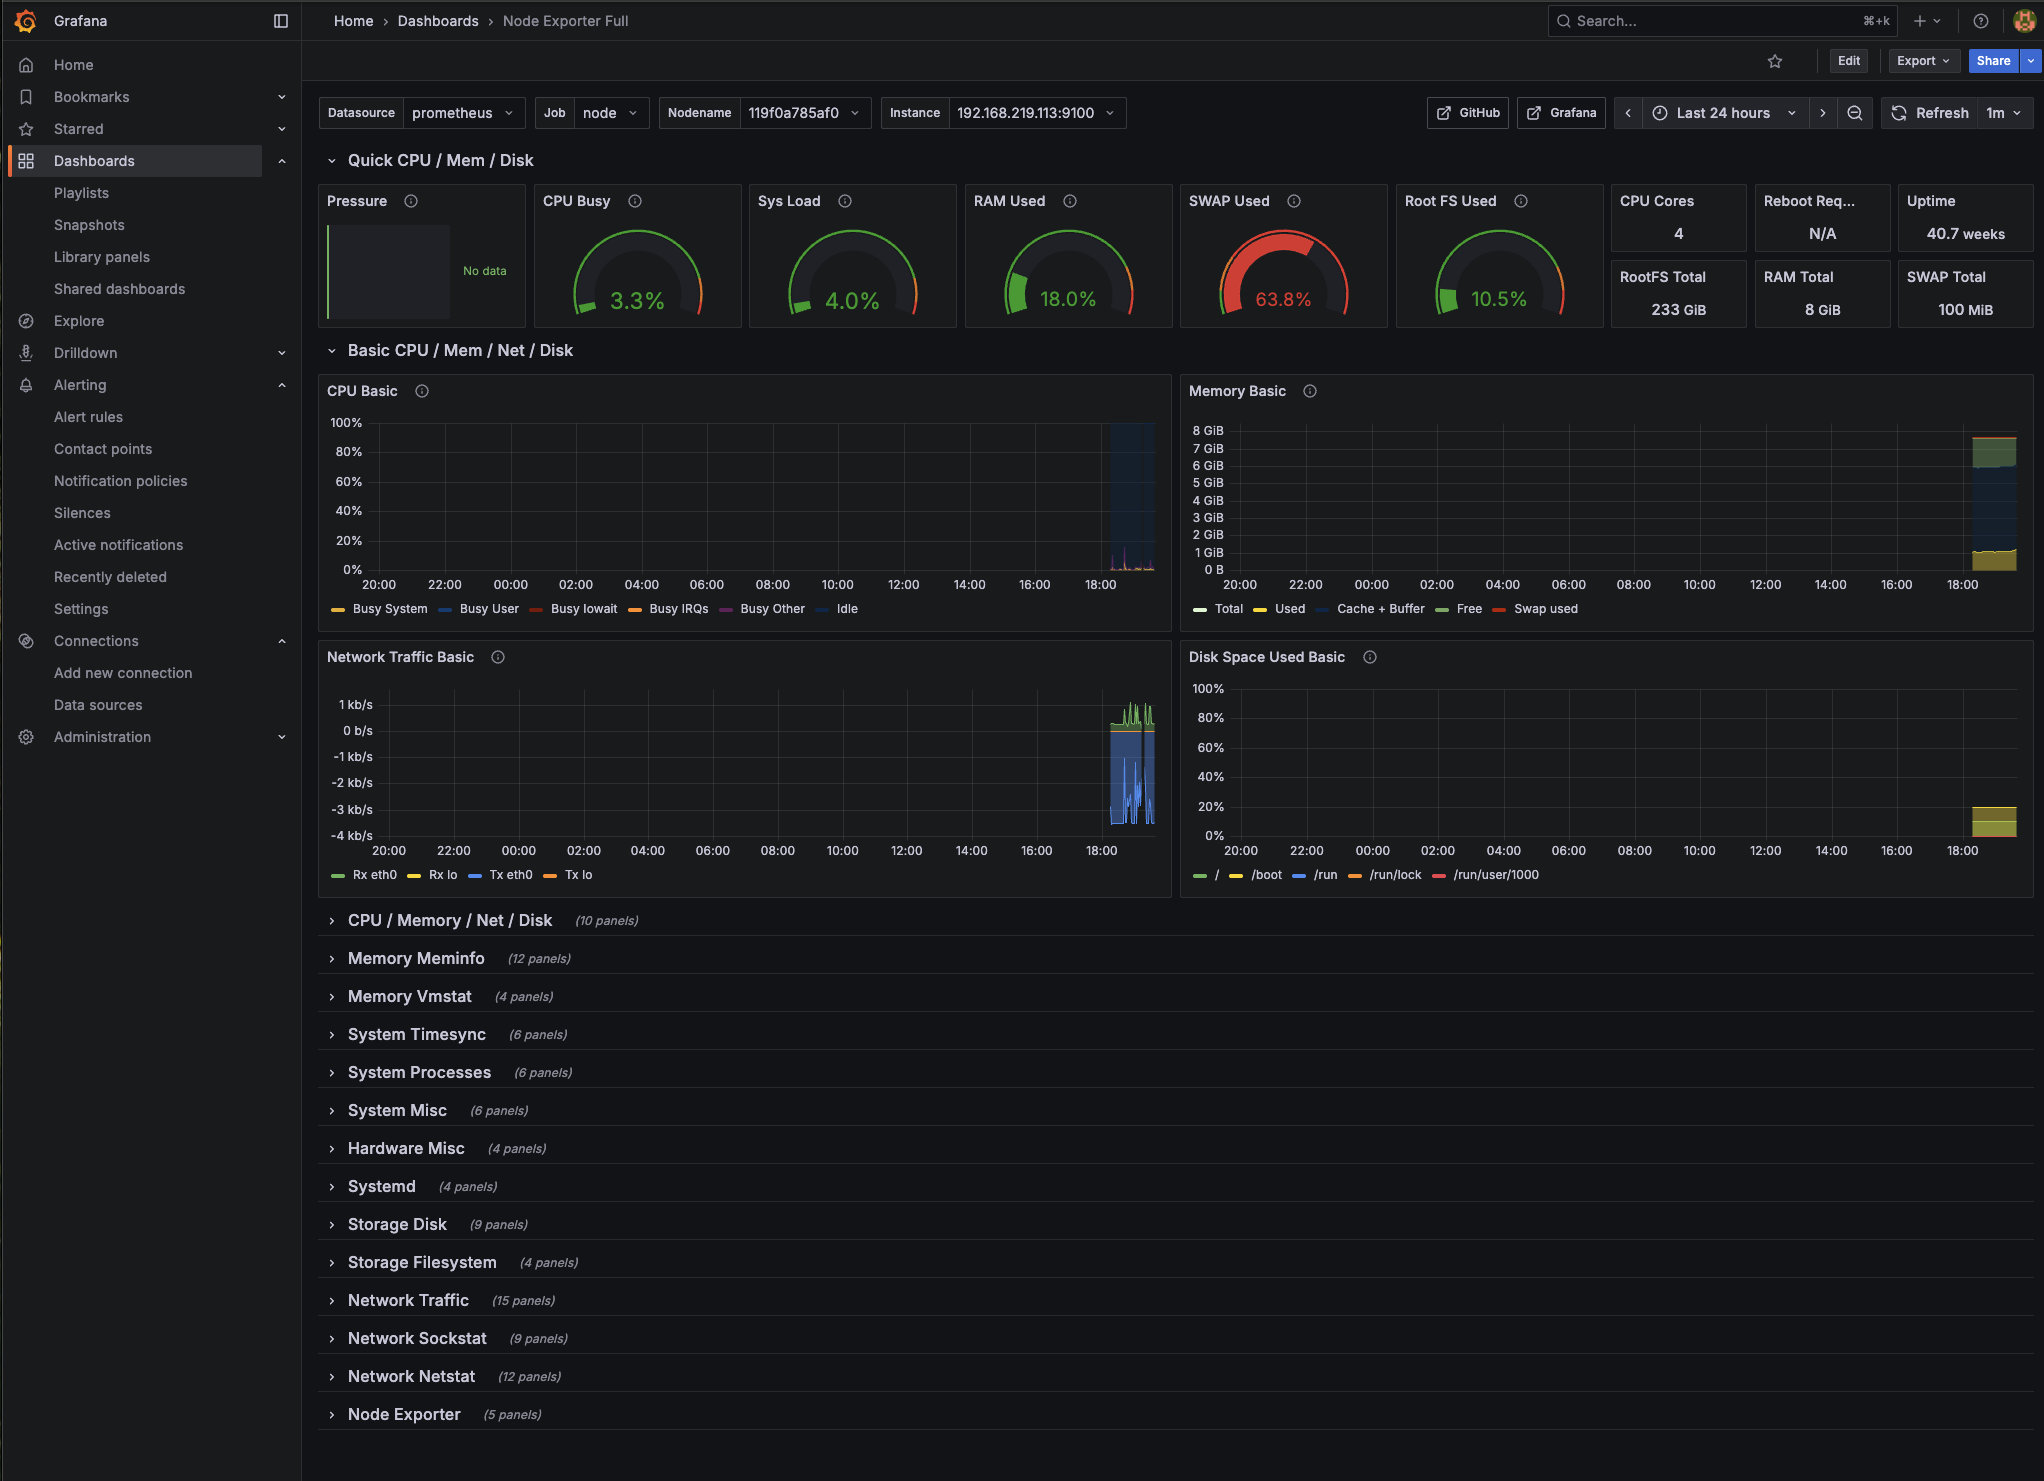
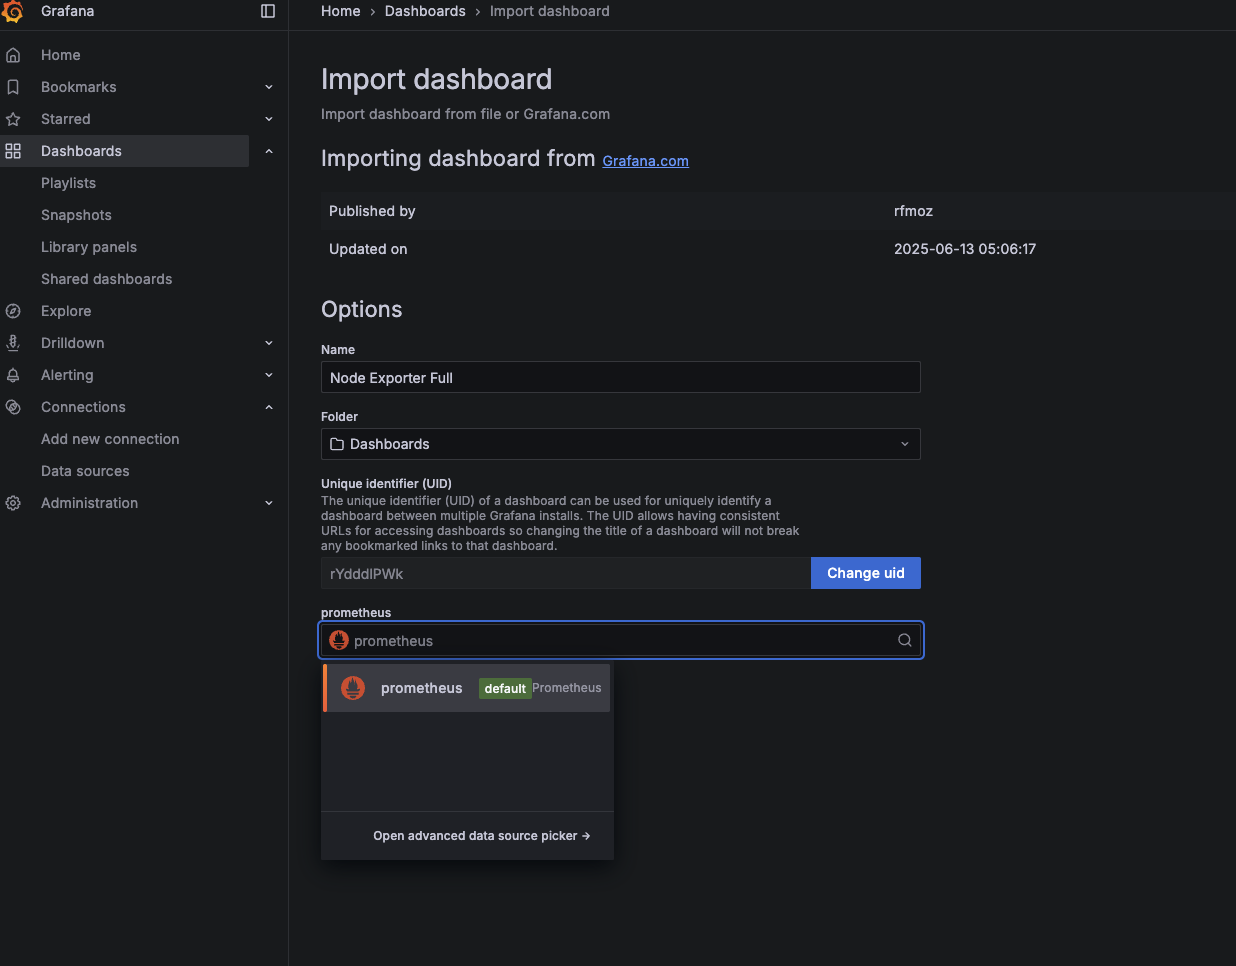
7.1 Node Exporter 대시보드 임포트
-
Grafana에서 상단 + -> Import dashboard 클릭
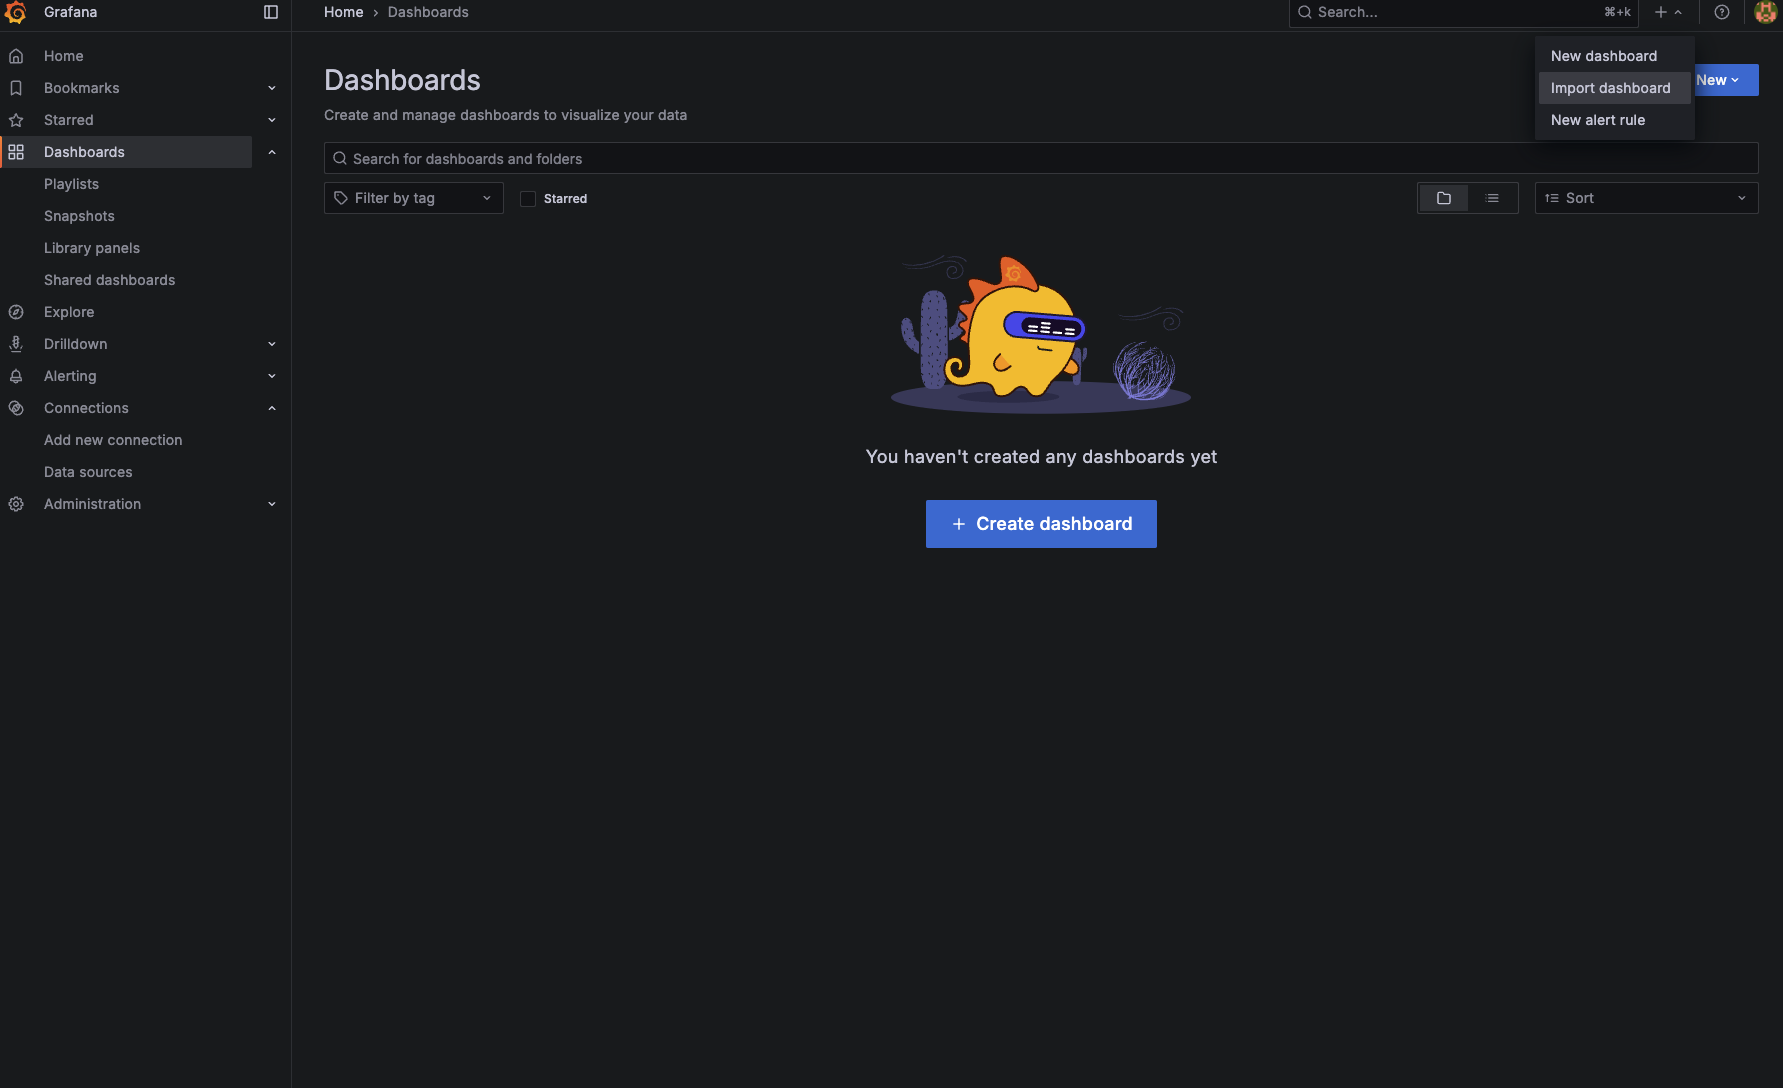
-
Dashboard ID에 1860 입력 (Node Exporter Full)
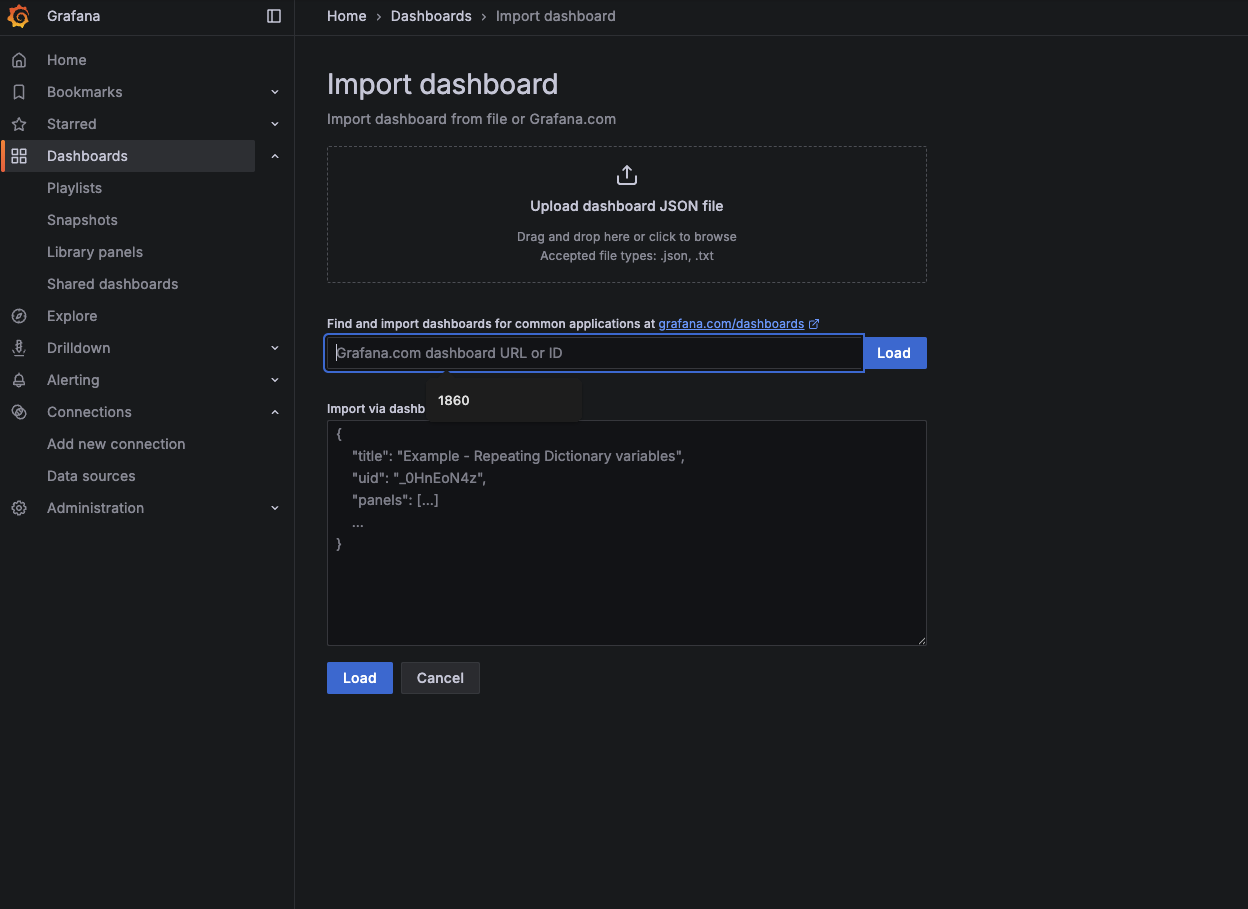
-
Load 클릭
-
Prometheus 데이터 소스 선택 후 Import
7.2 Mysql(Maria) 대시보드 임포트
- 상단 + -> Import dashboard 클릭
- Dashboard ID에 7362 입력 (MySQL Overview)
- Load 클릭
- Prometheus 데이터 소스 선택 후 Import
7.3 Redis 대시보드 임포트
- 상단 + -> Import dashboard 클릭
- Dashboard ID에 763 입력 (Redis Dashboard for Prometheus Redis Exporter)
- Load 클릭
- Prometheus 데이터 소스 선택 후 Import
대시보드 ID들은 Grafana 공식 대시보드 갤러리에서 나온 것입니다
- 1860: Node Exporter Full (가장 인기있는 시스템 모니터링 대시보드)
- 7362: MySQL Overview (공식 MySQL 대시보드)
- 763: Redis Dashboard (표준 Redis 모니터링 대시보드)
8. 알림 설정 구성
Grafana의 알림 시스템은 메트릭이 특정 조건을 충족할 때 자동으로 알림을 보내는 강력한 기능입니다. 이메일, Slack, 웹훅 등 다양한 채널로 알림을 받을 수 있습니다.
8.1 SMTP 서버 설정 (이메일 발송 필수 설정)
grafana:
  image: grafana/grafana:latest
  container_name: grafana
  restart: unless-stopped
  ports:
    - "3000:3000"
  environment:
    - GF_SECURITY_ADMIN_USER=admin
    - GF_SECURITY_ADMIN_PASSWORD=admin123!
    - GF_USERS_ALLOW_SIGN_UP=false
    # SMTP 설정 (Gmail 예시)
    - GF_SMTP_ENABLED=true
    - GF_SMTP_HOST=smtp.gmail.com:587
    - GF_SMTP_USER=your-email@gmail.com
    - GF_SMTP_PASSWORD=your-app-password
    - GF_SMTP_FROM_ADDRESS=your-email@gmail.com
    - GF_SMTP_FROM_NAME=Grafana
  volumes:
    - grafana-data:/var/lib/grafana
SMTP 설정은 이 글에서 다룰 내용이 아니므로 자세한 내용은 생략합니다
중요: SMTP 서버 설정 없이는 이메일 알림이 작동하지 않습니다. 설정 후 반드시 컨테이너를 재시작해야 합니다.
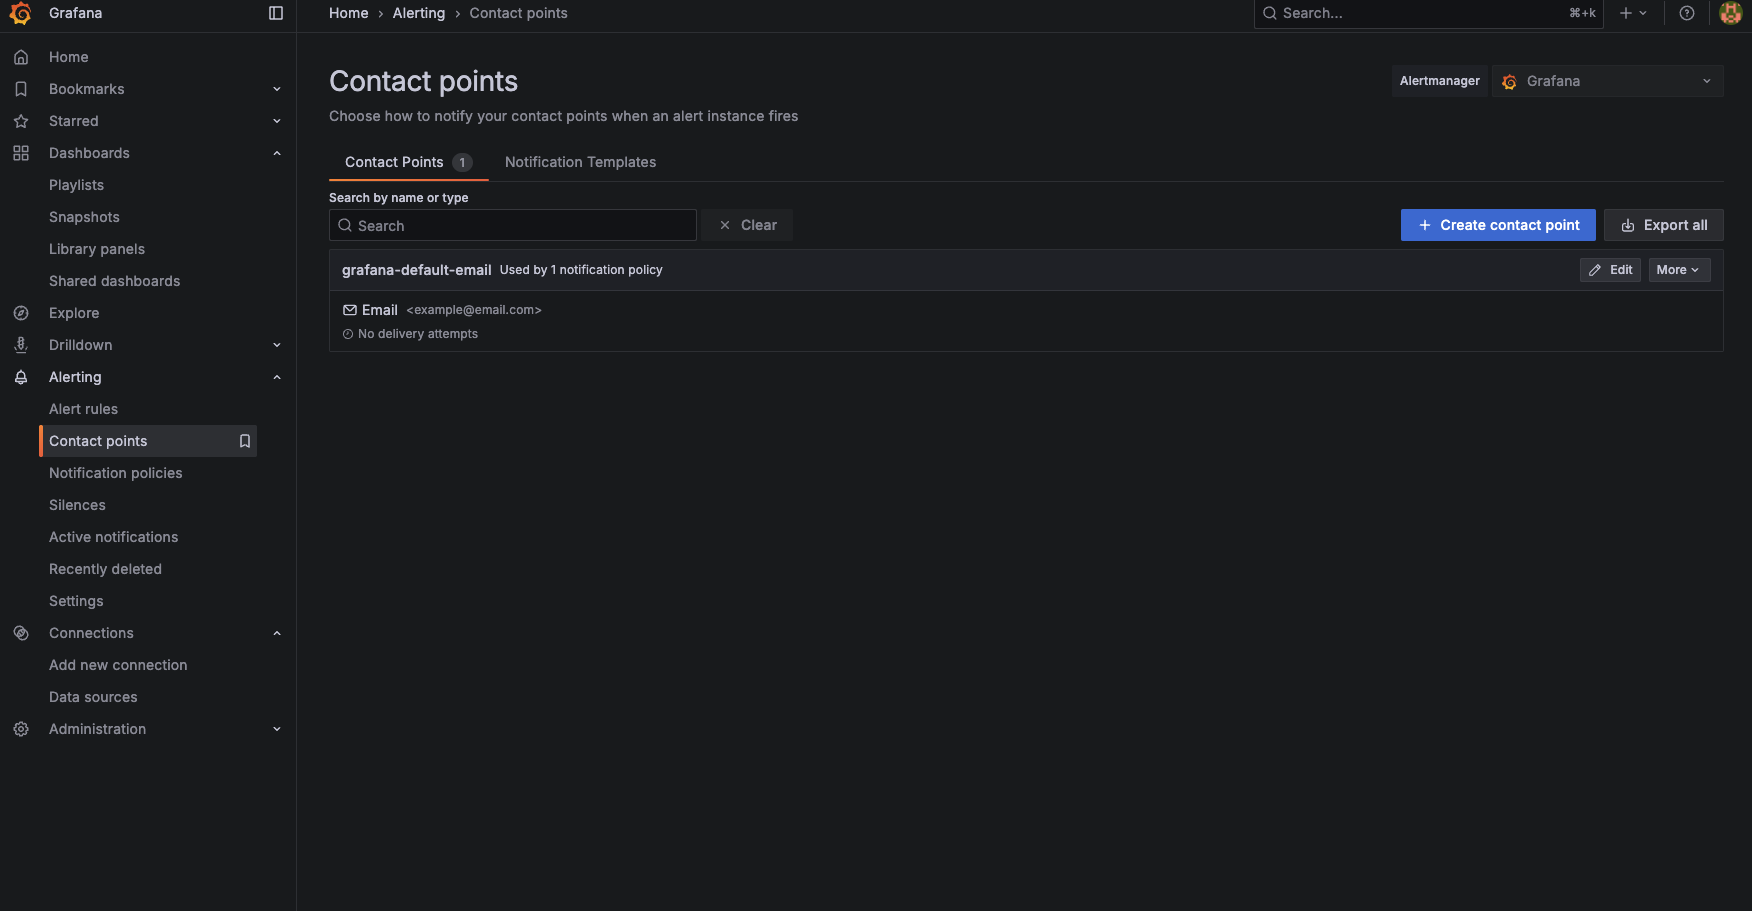
8.2 알림 채널 (Contact Points) 설정
이메일 알림:
1. Alerting → Contact points 접속
2. Create contact point 버튼 클릭 (우측 상단 파란색 버튼)
3. Contact Point 설정:
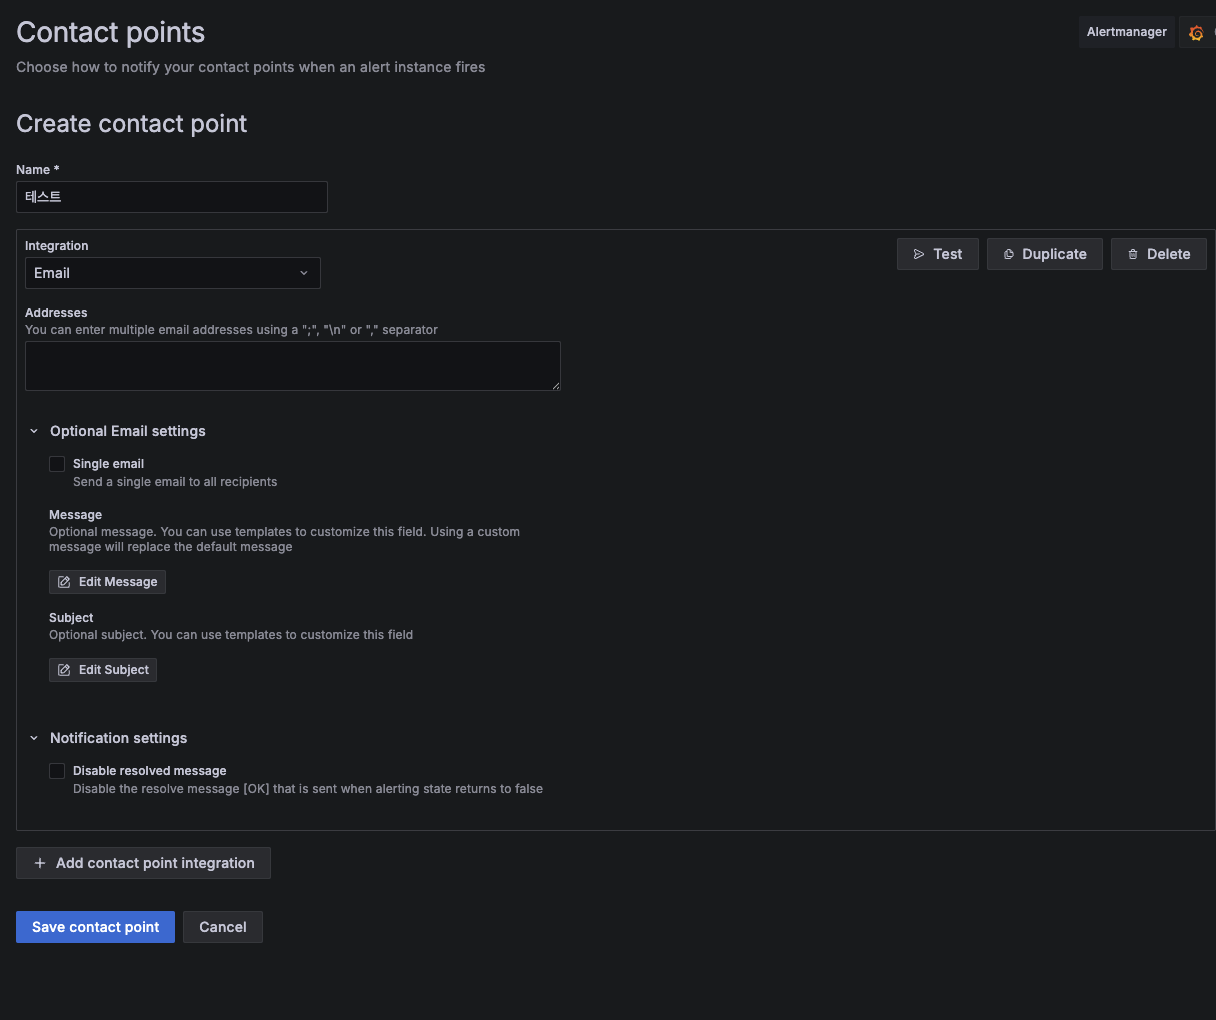
기본 설정:
- Name: 식별 가능한 이름 입력 (예: "라즈베리파이-이메일-알림")
- Integration: Email 선택
- Addresses: 알림을 받을 이메일 주소 입력
- 여러 주소는
;,,또는 줄바꿈으로 구분 가능 - 예:
admin@company.com;alert@company.com
- 여러 주소는
Optional Email settings (선택사항):
- Single email: 체크시 모든 수신자에게 하나의 이메일 발송, 미체크시 개별 발송
- Message: 알림 이메일 본문 커스터마이징 (템플릿 변수 사용 가능)
- Subject: 알림 이메일 제목 커스터마이징
Notification settings:
- Disable resolved message: 체크시 문제 해결 시 알림 미발송, 미체크시 해결 알림도 발송
- + Add contact point integration 클릭하여 같은 Contact Point에 Slack, Webhook 등 추가 가능
- Save contact point 클릭
기존 Contact Point 수정:
- "grafana-default-email"의 Edit 버튼 클릭
<example@email.com>을 실제 이메일 주소로 변경
다중 알림 채널 설정:
하나의 Contact Point에 여러 Integration을 추가할 수 있습니다:
- Email + Slack 동시 알림
- Email + Webhook 동시 알림
- 알림 발생 시 추가된 모든 Integration으로 동시 발송
권장 개인 설정:
- Name: "개인-알림"
- Addresses: 본인 이메일 주소
- Single email: 체크 (개인 사용)
- Disable resolved message: 미체크 (해결 알림도 받기)
8.3 알림 규칙 (Alert Rules) 설정
Contact Point만으로는 알림이 발송되지 않습니다. 언제 알림을 보낼지 정의하는 Alert Rule이 필요합니다.
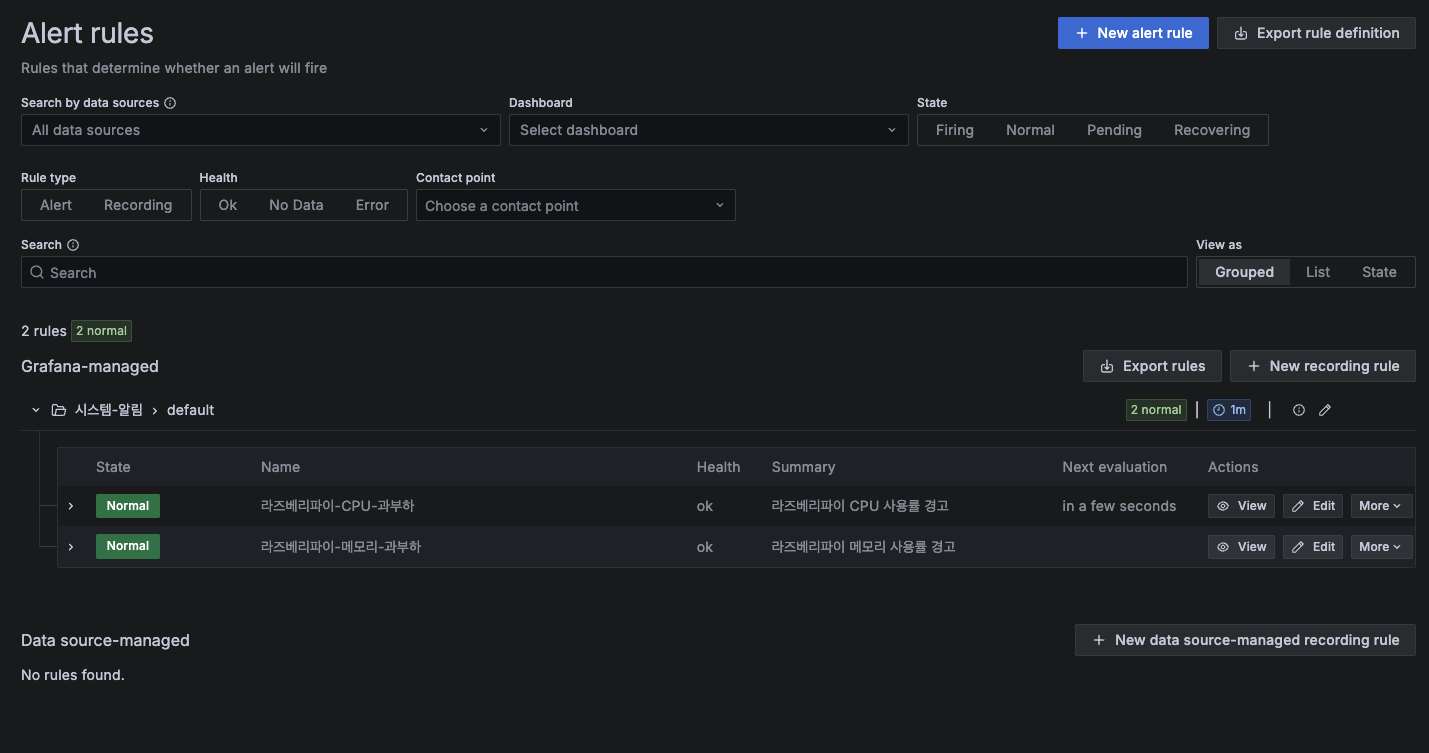
Alert Rule 생성 과정
- Alerting → Alert rules 접속
- New alert rule 버튼 클릭
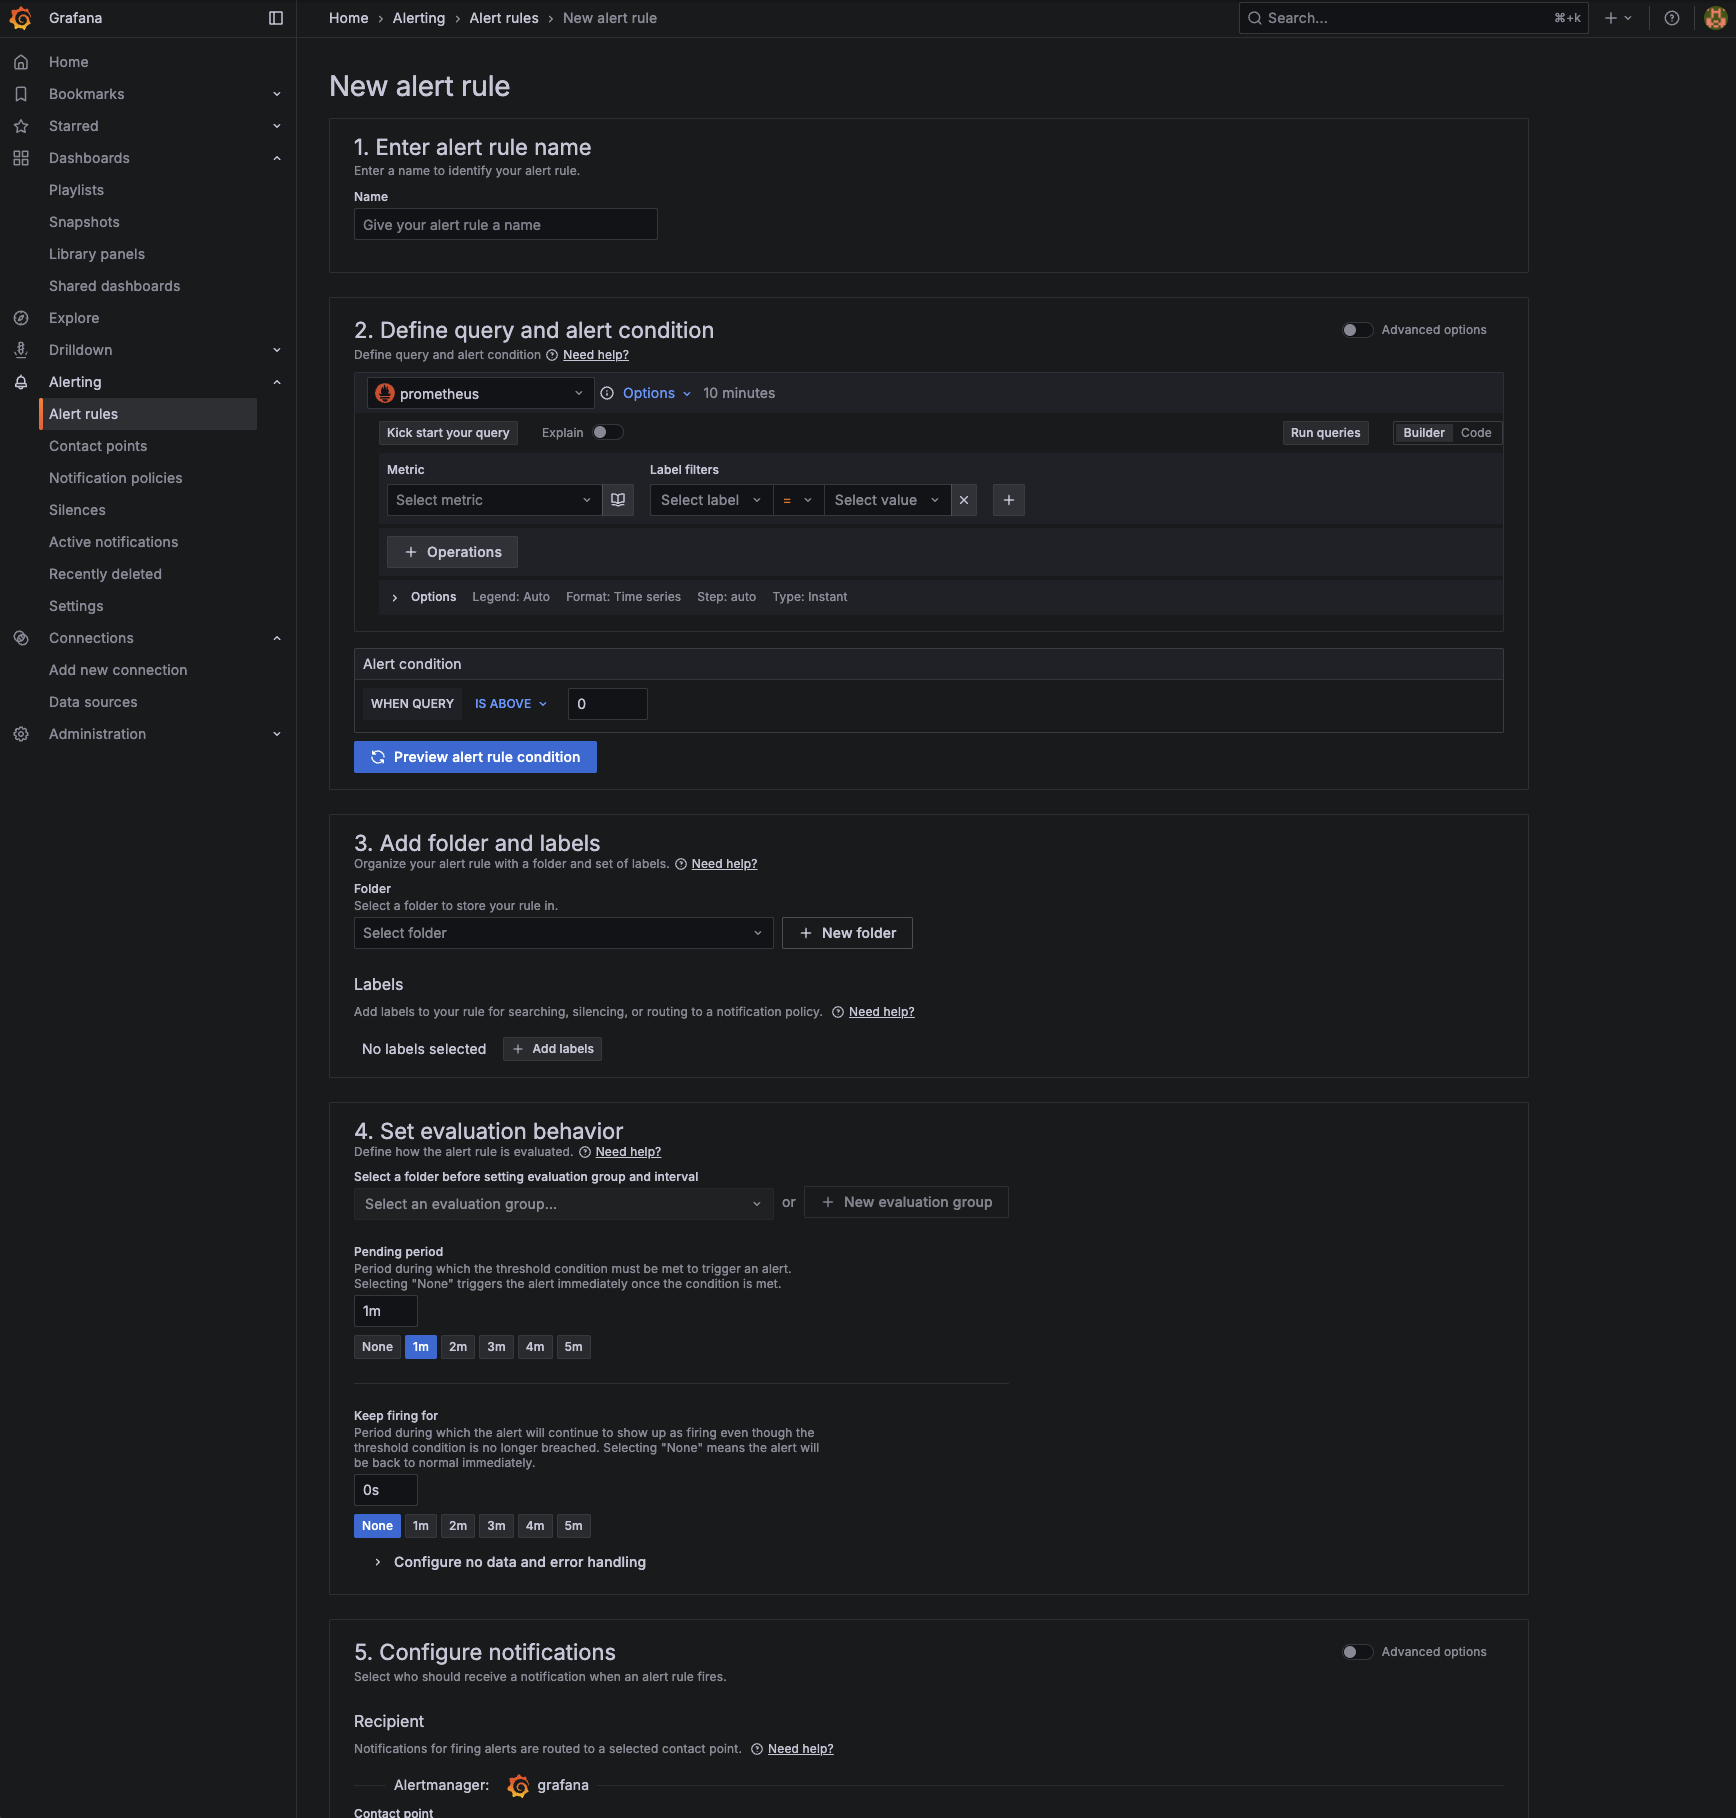
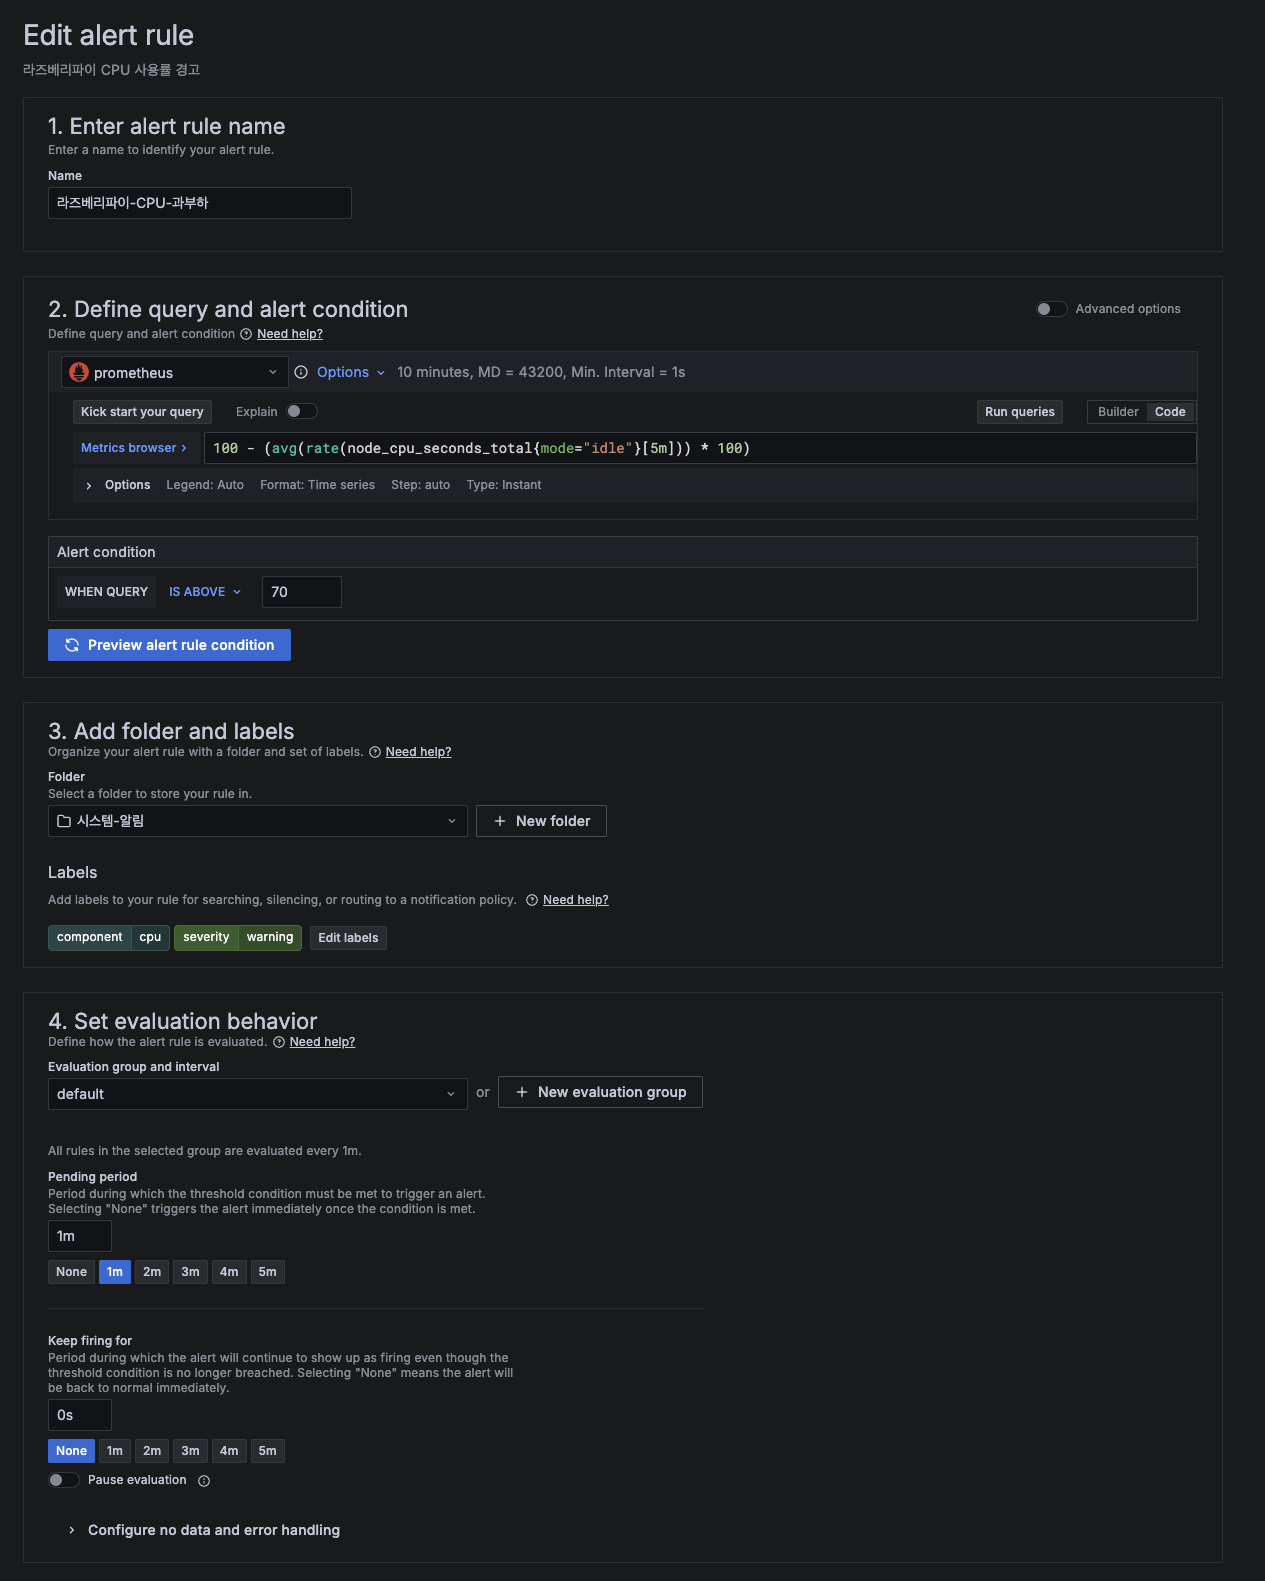
1. Enter alert rule name
- Name: 알림 규칙을 식별할 수 있는 이름 입력
- 예시:
라즈베리파이-CPU-과부하,메모리-사용률-경고
2. Define query and alert condition
쿼리 설정 방법:
- Metric: 모니터링할 메트릭 선택
- Label filters: 필터 조건 추가 (예: mode=idle)
- Operations: rate, avg 등 계산 함수 추가
- Options: 시간 범위, 데이터 타입 설정
Alert condition 설정:
- WHEN QUERY: 쿼리 결과를 기준으로 조건 설정
- IS ABOVE: 임계값 초과 시 알림 발생
- 임계값: 알림이 발생할 기준값 입력
3. Add folder and labels
Folder 설정:
- Select folder: 기존 폴더 선택
- New folder: 새 폴더 생성 (예: "시스템-알림")
Labels 설정 (선택사항):
- 알림 규칙을 분류하고 관리하기 위한 라벨
- 예:
severity=warning,component=cpu
4. Set evaluation behavior
평가 그룹 설정:
- Select an evaluation group: 기존 그룹 선택 또는 새 그룹 생성
- 같은 그룹의 규칙들은 함께 평가됩니다
Pending period (대기 시간):
- 1m, 2m, 3m, 4m, 5m: 조건이 지속되어야 하는 시간
- 예:
1m선택 시 1분간 조건 지속 시 알림 발생
Keep firing for (지속 시간):
- 조건이 해결된 후에도 얼마나 알림을 유지할지 설정
- None: 조건 해결 즉시 알림 중단
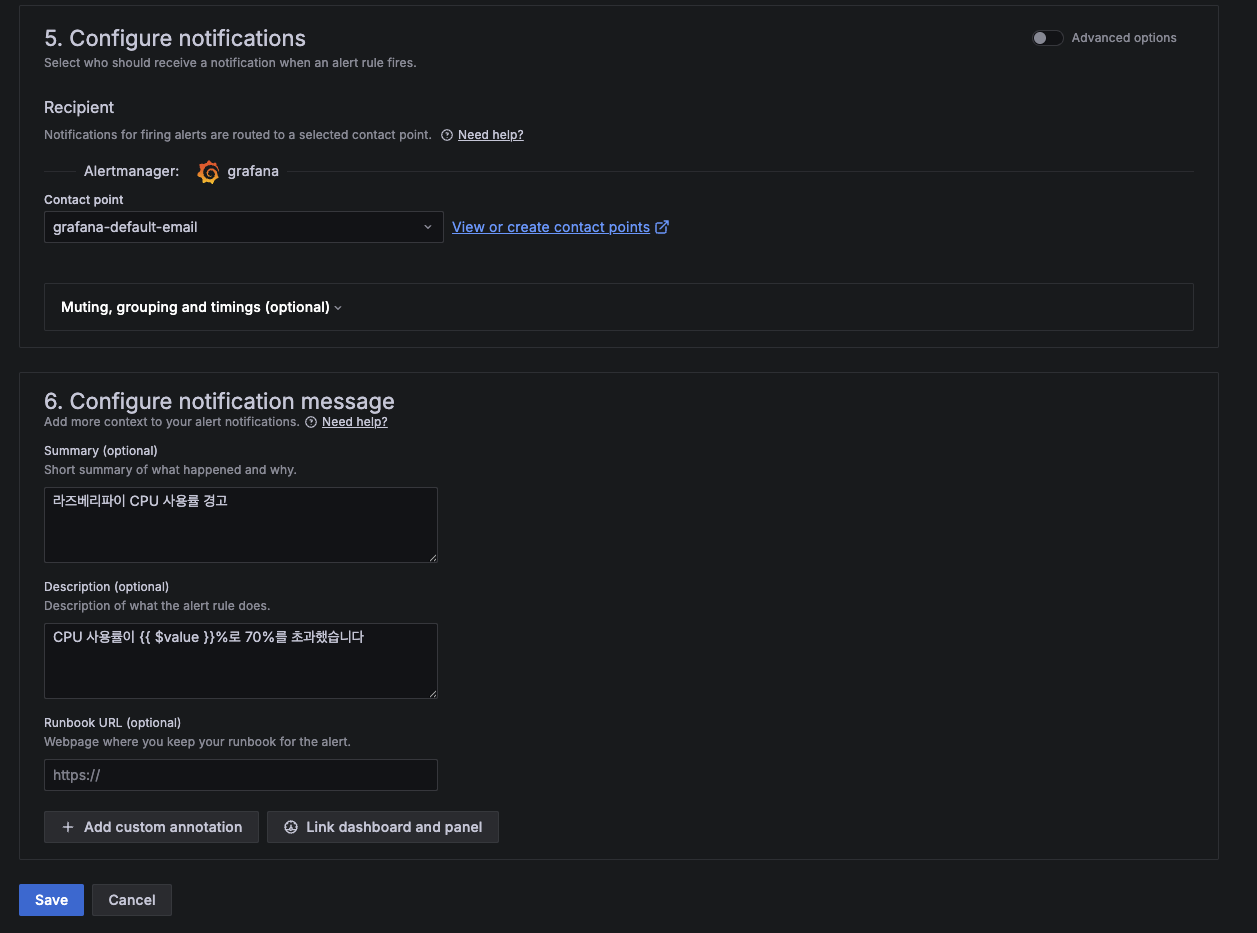
5. Configure notifications
Contact point 연결:
- 앞서 생성한 이메일 Contact Point 선택
- 드롭다운에서 Contact Point가 표시되지 않으면 "View or create contact points" 클릭
6. Configure notification message
Summary (요약):
- 알림 메시지의 간단한 요약
- 예:
라즈베리파이 CPU 사용률이 높습니다
Description (설명):
- 상세한 알림 내용
- 예:
CPU 사용률이 {{ $value }}%로 임계값 70%를 초과했습니다
Runbook URL (선택사항):
- 문제 해결 가이드나 문서 링크
실제 알림 규칙 설정 예시
CPU 사용률 70% 초과 알림
1. Alert rule name
라즈베리파이-CPU-과부하2. Query and condition
100 - (avg(rate(node_cpu_seconds_total{mode="idle"}[5m])) * 100)- Alert condition: IS ABOVE 70
3. Folder and labels
- Folder: 시스템-알림 (새 폴더 생성)
- Labels:
severity=warning,component=cpu
4. Evaluation behavior
- Evaluation group: default (새 그룹 생성)
- Pending period: 1m (1분간 지속 시 알림)
- Keep firing for: None
5. Notification message
- Summary:
라즈베리파이 CPU 사용률 경고 - Description:
CPU 사용률이 {{ $value }}%로 70%를 초과했습니다
메모리 사용률 70% 초과 알림
1. Alert rule name
라즈베리파이-메모리-과부하2. Query and condition
(1 - (node_memory_MemAvailable_bytes / node_memory_MemTotal_bytes)) * 100- Alert condition: IS ABOVE 70
3. Folder and labels
- Folder: 시스템-알림
- Labels:
severity=warning,component=memory
4. Evaluation behavior
- Evaluation group: default
- Pending period: 1m (1분간 지속 시 알림)
- Keep firing for: None
5. Notification message
- Summary:
라즈베리파이 메모리 사용률 경고 - Description:
메모리 사용률이 {{ $value }}%로 70%를 초과했습니다
이제 CPU 사용률이 70% 또는 메모리 사용률이 70%를 초과하면 자동으로 이메일 알림을 받을 수 있습니다
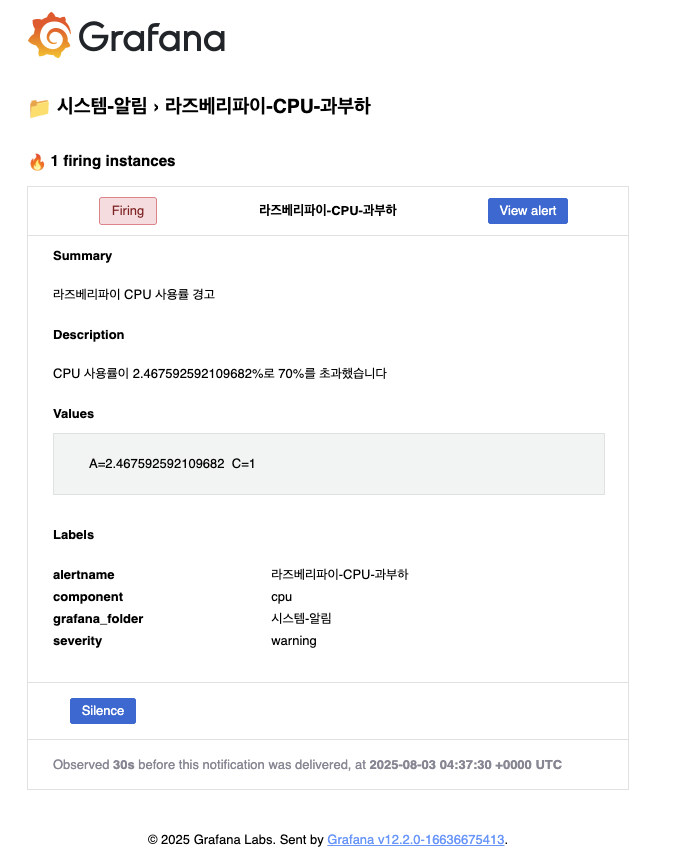
테스트
실제 메일이 오는지 궁금해서 IS ABOVE 2 로 변경하고 테스트를 하였습니다
1분이 지나자 상태가 Firing으로 변경되고
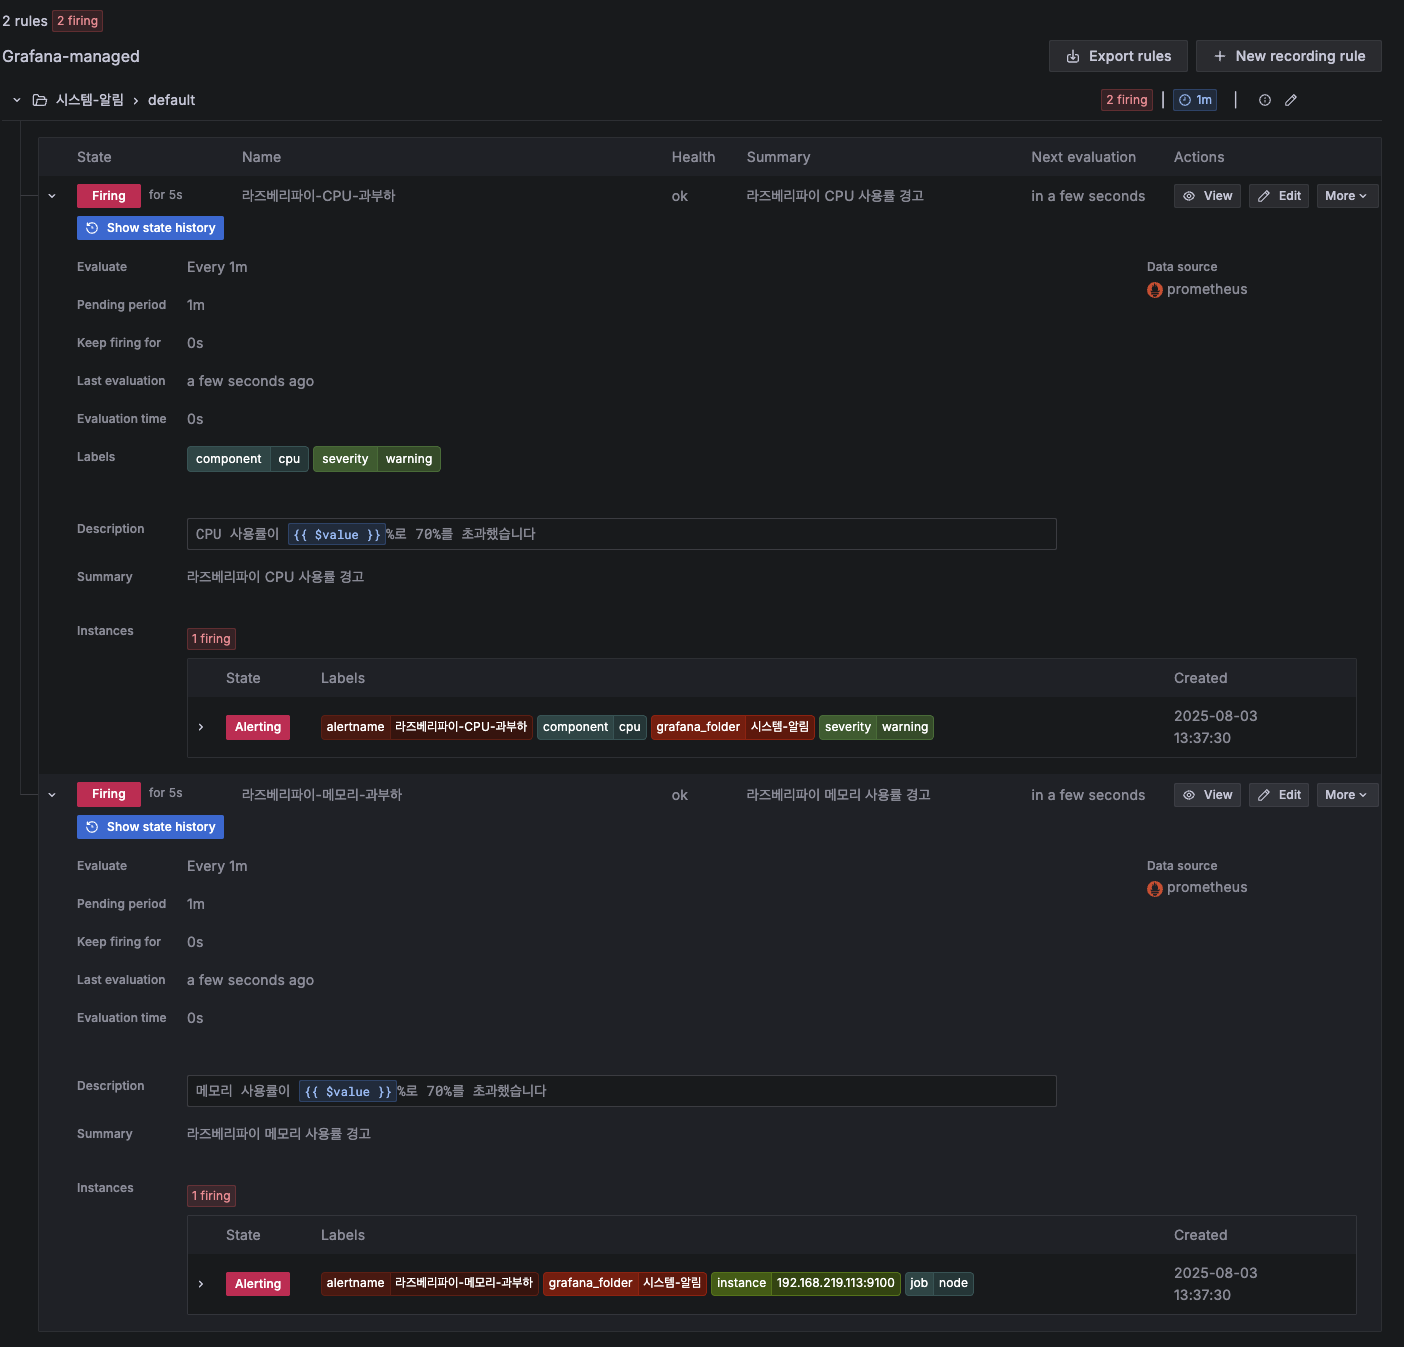
메일도 잘 전송된것을 확인하였습니다
9. 마무리
라즈베리파이 4에 Docker Compose를 활용하여 Prometheus + Grafana 모니터링 시스템을 성공적으로 구축했습니다. 이 시스템을 통해 다음과 같은 이점을 얻을 수 있었습니다
주요 성과:
- 실시간 시스템 리소스 모니터링 구축
- 데이터베이스 성능 모니터링 추가
- 사용자 정의 알림 시스템 구성
- 확장 가능한 모니터링 아키텍처 완성