
Overview
This Project involved cleaning and preprocessing the raw dataset in Excel as well as EDA and visualization in Tableau. The dataset contained customer orders, region details, and marketing information. In cleaning process, the goal was to identify and address data quality issues, improve consistency, and document any limitations.
Analysis process involves sales metrics, marketing channel metrics and regional metrics.
Index
- Data Cleaning
- EDA
- Dashboard
- Recommendation
1. Data Cleaning
Cleaning Objectives
- Fix formatting issues
- Handle missing or inconsistent data
- Standardize text and numerical values
- Ensure proper data types for analysis
Dataset
- Orders Table: ~20,000 rows of customer orders and transation details
- Region Table: Country and region codes
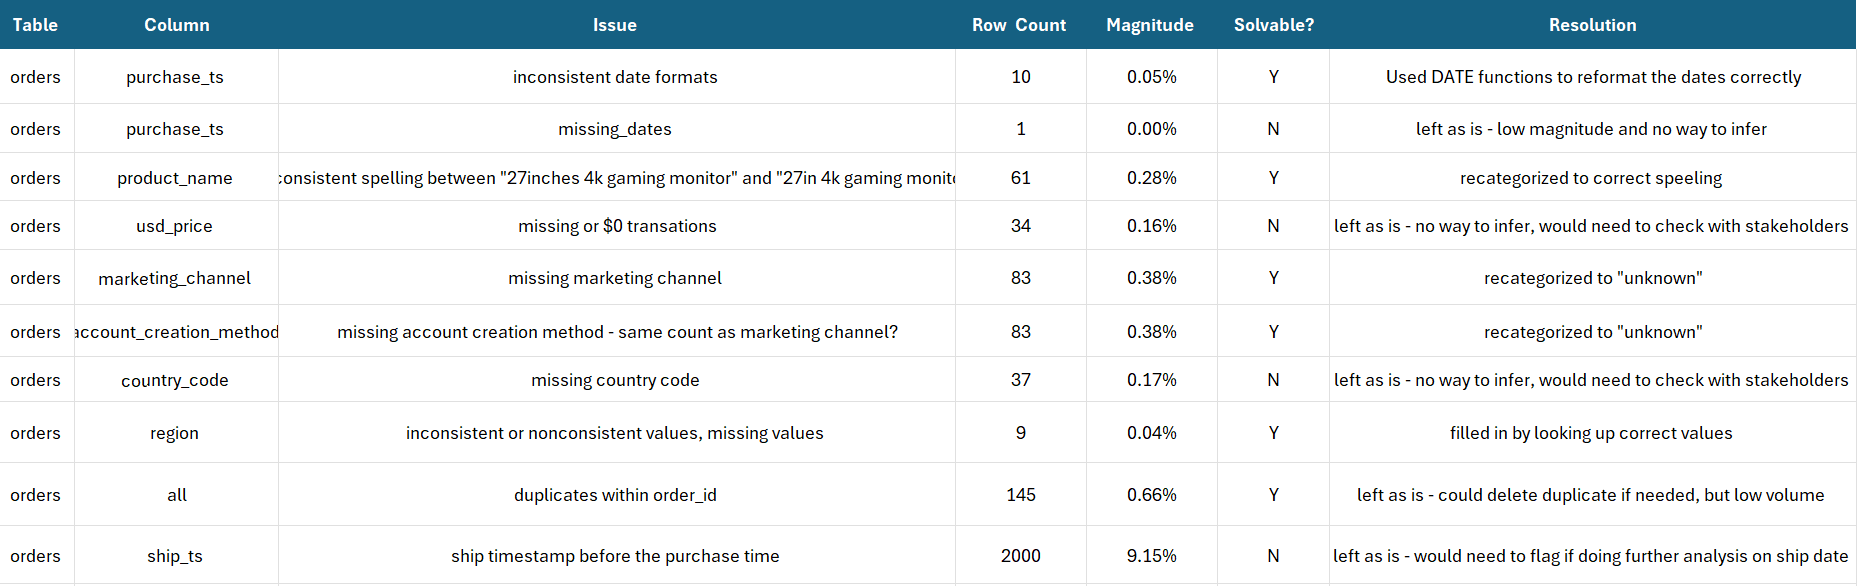
Issue Log and Resolutions
Files
- Orders, Regions - Original Dataset(anonymized)
- Orders_Cleaned, Regions_Cleaned - Cleaned version with corrections
- Issue Log - Tabular format of th issues above
- All can be found in the excel workbook here!
Notes
- Certain unsolved issues were left for business teams to validate due to external dependencies.
- The cleanes dataset can now be confidently used for further analysis or dashboard reporting
Contact
For any questions or suggestions, feel free to open an issue or contact me. khc13258@gmail.com
2. EDA
Analysis Objectives
- How did total revenue dollars across all products perform during 2019-2022? Conduct some intial analysis to help product, marketing, and finance nanagers understand high-level trends.
- Look at total usd_price across months, products, and averages. Identify minimums, and ant outliers
- Can also slice by region and other demographics like marketing channel, or account creation method
KPI
- Total Sales
- Total Orders
- AOV
Data overview in Excel
1. USD_Price/Month
- Total sales across 2019-2022 is -6.1<, ranging in monthly sales from $80K to $500K (Finance Team)
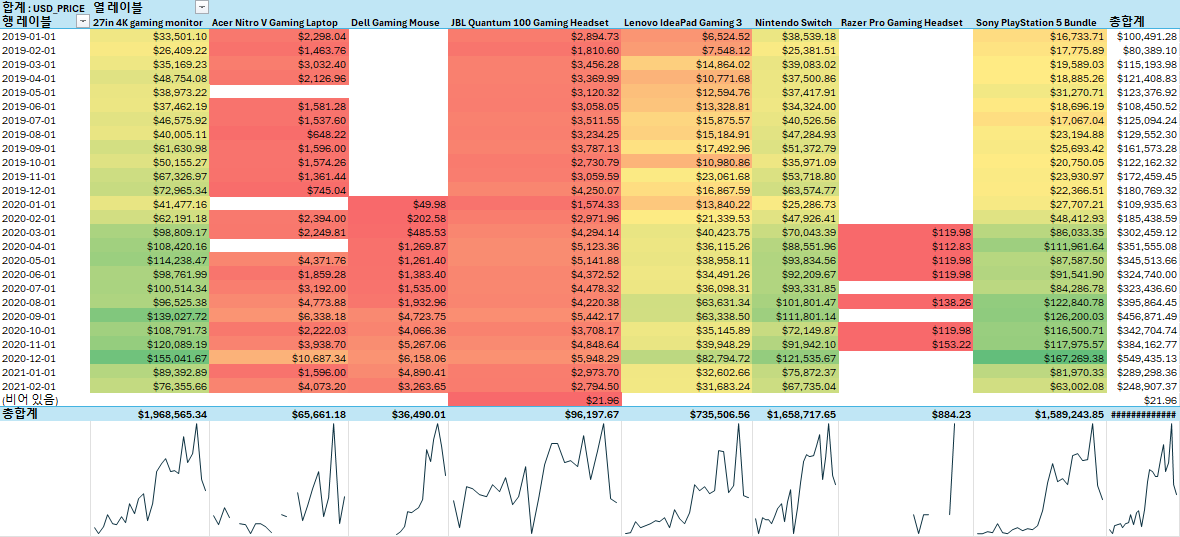
2. USD_price/Product
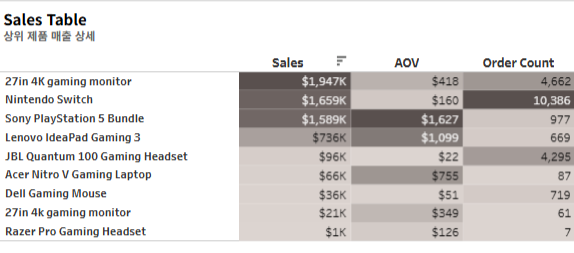
- Top performing products is gaming monitor(almost $2M total sales), worst performing is gaming headset ($800). Might be missing data, would need to check with team (Finance team, Product team)
3. USD_price / Product Category
- Worst performing category is headsets, which are reponsible for less than 2% of sales (Product team)
4. USD_Price / Month
- December 2020 saw a large spike in sales - seems like fall and winter months before the new year perform best. Maybe related to holiday season or promotion at that time. (Marketing team)
5. USD_price / Product
- All products had significant spike in sales 2020 onwards, following the general trend in total sales. This indicated a macro or company-wide impact(mostly likely due to COVID) (Finance team)
6. USD_price / Product
- Almost all products exhibited a splike in December 2020 - look into promotions or campaigns that happened at this time (Marketing team)
EDA in Tableau
Overall USD
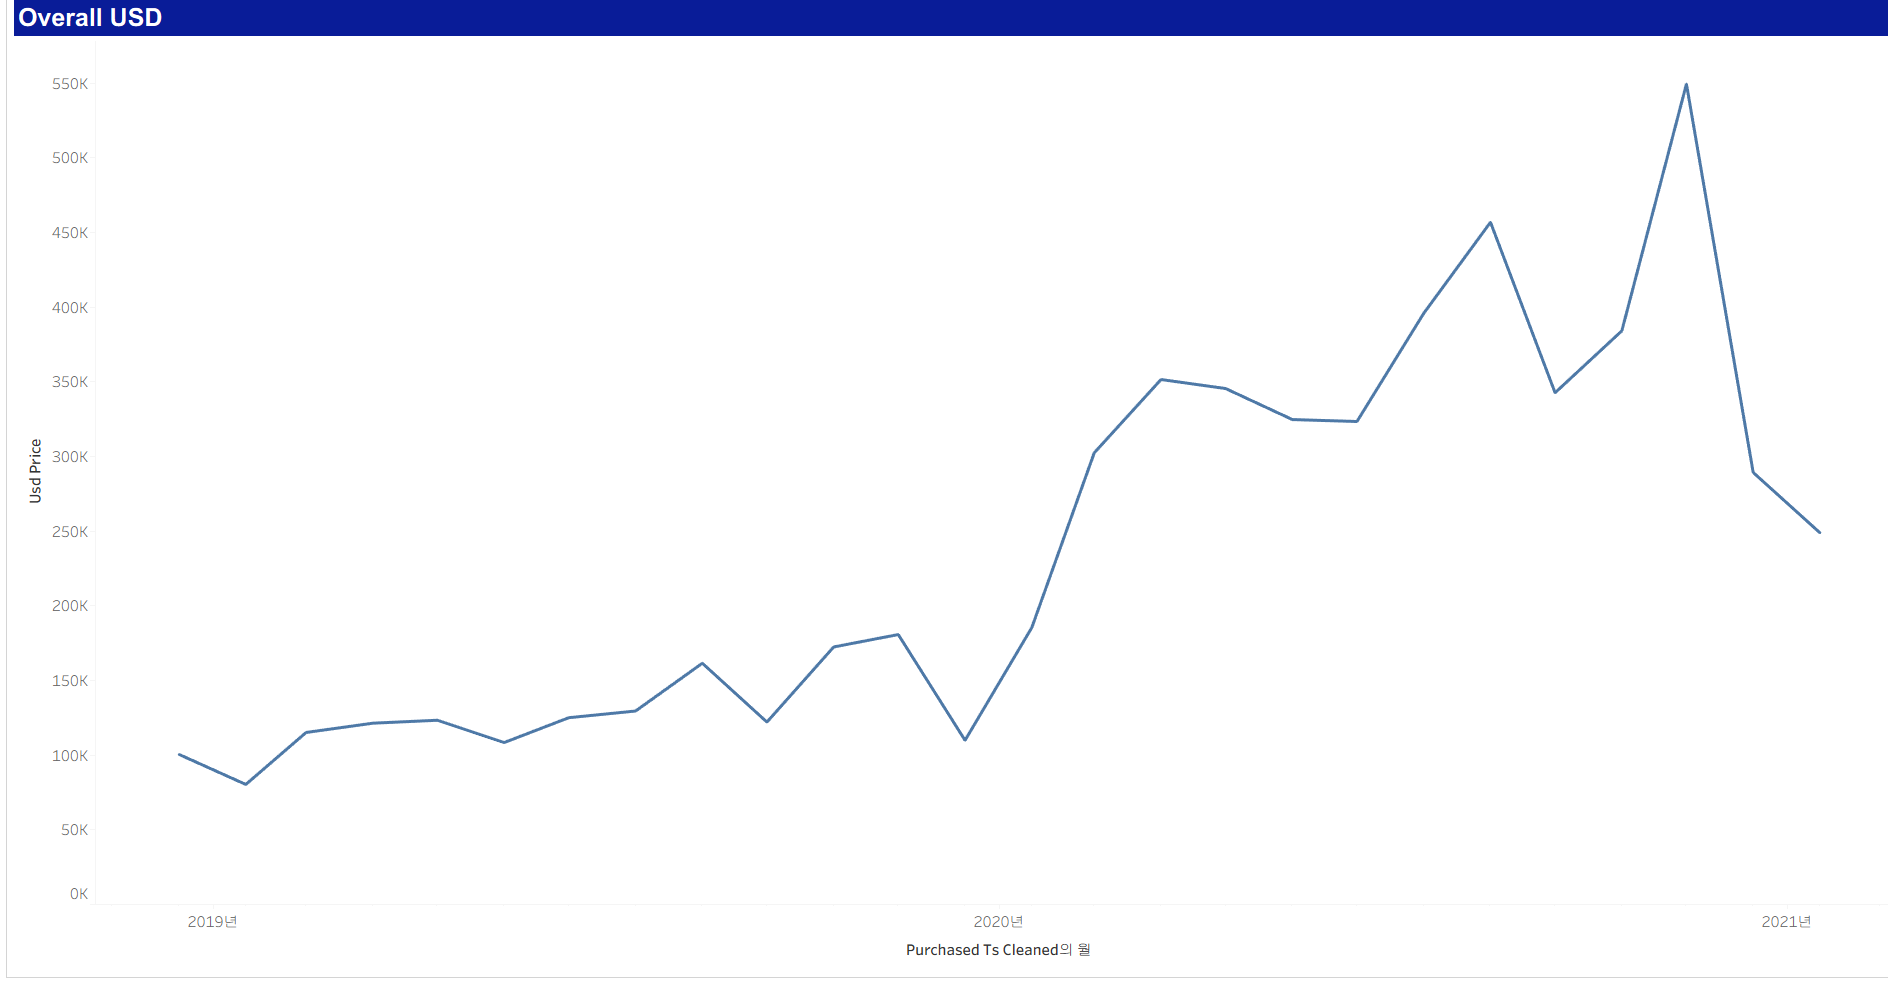
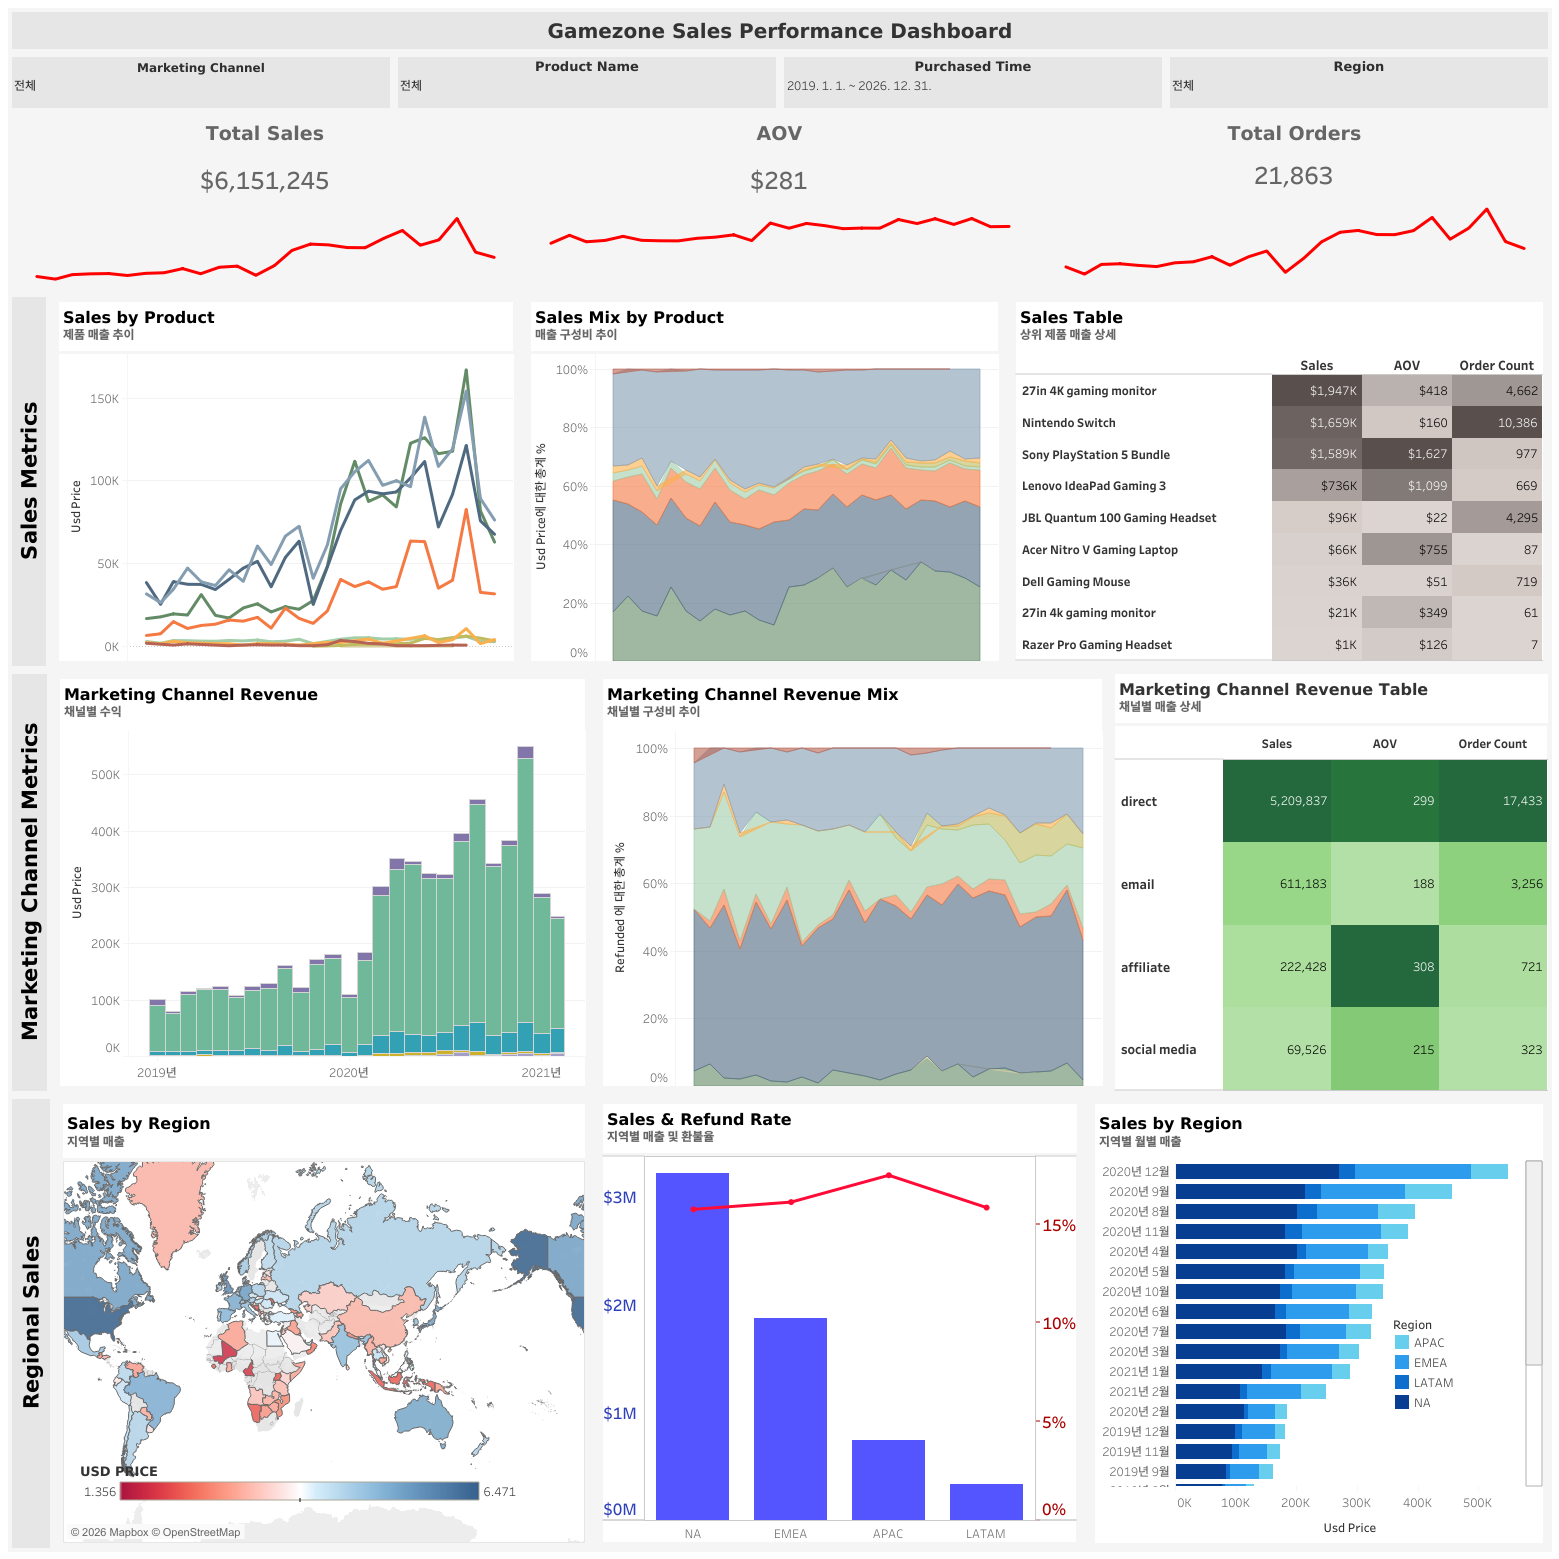
- Sales more than doubled in early 2020, with all-time high in Sep and Dec 2020. Sales dropped significantly in Feb 2021, nearing pre-COVID levels.
Products USD
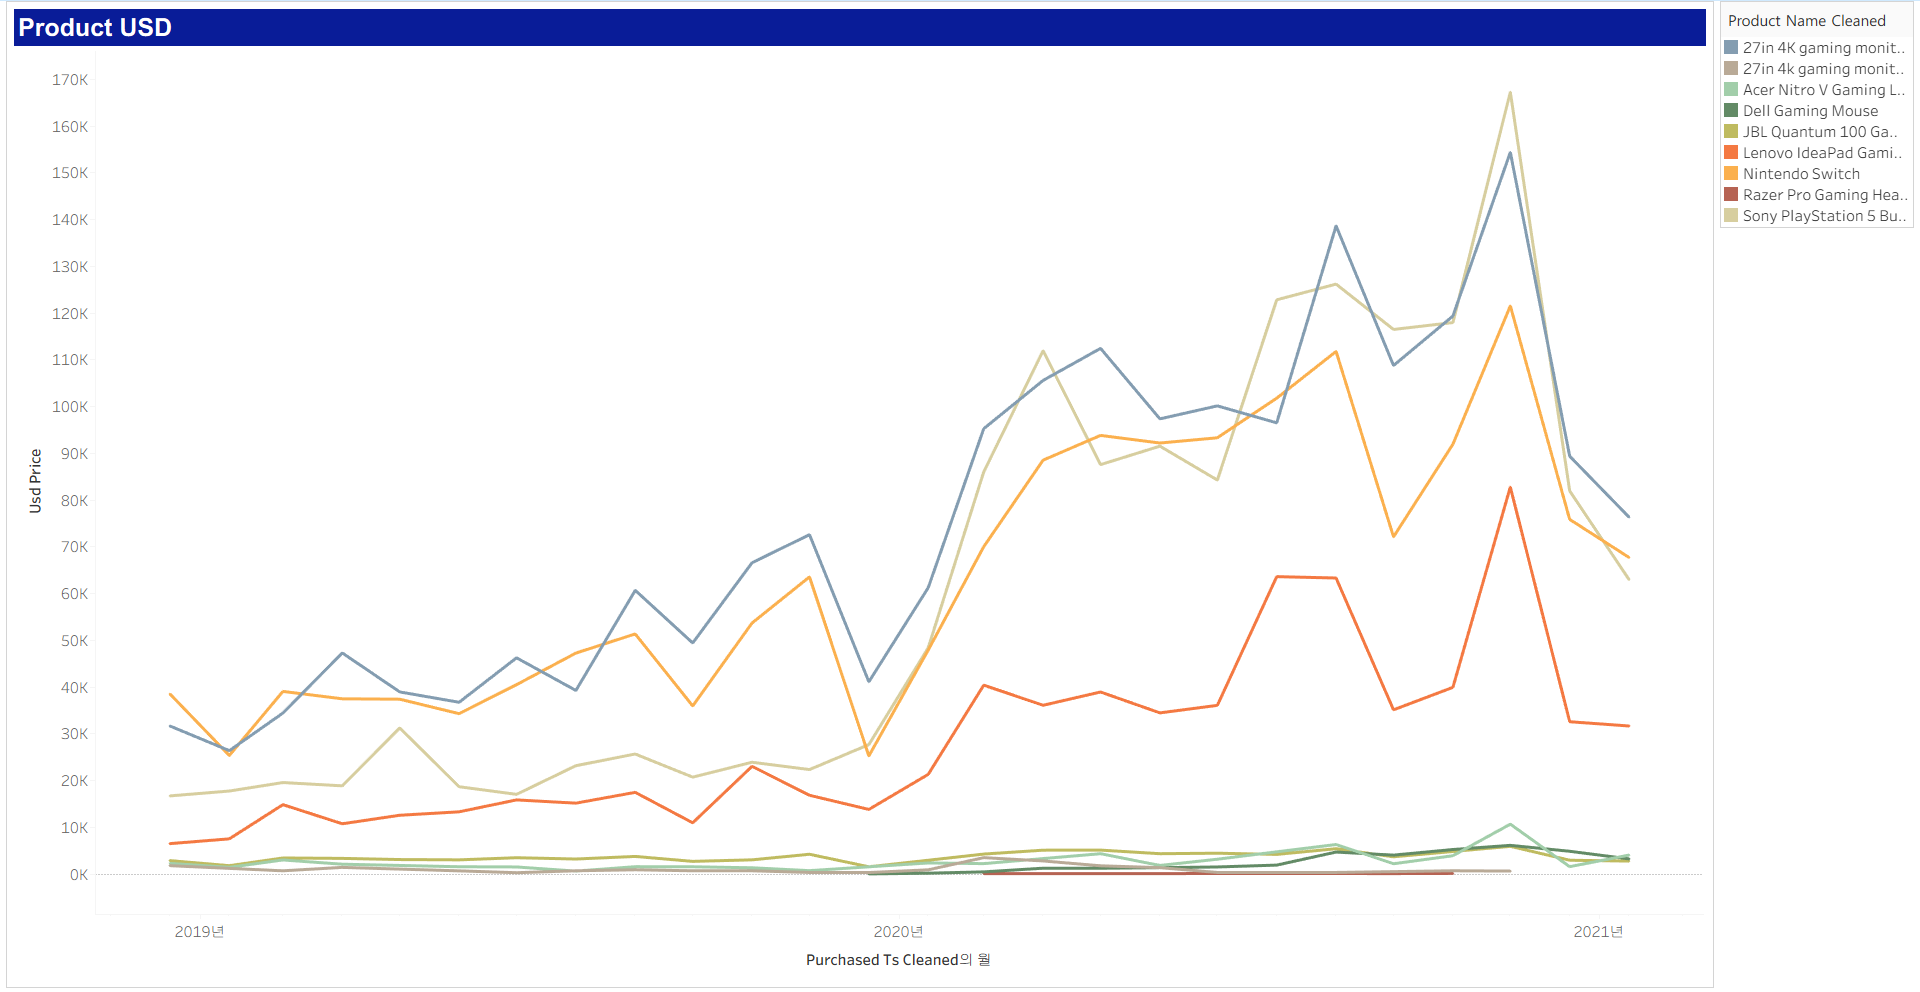
- 27in 4K Gaming monitor, Nintendo Switch, and Sony Playstation5 bundle are main drivers of the dip - all three exhibit the same plateauing behavior in 2020 and 2021.
Marketing USD
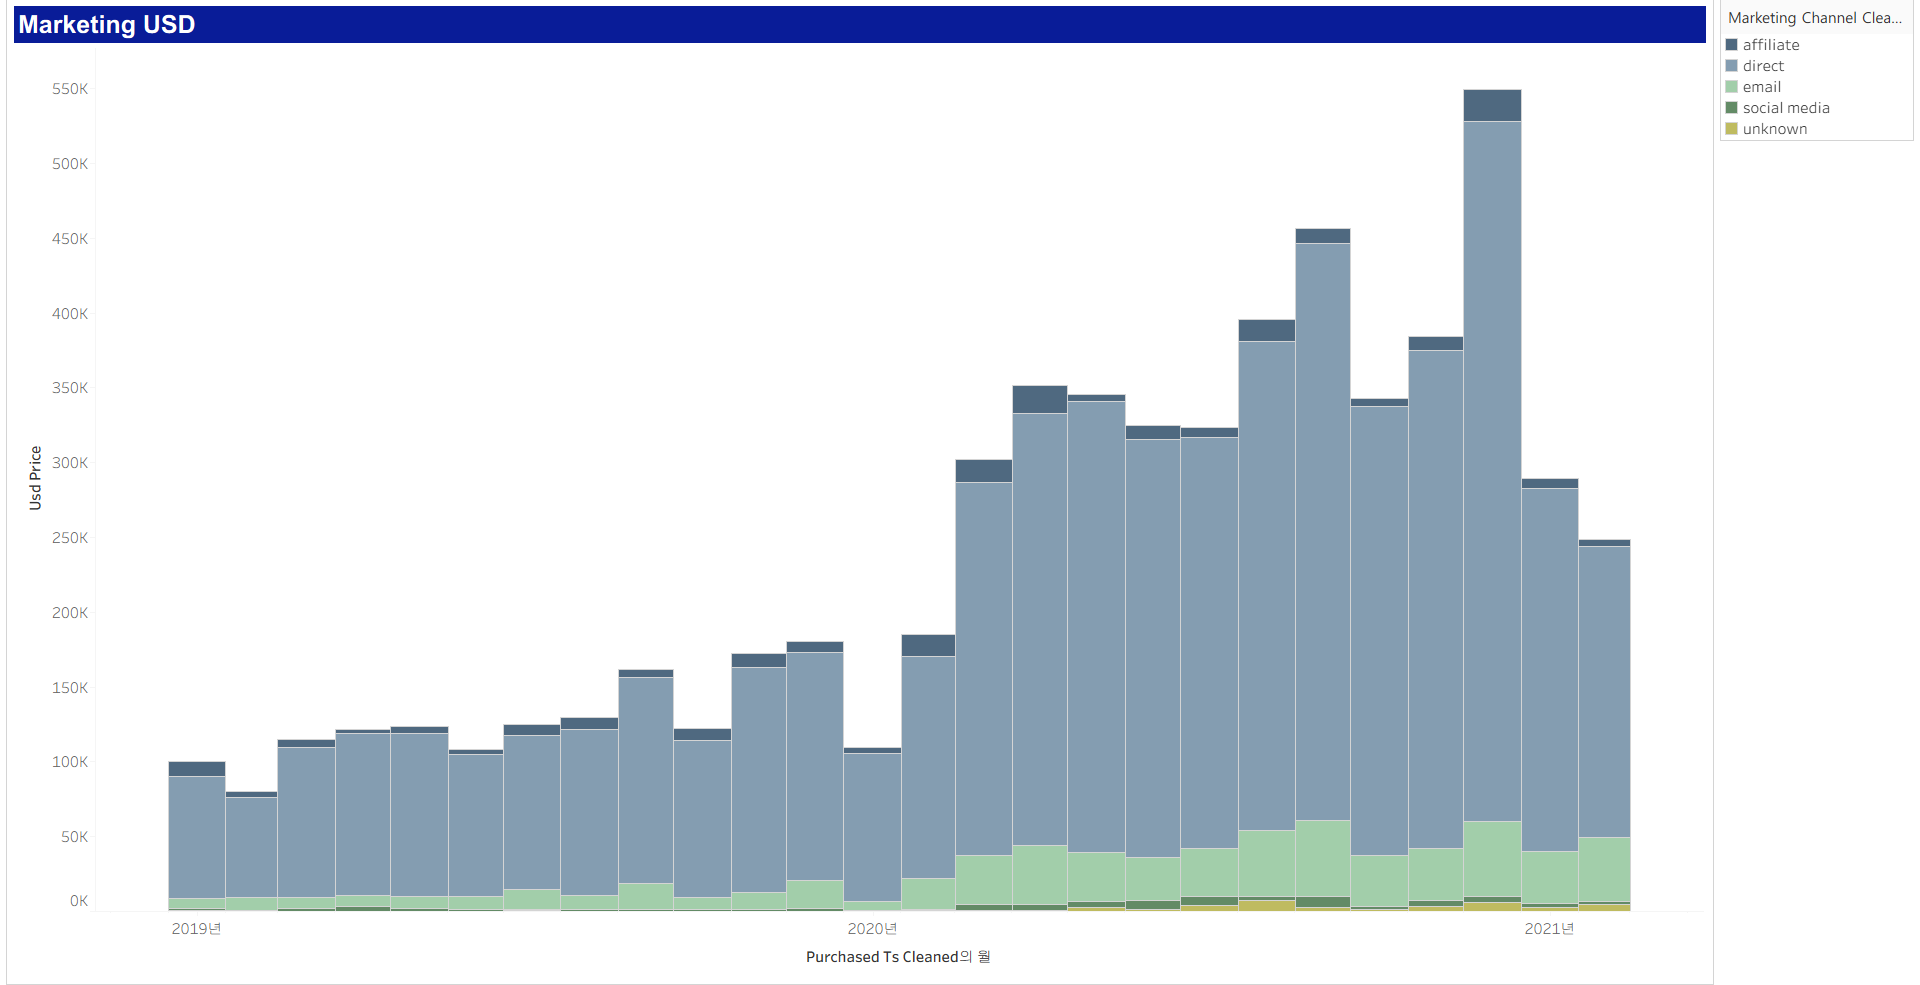
Direct is the main driver of sales - all other channels pale in comparison
Region USD
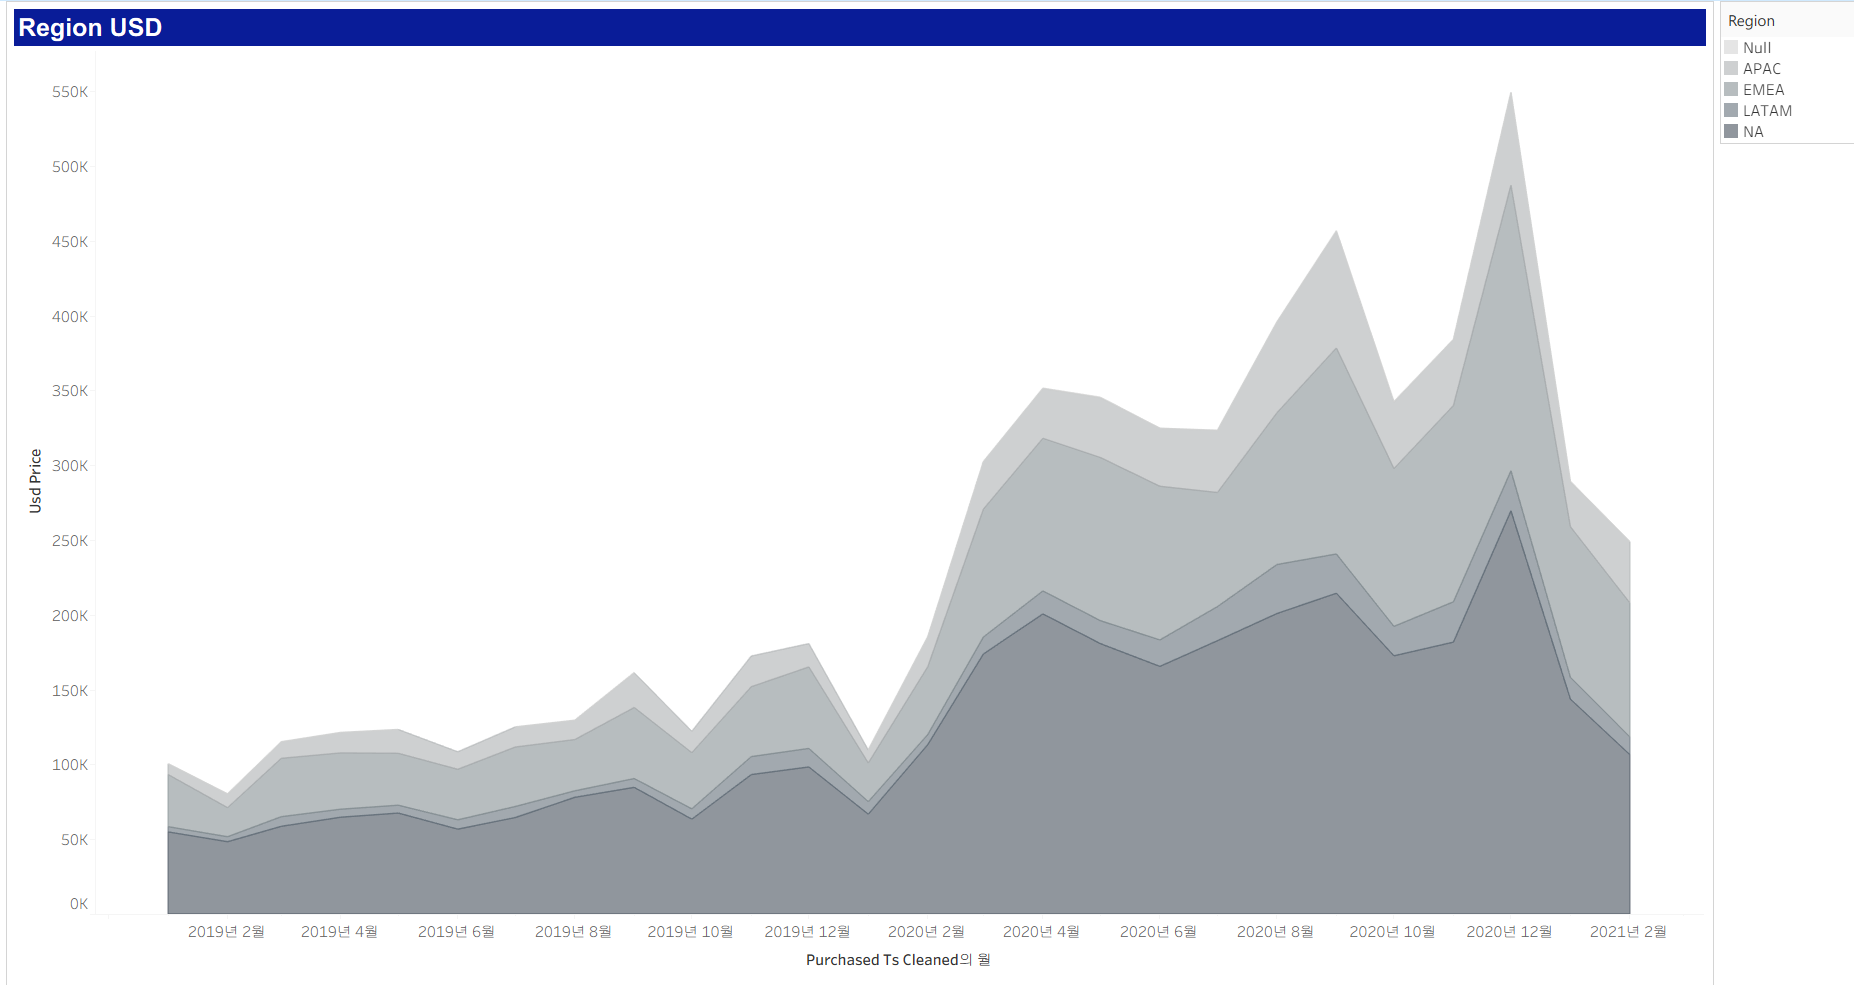
- All regions exhibit similar dips in 2020 and 2021, indicating global / macro trend
Product Marketing
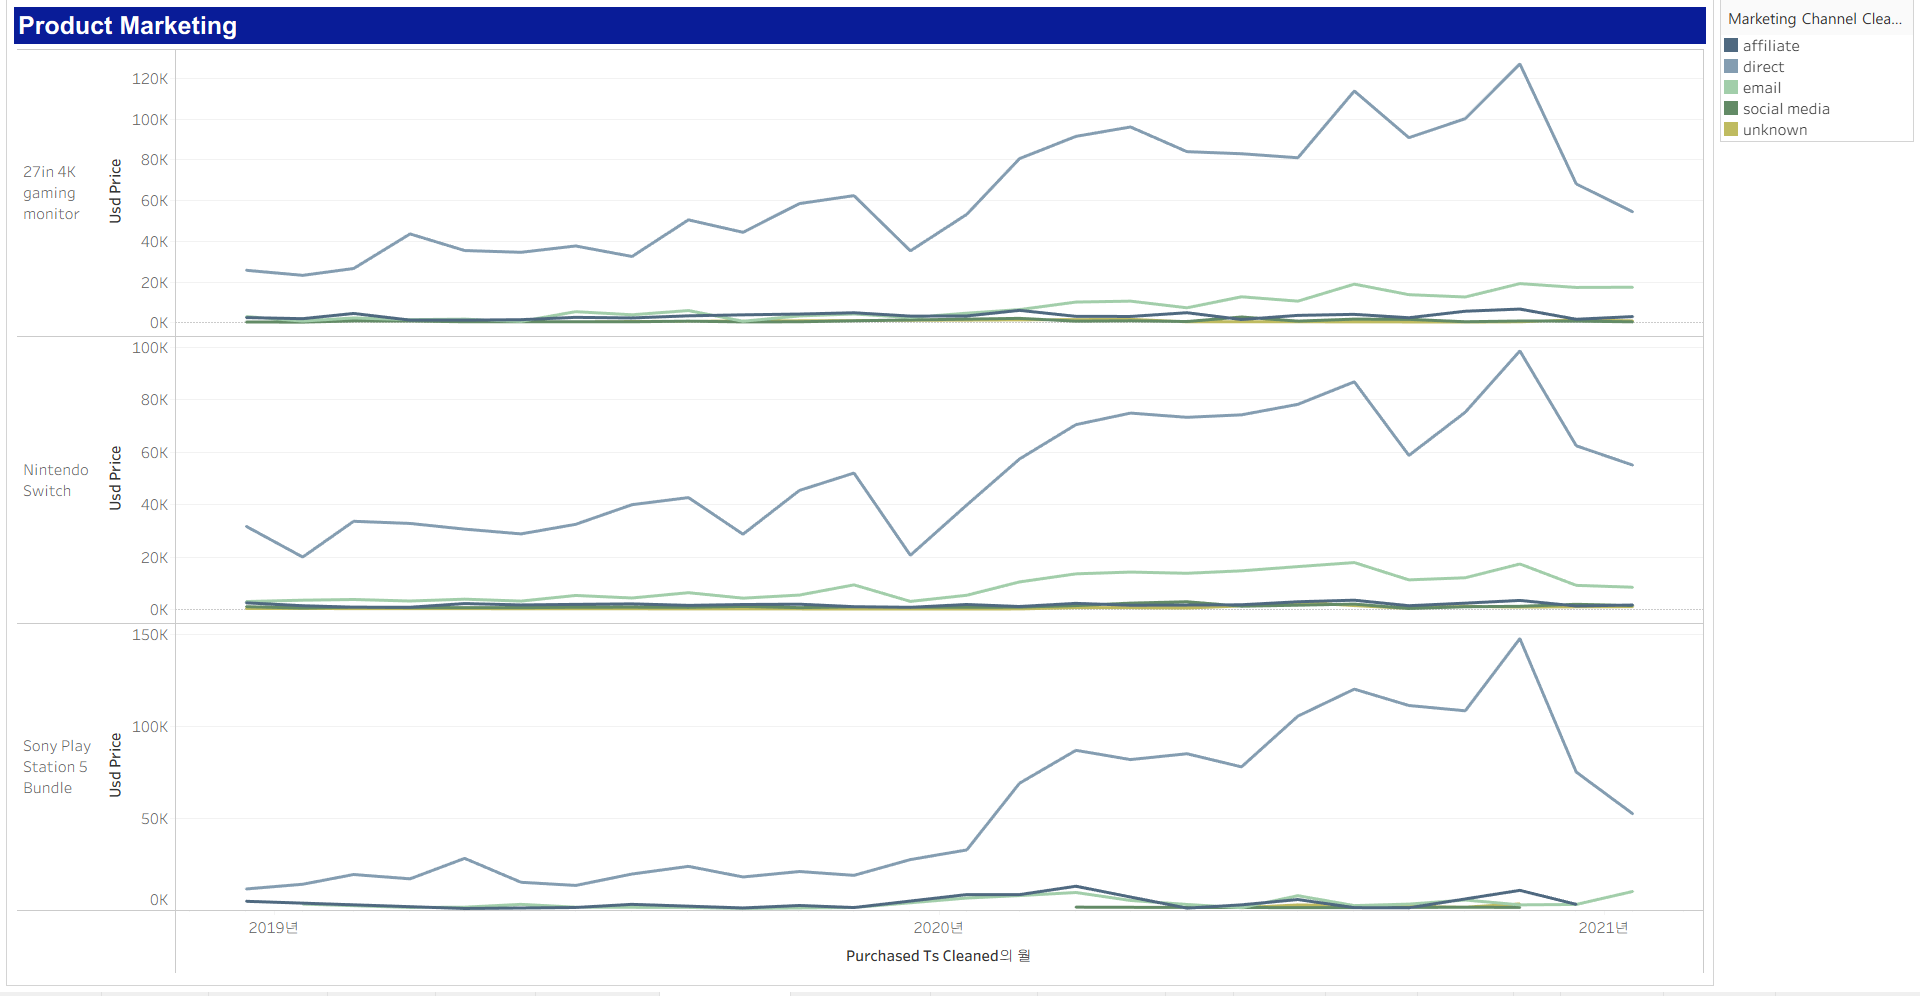
- Whole all three top products(27in 4K Gaming Monitor, Nintendo Switch, Sony Playstation5 Bundle) exhibited dips in early 2020 and 2021, Sony playstation5 bundle had major dip in direct traffic in the beginning of 2021 compared to other products and marketing channels. Since then, consistent decline for that products's direct channel sales.
Product Region
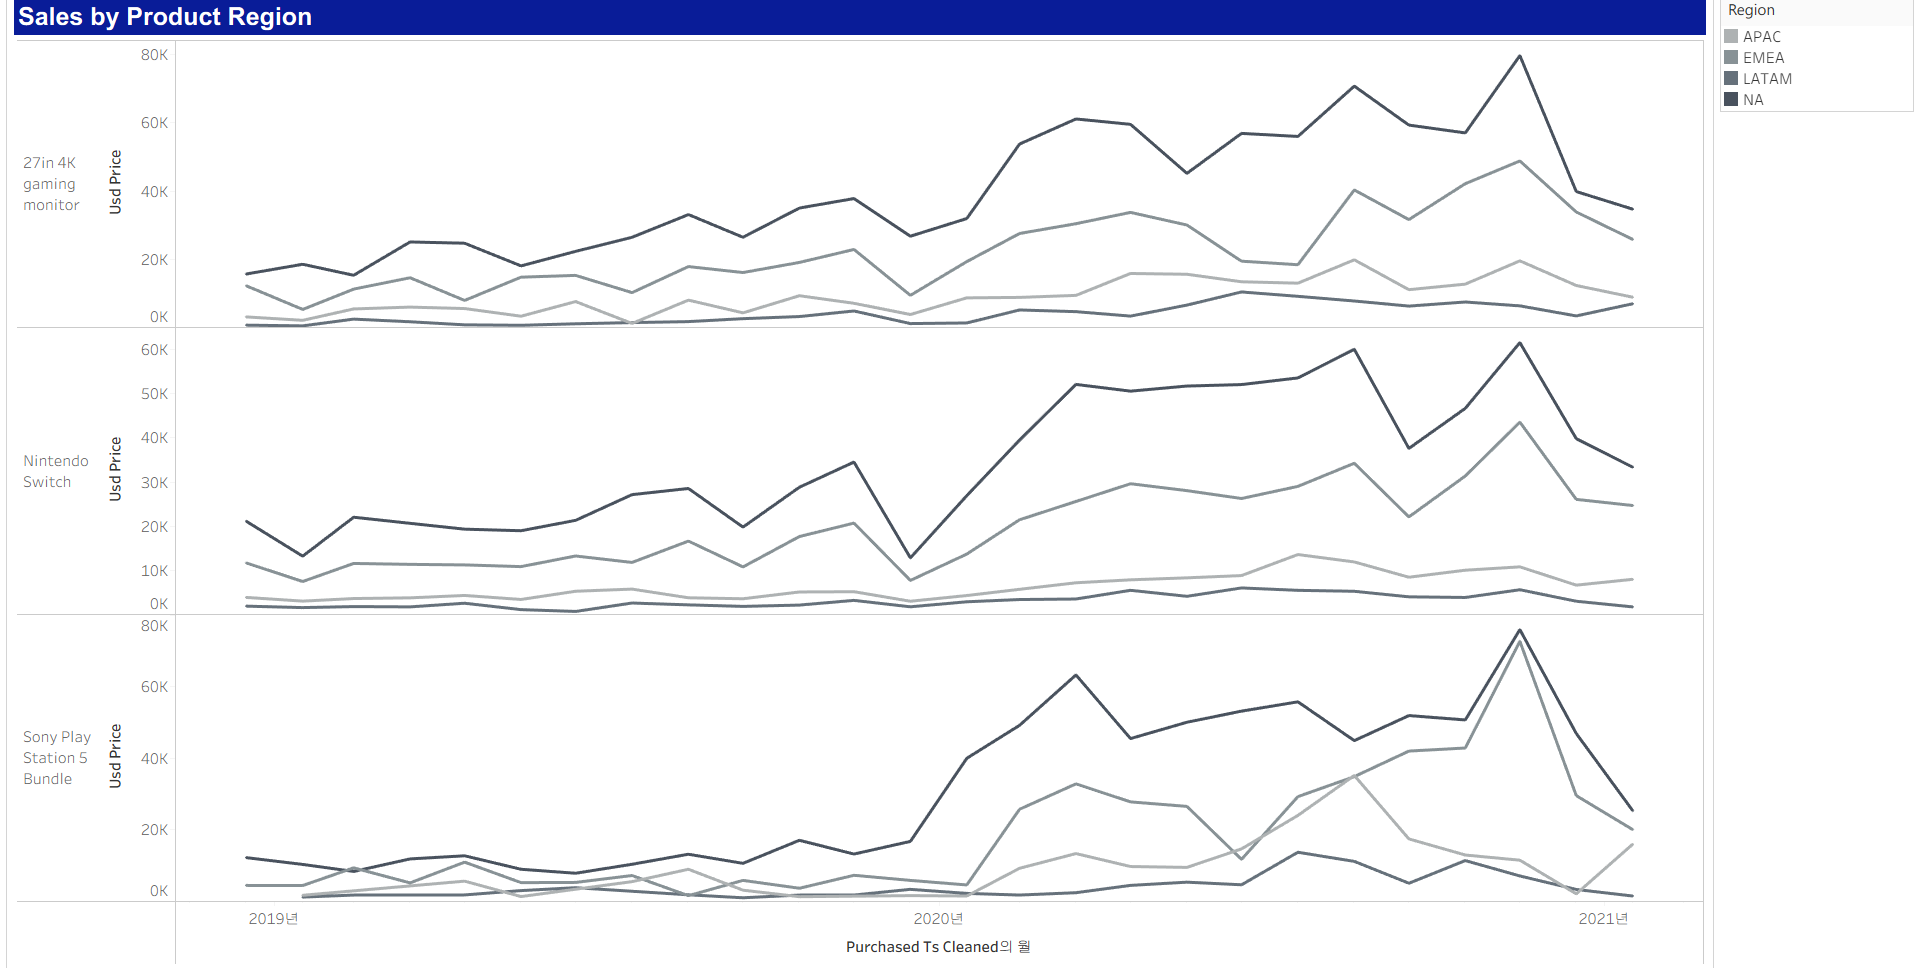
- For Sony Playstation5 bundle, the drop is mostly contained to the NA region and direct traffic - may indicate a shift in trends or competitors there.
3. Dashboard
4. Recommendation
1. Finance / Analytics
- (Directional) Investigate the main drivers of the dip in sales in the years following COVID - which products and regions?
2. Marketing
- (Actionable) Push more promotions and marketing strategies towards North American sales for gaming monitor and playstation, which have more transaction than other top2 products.
- (Actionable) Double down on Winter sales by pushing promotions for Top3 products in October / November
- (Actionable) Focus marketing strategy on social media channel, which shows potential uptick, in order to shift away from reliance on Direct traffic.
3. Product
- (Actionable) Remove headsets from the inventory as these make up less than 2% of overall revenue.
4. Data
- (Directional) Double check attribution to marketing channel is correct - direct semms oversized.
5. General
- (Contextual) Awareness than when people spend more time at home, there's greater willingness to spend on gaming products.