1. Creating RFM Data Mart (MySQL)
Creating RFM Data Mart on MySQL
Recency, Frequency, Monetary, avg_delivery_days, avg_review_score, delay_rate are produced as columns.
USE olistdata;
WITH pay AS (
SELECT
order_id,
SUM(payment_value) AS order_payment
FROM order_payments
GROUP BY order_id
),
delivery AS (
SELECT
order_id,
order_delivered_customer_date,
order_estimated_delivery_date,
DATEDIFF(order_delivered_customer_date, order_purchase_timestamp) AS delivery_days
FROM orders
WHERE order_status = 'delivered'
),
base AS (
SELECT
c.customer_unique_id,
o.order_id,
o.order_purchase_timestamp,
pay.order_payment,
d.delivery_days,
d.order_delivered_customer_date,
d.order_estimated_delivery_date,
r.review_score
FROM orders o
JOIN customers c
ON o.customer_id = c.customer_id
JOIN pay
ON o.order_id = pay.order_id
JOIN delivery d
ON o.order_id = d.order_id
LEFT JOIN order_reviews r
ON o.order_id = r.order_id
WHERE o.order_status = 'delivered'
),
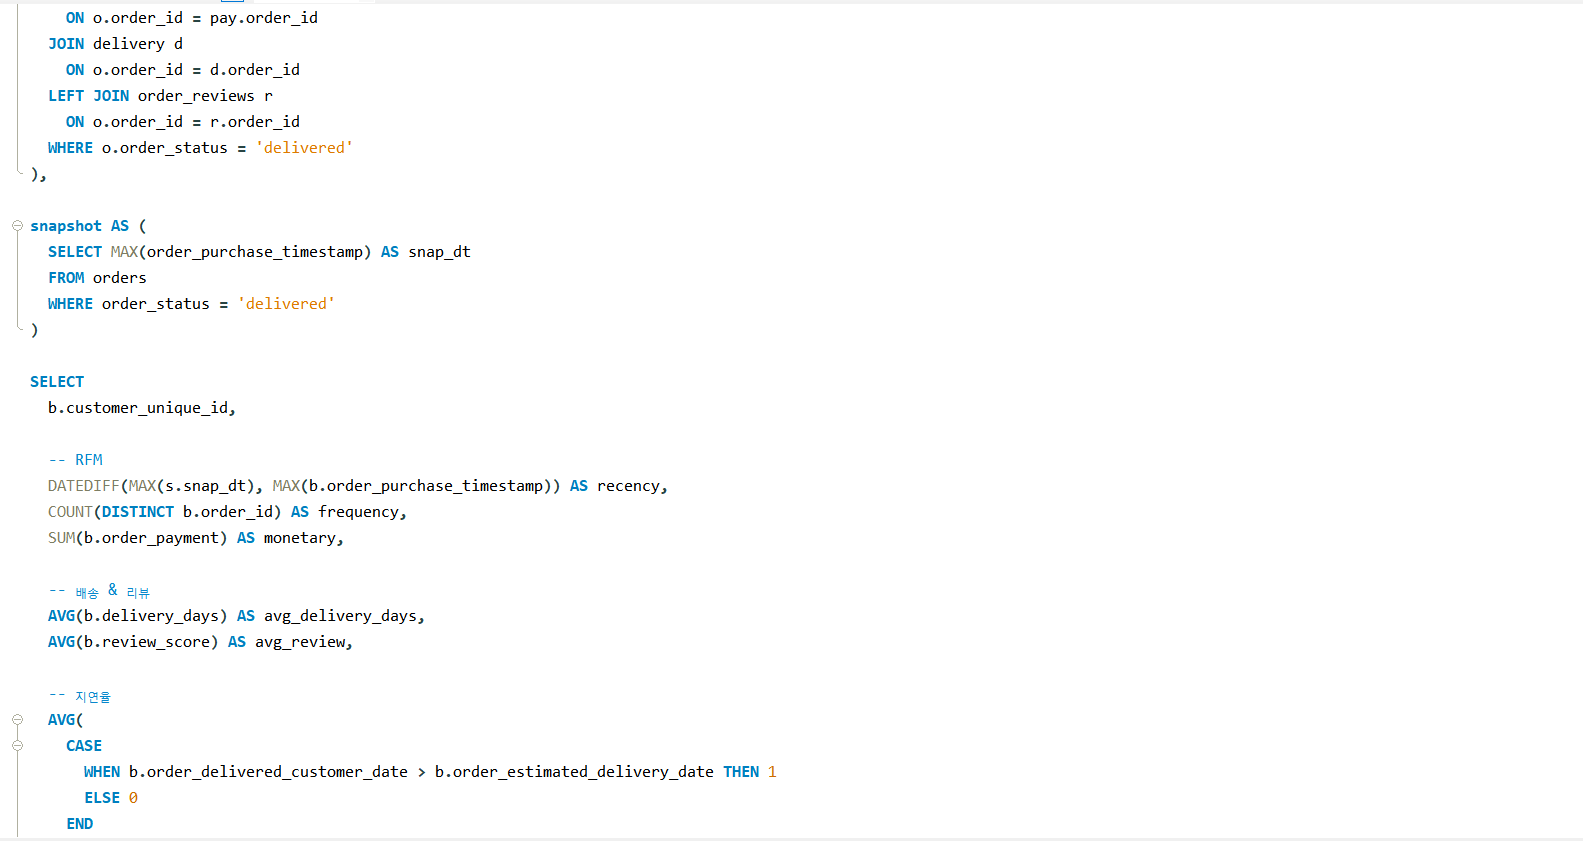
snapshot AS (
SELECT MAX(order_purchase_timestamp) AS snap_dt
FROM orders
WHERE order_status = 'delivered'
)
SELECT
b.customer_unique_id,
-- RFM
DATEDIFF(MAX(s.snap_dt), MAX(b.order_purchase_timestamp)) AS recency,
COUNT(DISTINCT b.order_id) AS frequency,
SUM(b.order_payment) AS monetary,
-- 배송 & 리뷰
AVG(b.delivery_days) AS avg_delivery_days,
AVG(b.review_score) AS avg_review,
-- 지연율
AVG(
CASE
WHEN b.order_delivered_customer_date > b.order_estimated_delivery_date THEN 1
ELSE 0
END
) AS delay_rate
FROM base b
CROSS JOIN snapshot s
GROUP BY b.customer_unique_id;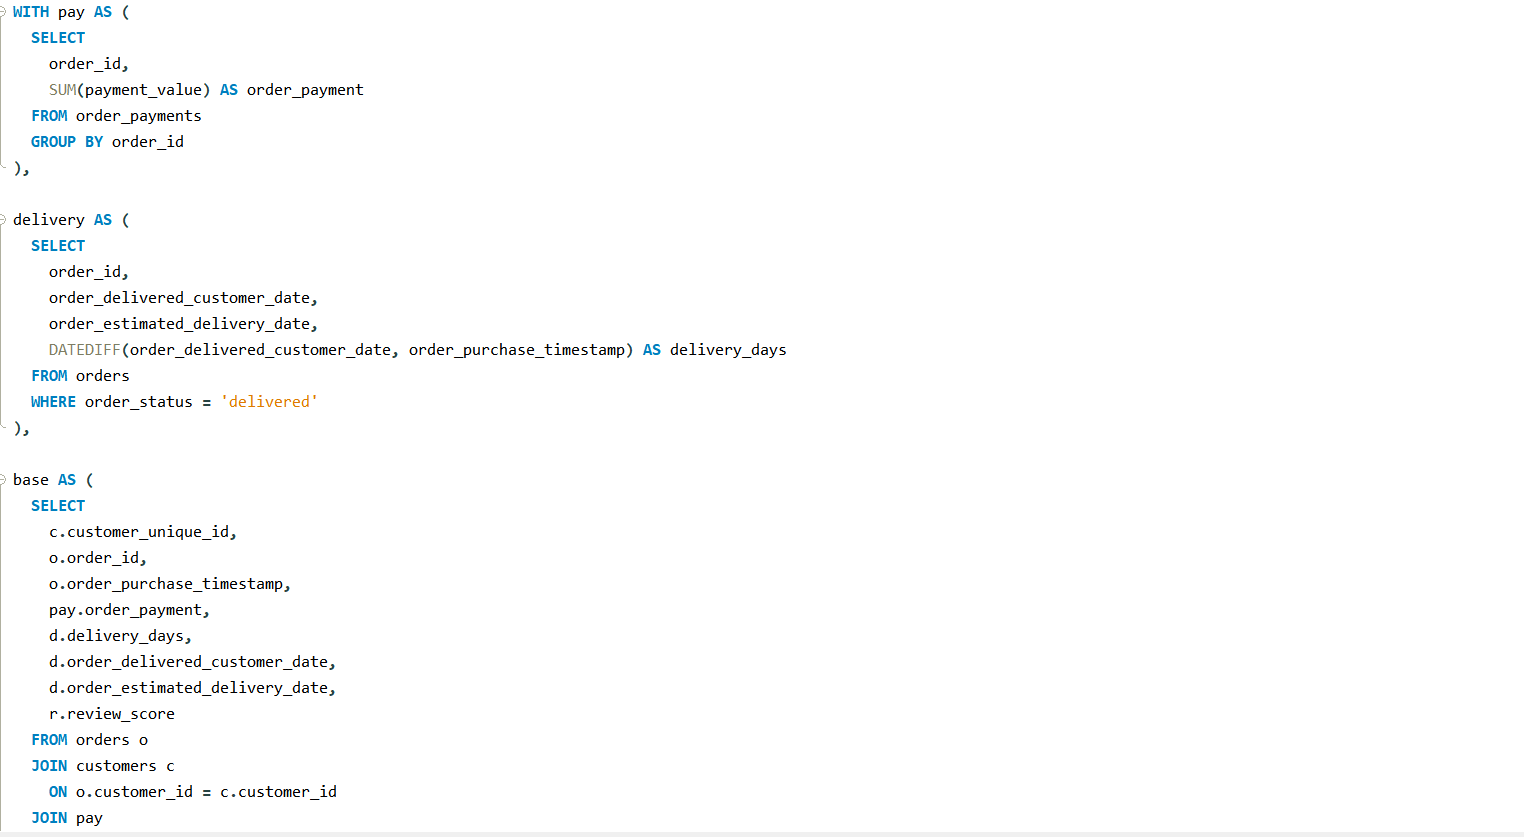

Created Data Mart are saved as csv file in computer, and imported into Tableau for further analysis of RFM Data
2. Score Caculation & Visualization (Tableau)
Recency Score
The first step in Tableau was to create Recency Score and vizualize distribution with bar chart.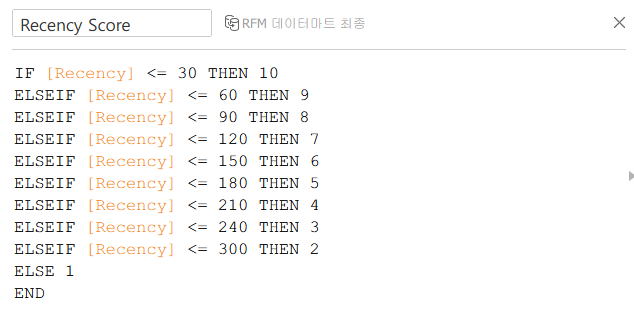
Recency was defined as the number of days since the customer's most recent purchase, calculated from the last date available in the dateset.
I assigned higher Recency score to customers with lower Recency values.
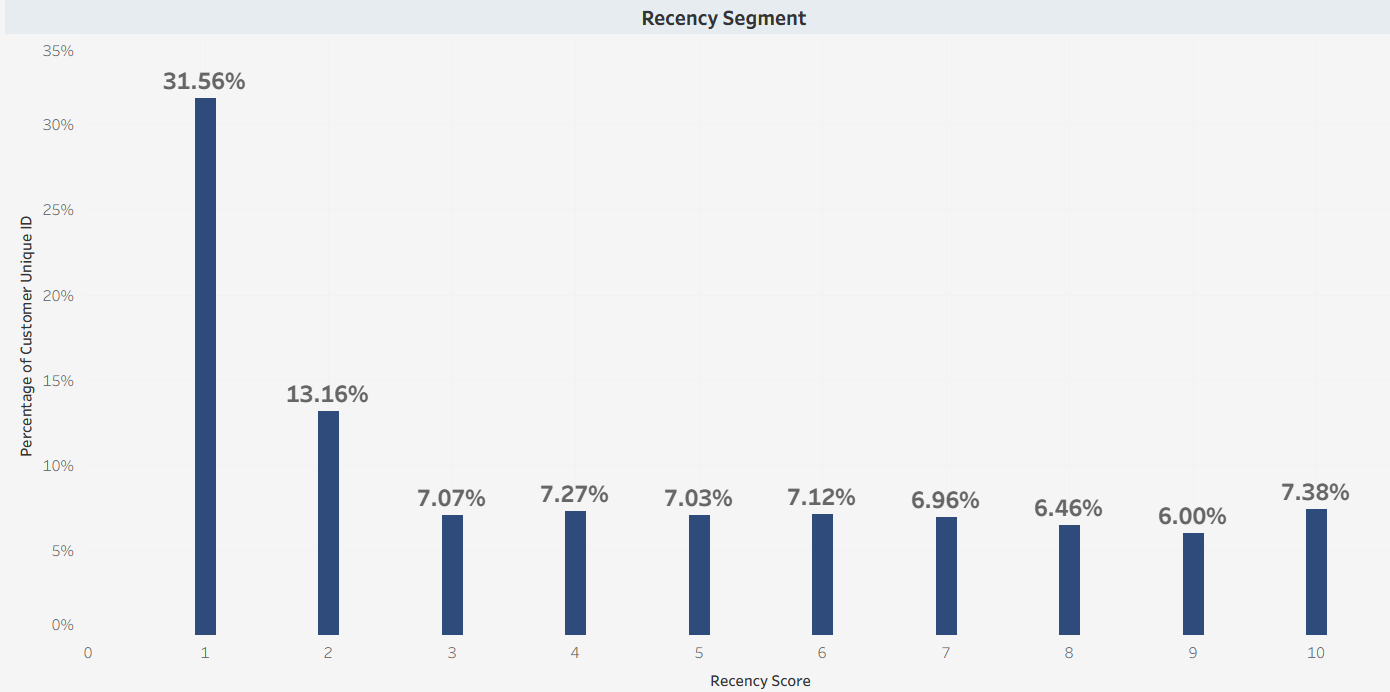
Inactive customer concentration
This distribution shows a strong concentration of customers with low Recency scores. About 31.56% of customers fall into Recency score 1, indicating that a large portion of customers have not made a purchase recently. The remaining scores are relatively evenly distributed, suggesting that active customers are spread across different recency levels.
Frequency Score
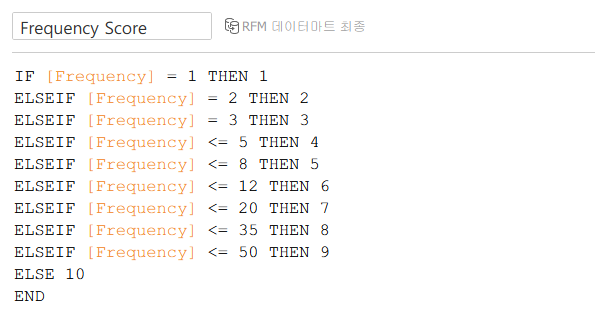
Frequency Score are calcuated like this. The more customers are involved in purchase the higher score they're assigned
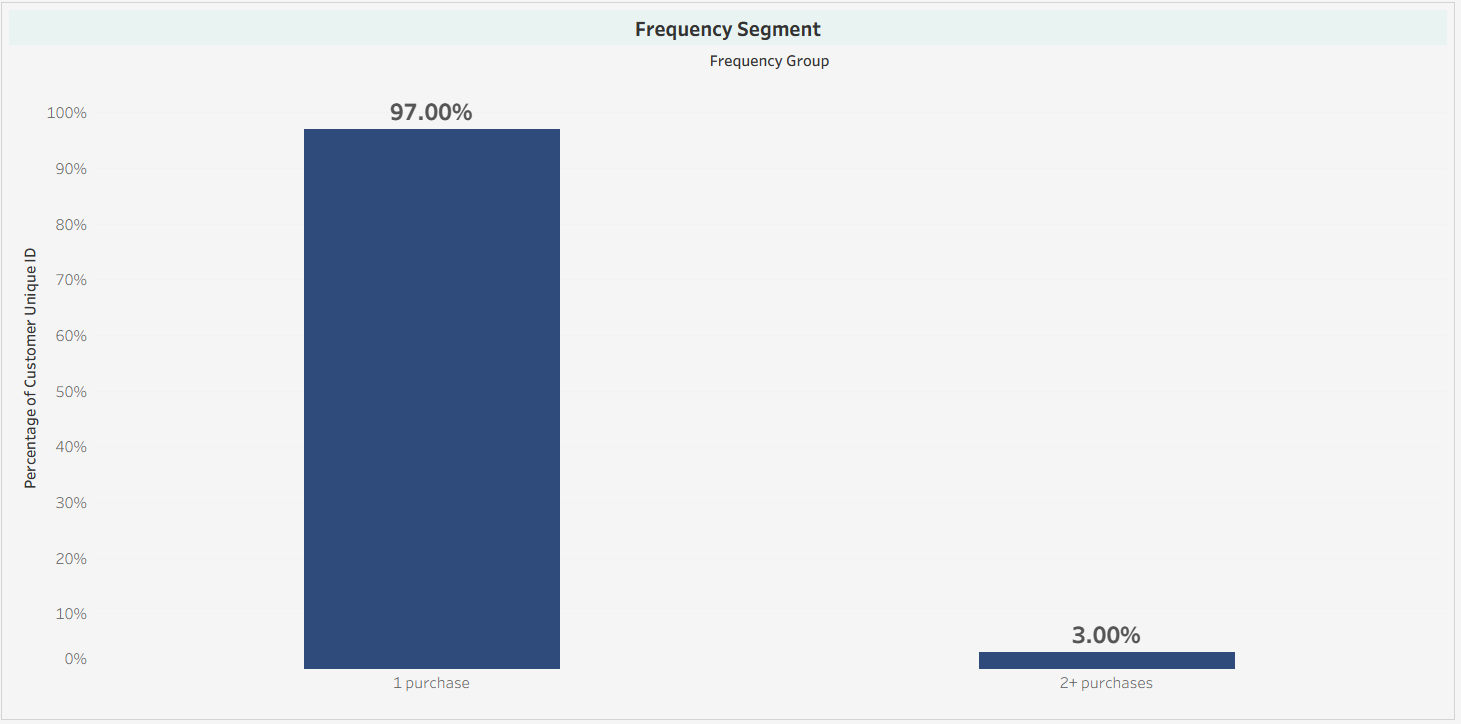
97% of customers are involved in 1 purchase, only 3% of customers purchased over 2 on the other hand.
Monetary Score
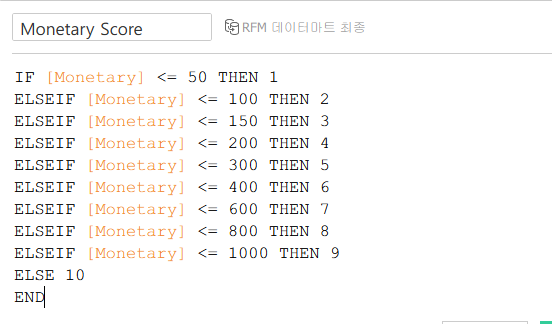
Monetary scores were assigned based on customer spending levels, with higher spending customers receiving higher scores.
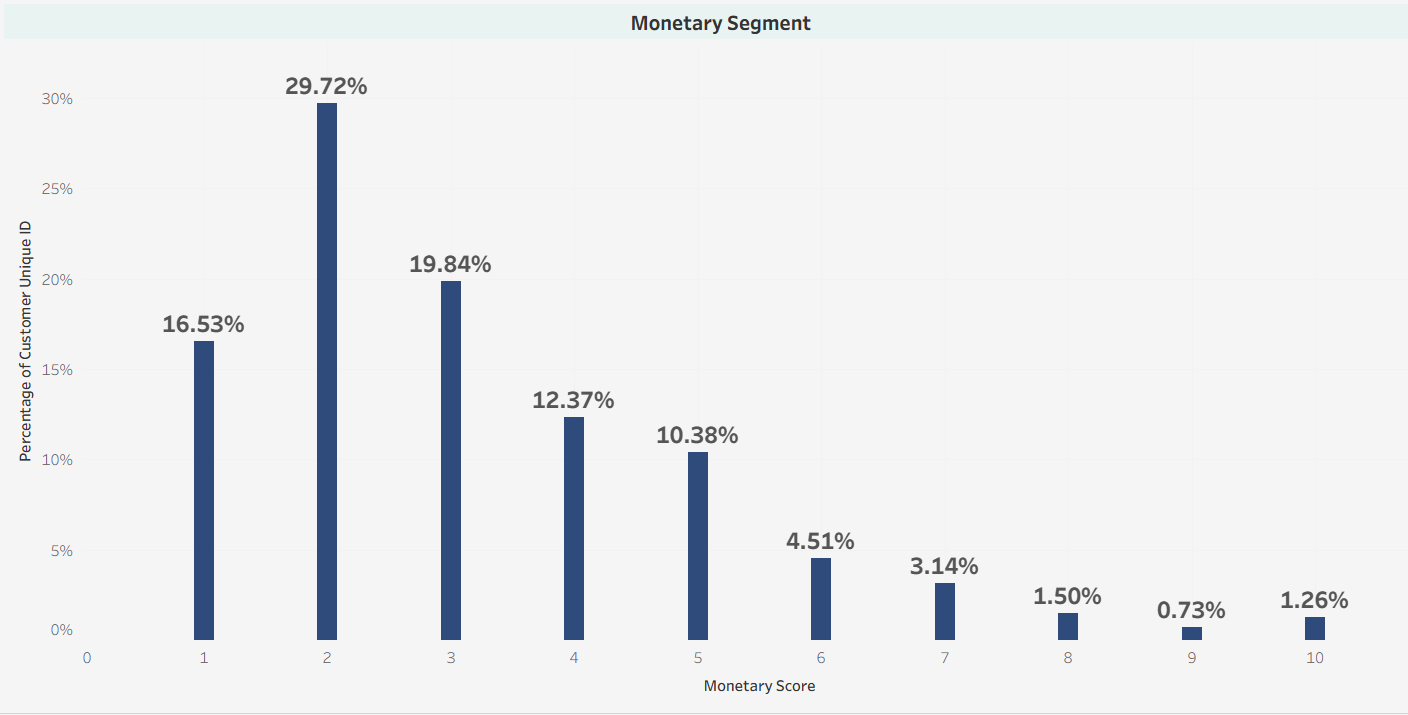
Long Tail Distribution
Most customers belong to the lower Monetary score groups, indicating that the majority of customers spend relatively small amounts, while only a small portion of customers are high-value spenders.
RFM Group Score
Added three separate score, RFM Score has been calulated
3. RFM Analysis (Focusing on relationship between average arrived days and average review score)
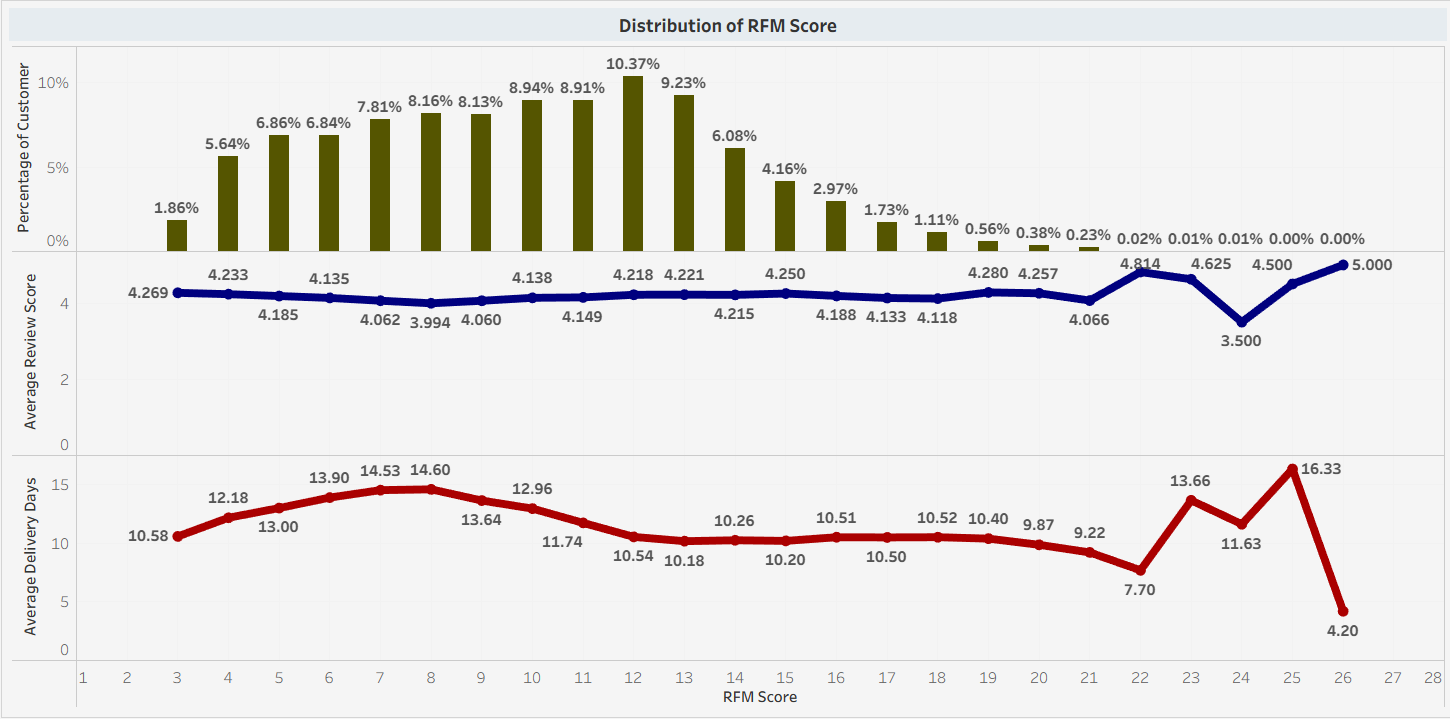
Most customers fall into the mid-range RFM scores, particularly between 10 and 13.
Customer satisfaction remains consistently high, with average review scores above 4 across most segments.
Delivery times are generally stable around 10–12 days, although a few segments show longer delivery periods.
4. Arrived Day & Reivew Score Analysis
Average arrived days by review score (1~5)
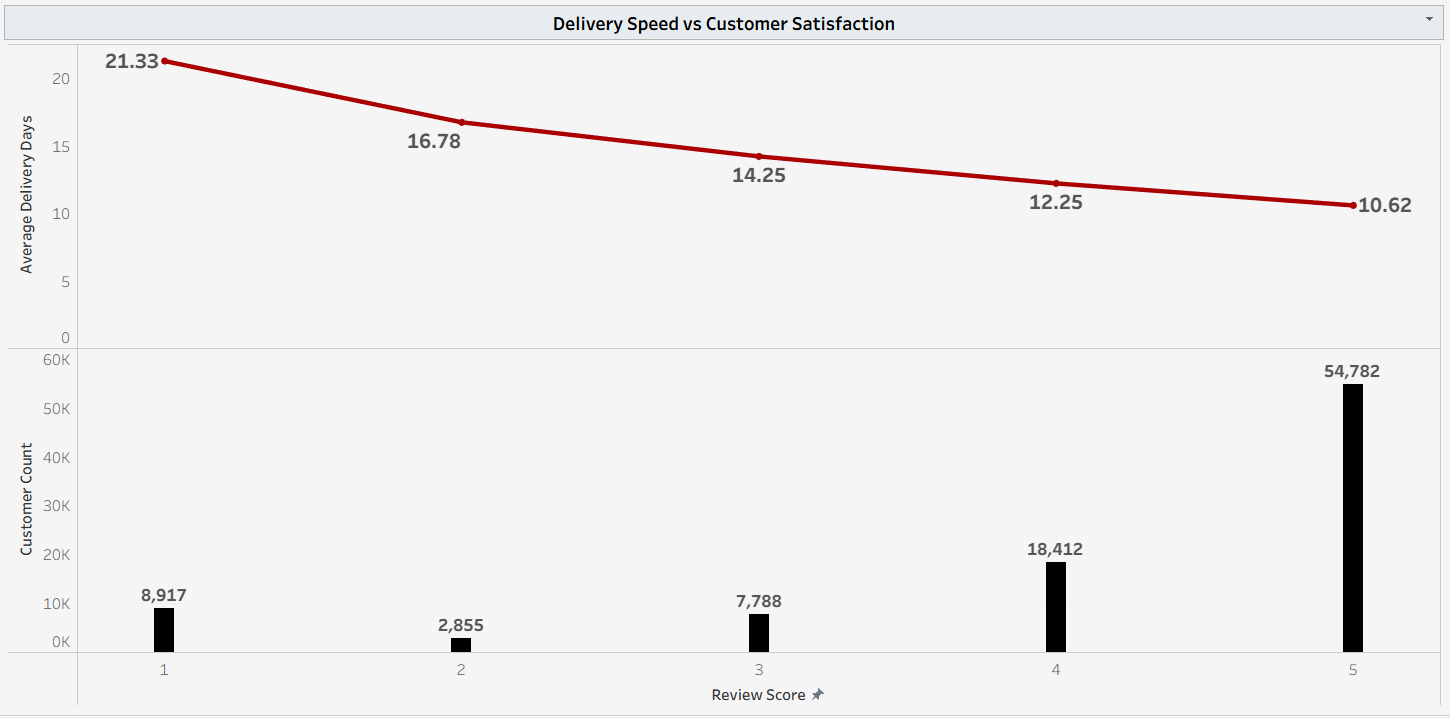
Clear negative relationship between delivery time and customer satisfaction are observed. As delivery speed improves, the average review score increases.