Image Dataset Visulization
이미지 단순 나열
- ax.imshow를 활용하여 일반적인 시각화를 진행할 수 있음
{그래프를 그릴 ax}.imshow({이미지 Data})- 실제 ax.imshow의 활용
- 이미지 Data를 표현할 때는 Axes의 Spines들을 모두 안 보이게 하는 것이 좋다. 하지만, 아래와 같은 방법으로 일부러 경계선을 뚜렷하게 표시하여 각각의 Data 범주를 표시하는 것도 좋은 방법이다.
fig, axes = plt.subplots(2, 5, figsize=(20, 8))
axes = axes.flatten()
for i in range(10):
    axes[i].imshow(data[i].reshape(8, 8), cmap='gray_r')
# cmap : 'gray_r'로 지정하면, 흑백으로 Image를 바꿔 데이터로 표시해줌


    axes[i].set_title(target[i], fontweight='bold')

    axes[i].spines['top'].set_color('red')
    axes[i].spines['bottom'].set_color('red')
    axes[i].spines['left'].set_color('red')
    axes[i].spines['right'].set_color('red')
    axes[i].set_xticks([])
    axes[i].set_yticks([])


# margin 조정
fig.subplots_adjust(left=0.125,
                    bottom=0.1,
                    right=0.9,
                    top=0.9,
                    wspace=0,
                    hspace=0)

fig.tight_layout()

plt.show()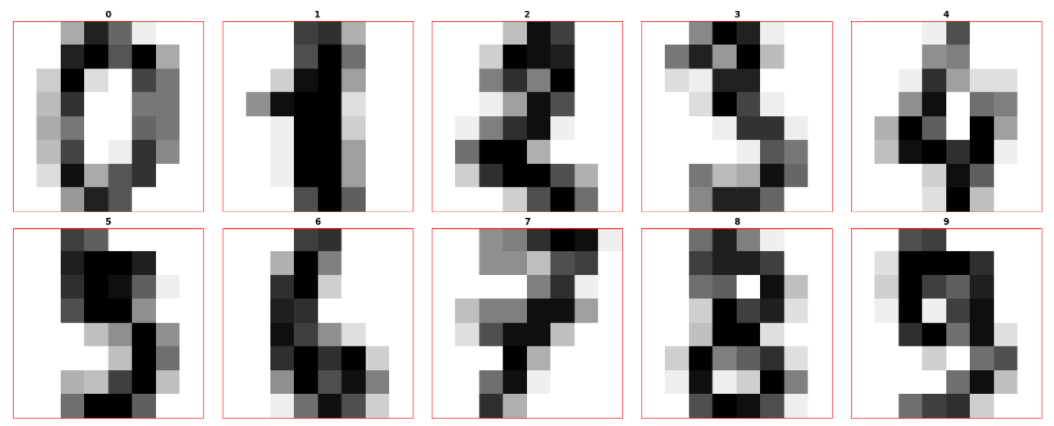
Patch를 활용
- Patch : 면적을 가진 모든 것들을 통칭
- Object Detection에서 Bounding Box를 그릴 때 활용할 수 있음
import matplotlib.patches as patches로 모듈을 가지고 와야 함
rect = patches.Rectangle({Rectangle 시작 위치}, {가로 길이}, {세로 길이})
# facecolor : patch 색
# edgecolor : patch 테두리 색
# alpha : patch의 투명도

ax.add_patch(rect) # 위에서 그린 Patch를 Ax에 적용함- Patch 활용 예시 코드
import matplotlib.patches as patches

fig, ax = plt.subplots(1, 1, figsize=(5, 5))

ax.imshow(data[0].reshape(8, 8), cmap='gray_r')

rect = patches.Rectangle((1, 2),
                         3, 4,
                         edgecolor='r', facecolor='red', alpha=0.3)
# (1,2)에서 시작하여 가로 3, 세로 4의 Rectangle을 그림

ax.add_patch(rect)
plt.show()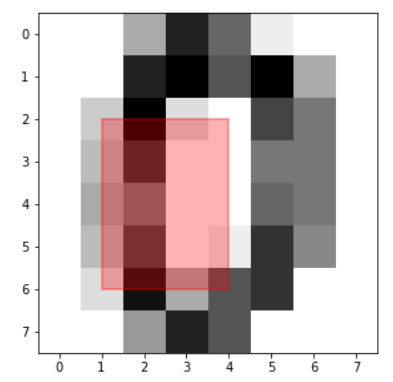
- WandB 등에서 구현 되어 있는 것도 많기 때문에, 이런 기존 툴을 활용해보자.
Text Dataset Visulization
Console창에 Highlight
- 특정 단어나 문장에 색 표현
colored({단어 or 문장}, {글씨 색}, {HighLight})-
Highlight : 글자를 강조하는 방법을 전달하는 Paramter
- 'on_red' : 글자 배경을 빨간색으로 함
-
IPython의 HTML을 활용할 수도 있다고는 하지만, 이는 HTML을 공부해야 활용 가능하기 때문에 일단 활용할 수 있다는 것만 알아두자
from IPython.core.display import HTMLHTML("{적용하고 싶은 HTML 문법}")

개념부터 확실히!