
다양한 그래프 그리기
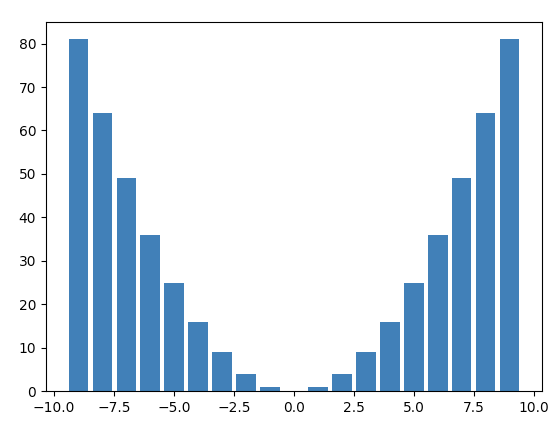
막대 그래프
x = np.arange(-9, 10)

# 막대 그래프 그리기
plt.bar(x, x**2)
plt.show()
결과
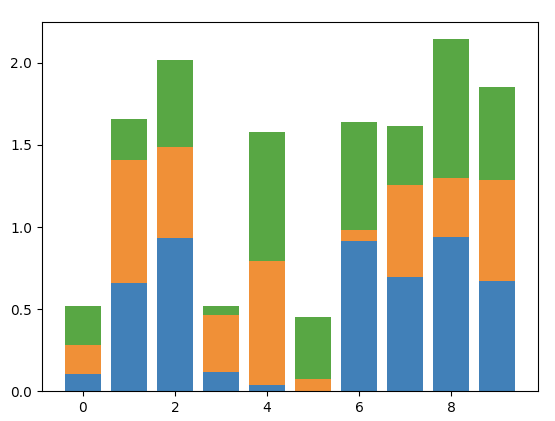
누적 막대 그래프
x = np.random.rand(10)
y = np.random.rand(10)
z = np.random.rand(10)

data = [x, y, z]
x_array = np.arange(10)

# 누적 막대 그래프 그리기
for i in range(0, 3):
    plt.bar(
        x_array,
        data[i],
        # 누적하기 위해 bottom 업데이트
        bottom=np.sum(data[:i], axis=0)
    )
plt.show()
결과
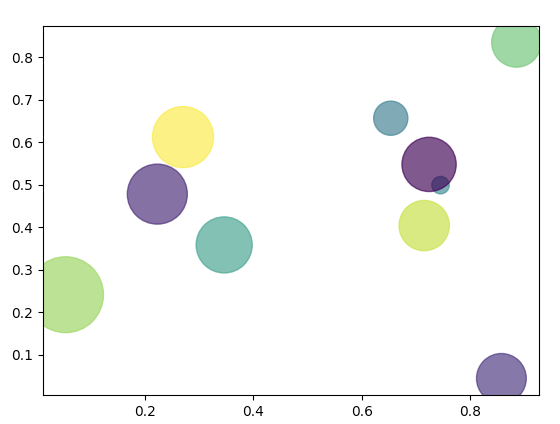
스캐터 그래프
x = np.random.rand(10)
y = np.random.rand(10)

# 색
colors = np.random.randint(0, 100, 10)
# 사이즈
sizes = np.pi*1000*np.random.rand(10)

# 스캐터 그래프 그리기
# c는 색, s는 사이즈, alpha는 투명도
plt.scatter(x, y, c=colors, s=sizes, alpha=0.7)
plt.show()
결과

안녕하세요!! 세상에 관심이 많은 공학자입니다!😆