
Matplotlib 선그래프
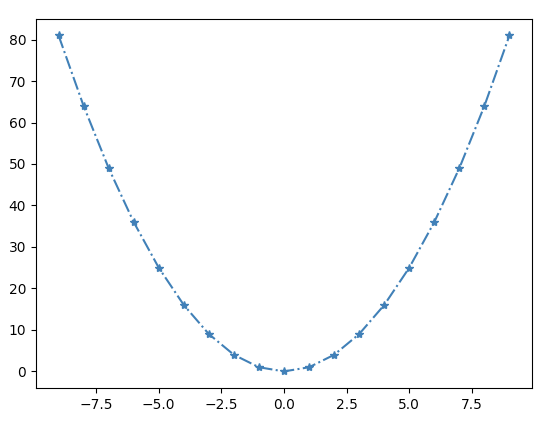
선 그래프 그리기 1 : y = x^2
x = np.arange(-9, 10)
y = x**2
# linestyle은 -, :, -., -- 등 사용
plt.plot(x, y, linestyle="-.", marker="*")
plt.show()
결과
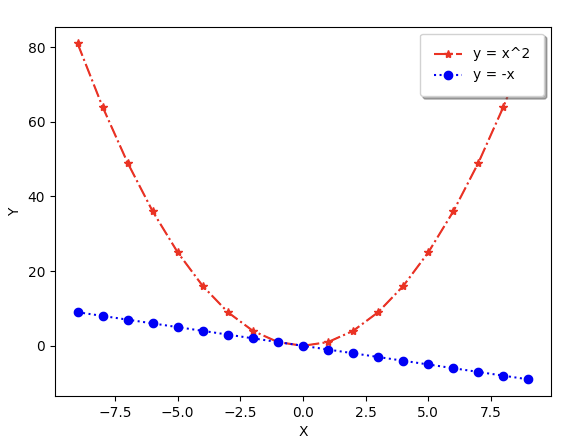
선 그래프 그리기 2 : legend
x = np.arange(-9, 10)
y1 = x**2
y2 = -x

plt.plot(x, y1, linestyle="-.", marker="*", color="red", label="y = x^2")
plt.plot(x, y2, linestyle=":", marker="o", color="blue", label="y = -x")
plt.xlabel("X")
plt.ylabel("Y")

# legend 추가
# 그림자, 테두리, 위치 등 설정
plt.legend(
    shadow=True,
    borderpad=1,
    loc="upper right"
)
plt.show()
결과

안녕하세요!! 세상에 관심이 많은 공학자입니다!😆