DS Mideterm
Lib
library(dplyr)
library(tidyr)
library(lubridate)
library(stringr)
Week 1
vector
list
뭐든 다 들어가는 vector
table / tabulate
# 정수 데이터
data <- c(1, 1, 2, 3, 2, 1, 4, 2, 3)

# 빈도수 계산
tabulated_data <- tabulate(data)

tabled_data <- tabulate(data)

# 결과 출력
print(tabulated_data)
print(tabled_data)

#[1] 3 3 2 1

# data
# 1 2 3 4
# 3 3 2 1
// frequecy

table(mtcars$fuel_efficiency, mtcars$cyl)
math
- log10(100) // 2
- exp(2) // e^2
myMode <- function(myvec)
{
	uniqueVal <- unique(myvec)
    uniqueCount <- tabulate(match(myvec, uniqueVal))
    # 9는 tabulate index는 6이지만, match를 안하게 되면 index가 9가 되어
    # 빈 index 발생
    return(uniqueVal[which.max(unique(uniqueCount)])
}
Week 2
operator
(a > b) & (c > d)

(a > b) | (c > d)
length
typeof
- c(vector) 의 typeof 는 기본적으로 double
- a <- c(1L, 10L, 100L) integer가 됨
indexing
name_vector[c(-1, -2)]

name_vector[c(1, 3, 4)]
dictionary
some_vector <- c("John Doe", "poker player")
names(some_vector) <- c("Name", "Profession")

weather_vector <- c("Mon" = "Sunny", "Tues" = "Rainy", "Wed" = "Cloudy")
Sequence
a <- 1:10
b <- seq(1, 10, 2)
c <- rep(1:3, 3) # 1,2,3,1,2,3,1,2,3
d <- rep(1:3, each=3) 1,1,1,2,2,2,3,3,3
드모르간
intersect(a_vector, b_vector) 교집합
union(a_vector, b_vector) 합집합
setdiff(a_vector, b_vector) 첫 번째 벡터에는 있지만 두 번째 벡터에는 없는 요소
find na
sum(is.na(vector))Week 3
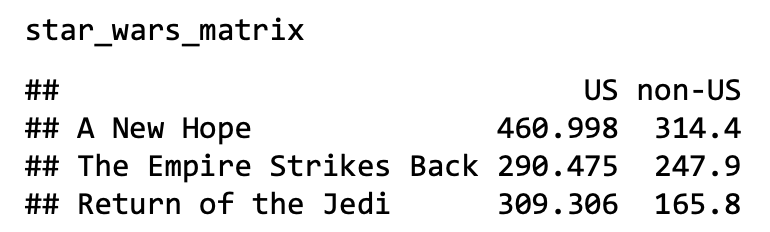
Martix
new_hope <- c(460.1, 314.4)
empire_strikes <- c(290.5, 247.9)
return_jedi <- c(310, 142.42)

star_matrix <- matrix(c(new_hope, empire_strikes, return_jedi), nrow=3, byrow = TRUE)

region <- c("US", "non-US")
titles <- c("A New Hope", "Empire Strikes Back", "Return of the Jedi")

colnames(star_matrix) <- region
rownames(star_matrix) <- titles
nrow: 행렬의 행 수를 지정
ncol: 행렬의 열 수를 지정
byrow: 데이터가 행렬에 행 단위로 입력될지 열 단위로 입력될지를 결정
- colSums, rowSums
Matrix Calculator
- matrix multiplication
A.mat %*% C.matFactor
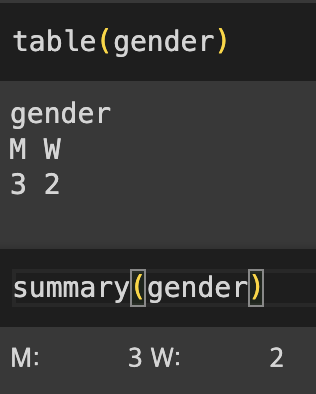
gender <- factor(c("남자", "여자", "여자", "남자", "남자"))
levels(gender) <- c('M', 'W')
gender // M W W M M- levels() : like unique func (factor type)
- summary() : numeric, factor, dataframe
Data Frame
# string type을 Factor로 불러오기
data.frame(a,b,c, ... stringAsFactors = FALSE)
apply
- apply(행렬, 방향, 함수)
# 방향 : 1 = 행, 2 = 열

apply(iris, 2, sum) -> feature 별 합- lapply(x, 함수)
# x : vector / list
# return type : list

열 단위 함수 적용- sapply(data, 함수)
# x : matrix / df
# return type : vector / matrix

열 단위 함수 적용- tapply(data, group, 함수)
# 벡터 데이터를 그룹별로 나누고 합계 계산
X <- c(1, 2, 3, 4, 5)
G <- factor(c("A", "B", "A", "B", "A"))
tapply(X, G, sum)  # 그룹 A와 B로 나눈 후 각 그룹의 합 계산 (array)
A:9 , B:6
split(data, 분리 조건)
# 접근 방식
st <- split(iris, iris$Sepal.Width>3)
nrow(st$'TRUE')
subset(data, 분리 조건)
subset(iris, select = -c(Sepal.Length, Species))
정렬
- order(x, decreasing = T) : index
- sort() : value
iris[order(iris$Sepal.Width),]aggregation()
aggregate(mtcars[,-c(2,8)], list(CYL = mtcars$cyl, VS = mtcars$vs), mean)Read CSV

-
read.csv()
-
read.table("./directory",header=TRUE, sep=",")
-
header FALSE인 경우는 첫 줄이 열 이름이 아닌 경우
-
write.table()
-
save()
null / na
- is.null()
- is.na()
NaN은 숫자형 결측값, NA는 모든 종류의 결측값
ifelse
numbers_vector <- c(1,3,4,2,6,8,7,5)

numbers_even_odd <- ifelse(numbers_vector %% 2 == 0, 'even', 'odd')

numbers_even_odd
for
cities <- c("New York", "Paris", "London", "Tokyo", "Cape Town")
for(city in cities)
{
	print(city)
}
function
diff.max.min <- function(...)
{
a <- c(...)
largest <- max(a)
smallest <- min(a)
return (largest - smallest)
}
Week 4
sample
sample(x, 10, replace = TRUE)

df[sample(1:nrow(df), nrow(df)),]
merge
# 왼쪽 데이터 프레임의 모든 행 포함
left_join <- merge(df1, df2, by = "ID", all.x = TRUE)

# 오른쪽 데이터 프레임의 모든 행 포함
right_join <- merge(df1, df2, by = "ID", all.y = TRUE)

# 양쪽 데이터 프레임의 모든 행 포함 (완전한 외부 조인)
full_join <- merge(df1, df2, by = "ID", all = TRUE)
동일한 열 묶기
# 두 데이터 프레임 예제
df1 <- data.frame(ID = c(1, 2, 3), Value1 = c(10, 20, 30))
df2 <- data.frame(ID = c(1, 2, 4), Value1 = c(100, 200, 400))

rbind(df1,df2)
which
- which.max , which.min
cut : make range-group (factor)
mtcars$wt_grp <- cut(mtcars$wt, breaks = c(0,2,4,6))

// range 포함 안 되는 부분은 NA처리
quantile
quantile(iris$Sepal.Length, probs = c(0.1, 0.5, 0.9))
// 분위수 정할 수 있음
cut quantile labeling
cut_points <- quantile(mtcars$mpg, c(0, 0.25, 0.75, 1))

mtcars$fuel_efficiency <- cut(mtcars$mpg, breaks = cut_points, include.lowest = T)

level(mtcars$fuel_efficiency)

levels(mtcars$fuel_efficiency) <- c("a", "b", "c")
paste paste0
sep
sep는 입력되는 여러 값들을 결합할 때 각 값 사이에 삽입할 구분자를 지정
기본값은 공백(" ")
paste("Hello", "world", sep = "-")를 실행하면 "Hello-world"가 출력
collapse:
collapse는 paste()에 벡터 또는 여러 값들이 입력될 때 전체 결과를 하나의 문자열로 결합하는 데 사용되는 구분자
Week 5 & 6
tidy data
-
1) 데이터셋 내의 다양한 변수(이름, 성별, 나이 등)가 열 기준으로 나열 : one feature one column
-
2) 한 변수 안에 속한 모든 값의 유형(범주/수치)이 동일 : same type
-
3) 데이터의 첫 열에 기준이 되는 칼럼명 표기 : index feature colume
gather
library(tidyr)

data <- data.frame(
  name = c("Jake", "Alice", "Tim", "Denise"),
  age = c(34, 55, 76, 19),
  brown = c(0, 0, 1, 0),
  blue = c(0, 1, 0, 0),
  other = c(1, 0, 0, 1),
  height = c("6'1\"", "5'9\"", "5'7\"", "5'1\"")
)

gather_df <- gather(data, eyecor, tf, c(brown, blue, other))
gather_df <- gather_df[which(gather_df$tf == 1),]
gather_df[,-5]
spread
spread_df <- spread(gather_df, eyecor, tf)

fill_na <- function(x)
{
  x[is.na(x)] <- 0
  return(x)
}
apply(spread_df, 2, fill_na)
sperate
seperate(data, 갈라버릴 열 name, 열 이름 벡터, sep='구분자')

separate(bmi, Country_ISO, c("Country", "ISO"))

sep을 따로 지정 안 하면, 특수문자 인식해서 알아서 갈라버림
unite
unite(data, 하나로 합쳐진 열, 합칠 열 1, 합칠 열 2 ..., sep='') check all column's means
library(dplyr)
bmi <- select_if(bmi, is.numeric)
summarise_all(bmi,mean)
date
- 306p
stringr
- str_trim() : 양 끝 띄어쓰기 제거
- str_pad() : 글자 간격 맞추기
str_pad("1234", width=8, side='left', pad =' ')
-> "    1234"
- str_detect()
str_detect(str_vector, search_keyword)

friends <- c("Sarah", "Tom", "Alice")
str_detect(friends, "Alice")
# FALSE FALSE  TRUE
- str_replace()
str_replace(friends, "Alice", "David")
# "Sarah" "Tom" "David"
find na in Dataframe
is.na(df) : 모든 요소에 대해서 na search

any(is.na(df)) : 하나라도 있는지 check
sum(is.na(df)) : na 개수 return

colSums(is.na(df)) : 열 별로 NA 개수 check

summary(df) : 한 번에 확인 가능
complete.cases(df) : na 값이 하나도 없는 행 TRUE / FALSE return
na.omit(df) : na 값이 하나도 없는 dataframe returnWeek 7 & 8