prometheus와 grafana를 이용한 DB 모니터링 구축
과제 내용
prometheus와 grafana를 이용한 DB 모니터링 구축하기
- 서버 1: DB 서버
- DB 설치
- 프로메테우스 exporter 설치 (node exporter, db exporter)
- 서버 2: 모니터링용 서버
- 프로메테우스 설치
- 그라파나 설치
- 서버 1에는 2개 이상의 db 인스턴스 띄우기
- node exporter는 서버당 한개, db exporter는 db 인스턴스별로 띄우기
- 그라파나 로그인해서 접속하면 대시보드에서 인스턴스 상태 확인할 수 있도록 구축
- alert manager 설치
- 프로메테우스 alert rules 수집
- 알람을 받아야 하는 rule 생성, 알람을 받아야 하는 이유 생각해보기
- web hook
- 두레이 웹훅 이용하여 특정 rule 도달했을 때 알람 받도록 설정
개발 환경
- NHN Cloud
- CentOS 7.9
- Docker 23.0.3
- CentOS 7 Docker Image
- MySQL 8.0.33
- Prometheus 2.44.0
- Node Exporter 1.5.0
- MySQLD Exporter 0.14.0
- Alert Manager 0.25.0
- Grafana 9.5.2
과제 1
1. DB 서버와 모니터링 서버 초기 구성
🗂 DB 서버
MySQL DB 인스턴스를 2개 이상 띄우는 방법으로 Docker Container를 사용하는 방법을 채택하였습니다.
먼저 Docker를 설치해준 후 CentOS 7 도커 이미지를 사용하여 CentOS 7 컨테이너를 2개 생성하였습니다.
docker run --privileged --name mysql-server-1 -d -p 3306:3306 -p 9104:9104 centos:7 /sbin/init
docker run --privileged --name mysql-server-2 -d -p 13306:3306 -p 9105:9104 centos:7 /sbin/init
1번 DB는 MySQL을 위해 컨테이너의 3306번 포트를 서버의 3306번 포트로 매핑, MySQLD Exporter를 위해 컨테이너의 9104번 포트를 서버의 9104 포트로 매핑해주었습니다.
2번 DB는 MySQL을 위해 컨테이너의 3306번 포트를 서버의 13306번 포트로 매핑, MySQLD Exporter를 위해 컨테이너의 9104번 포트를 서버의 9105 포트로 매핑해주었습니다.
*MySQL 기본 포트 3306, MySQLD Exporter 기본 포트 9104
두 컨테이너 모두 동일하게 8.0.33 버전의 MySQL을 설치해주었습니다.
🖥 모니터링 서버
별도의 초기 구성을 진행하지 않았습니다.
2. 모니터링 서버에 Prometheus 설치
🔥 Prometheus란?
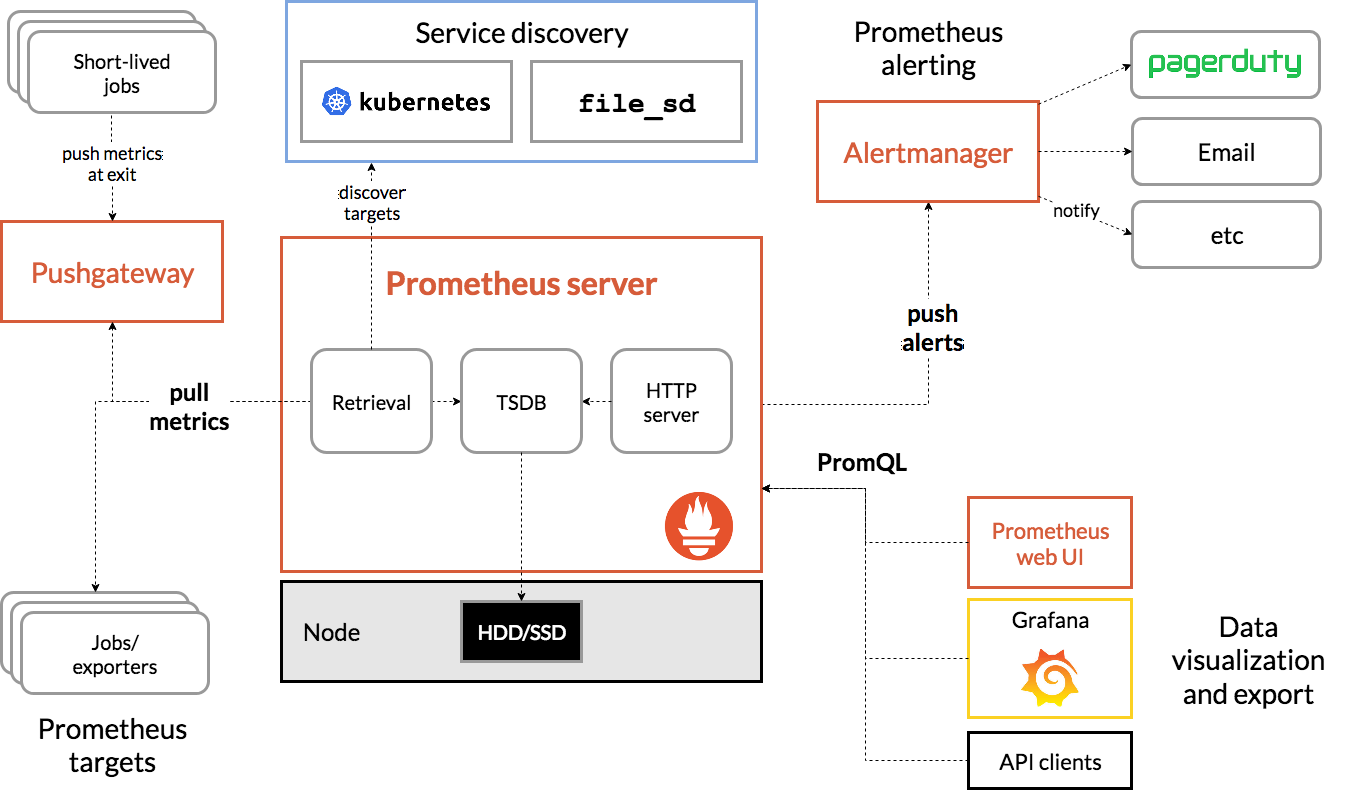
출처: https://prometheus.io/docs/introduction/overview/#architecture
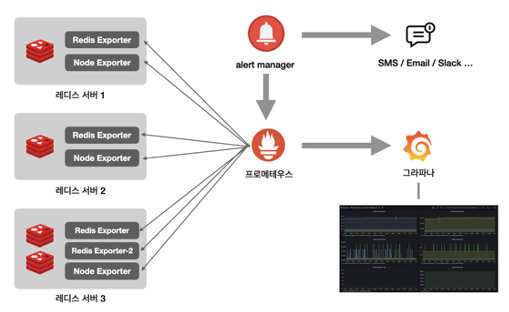
Prometheus는 오픈소스 시스템 모니터링 및 경고 툴킷입니다.
메트릭 수집, 시각화, 알림, 서비스 디스커버리 기능을 모두 가지고 있는 오픈소스 모니터링 툴으로 시계열 데이터를 수집하고 저장하는 데 사용됩니다. 값은 레이블이라는 Key-Value 쌍으로 타임스탬프와 함께 저장되어 시계열 데이터가 형상화됩니다.
수집하려는 대상 서버에 Exporter를 설치하여 Pull 방식으로 다른 곳의 데이터를 가져옵니다.
Data-Backend에서 어떤 메트릭이든지 수집할 수 있도록 구현되어 있어, 추후 새로운 Application에 대한 모니터링 수요가 발생하더라도 해당 앱에 대한 써드파티 Exporter만 설치해주면 모니터링 가능하다는 장점이 있습니다.
PromQL 쿼리 언어를 제공하여 HTTP API에서 쿼리에 맞게 시계열 데이터를 정제할 수 있다. PromQL로 대상 데이터를 조회하거나 Grafana와 연동하여 시각화해서 볼 수 있습니다.
하지만 데이터 백엔드와 저장소가 결합된 싱글 호스트 아키텍처로 HA 구성을 위한 개발은 써드 파티 앱을 통해 구성해야합니다. 또한 풀링 주기를 기반으로 메트릭을 수집하므로 풀링 순간의 스냅샷을 수집하기 때문에 수집 데이터는 근사치라는 단점이 있습니다.
Push vs. Pull
- Push
- 데이터를 가진 곳에서 필요한 곳으로 보냄
- Nagios, Zabbix 등
- 중앙 집중형으로 중앙 모니터링 시스템이 데이터 수집 항목, 수집 대상 서버를 모두 관리
- 수집 대상이 Auto-Scaling 등으로 가변적인 경우 유리
- 새로운 수집 대상 Host가 추가되어도 중앙에서는 전송된 데이터를 받기만 하면 됨
- 보안 측면에서 유리
- 중앙 폴러가 접근할 포트, IP 등에 대한 설정 및 수신 대기가 없음
- Pull
- 데이터가 필요한 곳에서 가진 곳에 접속하여 데이터를 긁어감
- Prometheus, Datadog, Collected 등
- 분산형으로 중앙시스템은 에이전트가 보내주는 데이터를 수동적으로 긁어가기만 하며, 어떤 데이터를 수집할 지 중앙에서 변경 가능
- 수집 대상의 유연성 측면에서 유리
- 중앙에서는 수동적으로 긁어가기만 하고 언제든지 새로운 데이터를 수용할 수 있도록 모든 메트릭을 요청할 수 있게 구현되어 있음
- HA 측면에서 유리
- 중앙에서 장애가 발생해도 수집 Host에 영향이 없음
Prometheus 바이너리 설치하기
Prometheus Install: https://prometheus.io/docs/introduction/first_steps/
Prometheus Download: https://prometheus.io/download/
# 현재 최신 버전 v2.44.0 (2023.05.17 기준) 다운로드
wget https://github.com/prometheus/prometheus/releases/download/v2.44.0/prometheus-2.44.0.linux-amd64.tar.gz

tar xvfz prometheus-*.tar.gz
cd prometheus-*
Prometheus 실행
- 아래의 명령어로 Prometheus를 실행할 수 있습니다.
./prometheus --config.file=prometheus.yml- 백그라운드로 Prometheus를 실행하기 위해 서비스 파일을 생성하였습니다.
prometheus.service서비스 파일 생성
sudo vi /etc/systemd/system/prometheus.service[Unit]
Description=Prometheus Server
Wants=network-online.target
After=network-online.target
[Service]
User=root
Group=root
Type=simple
ExecStart=/home/centos/prometheus-2.44.0.linux-amd64/prometheus --config.file=/home/centos/prometheus-2.44.0.linux-amd64/prometheus.yml
[Install]
WantedBy=multi-user.target- 백그라운드 서비스 등록
sudo systemctl daemon-reload
sudo systemctl enable prometheus.service
sudo systemctl start prometheus.service
sudo systemctl restart prometheus.service
sudo systemctl status prometheus.service
systemd service 변경시 systemctl daemon-reload 명령어로 수정사항 반영 필요
config 파일을 수정했다면 systemctl restart prometheus.service 명령어로 재시작하기
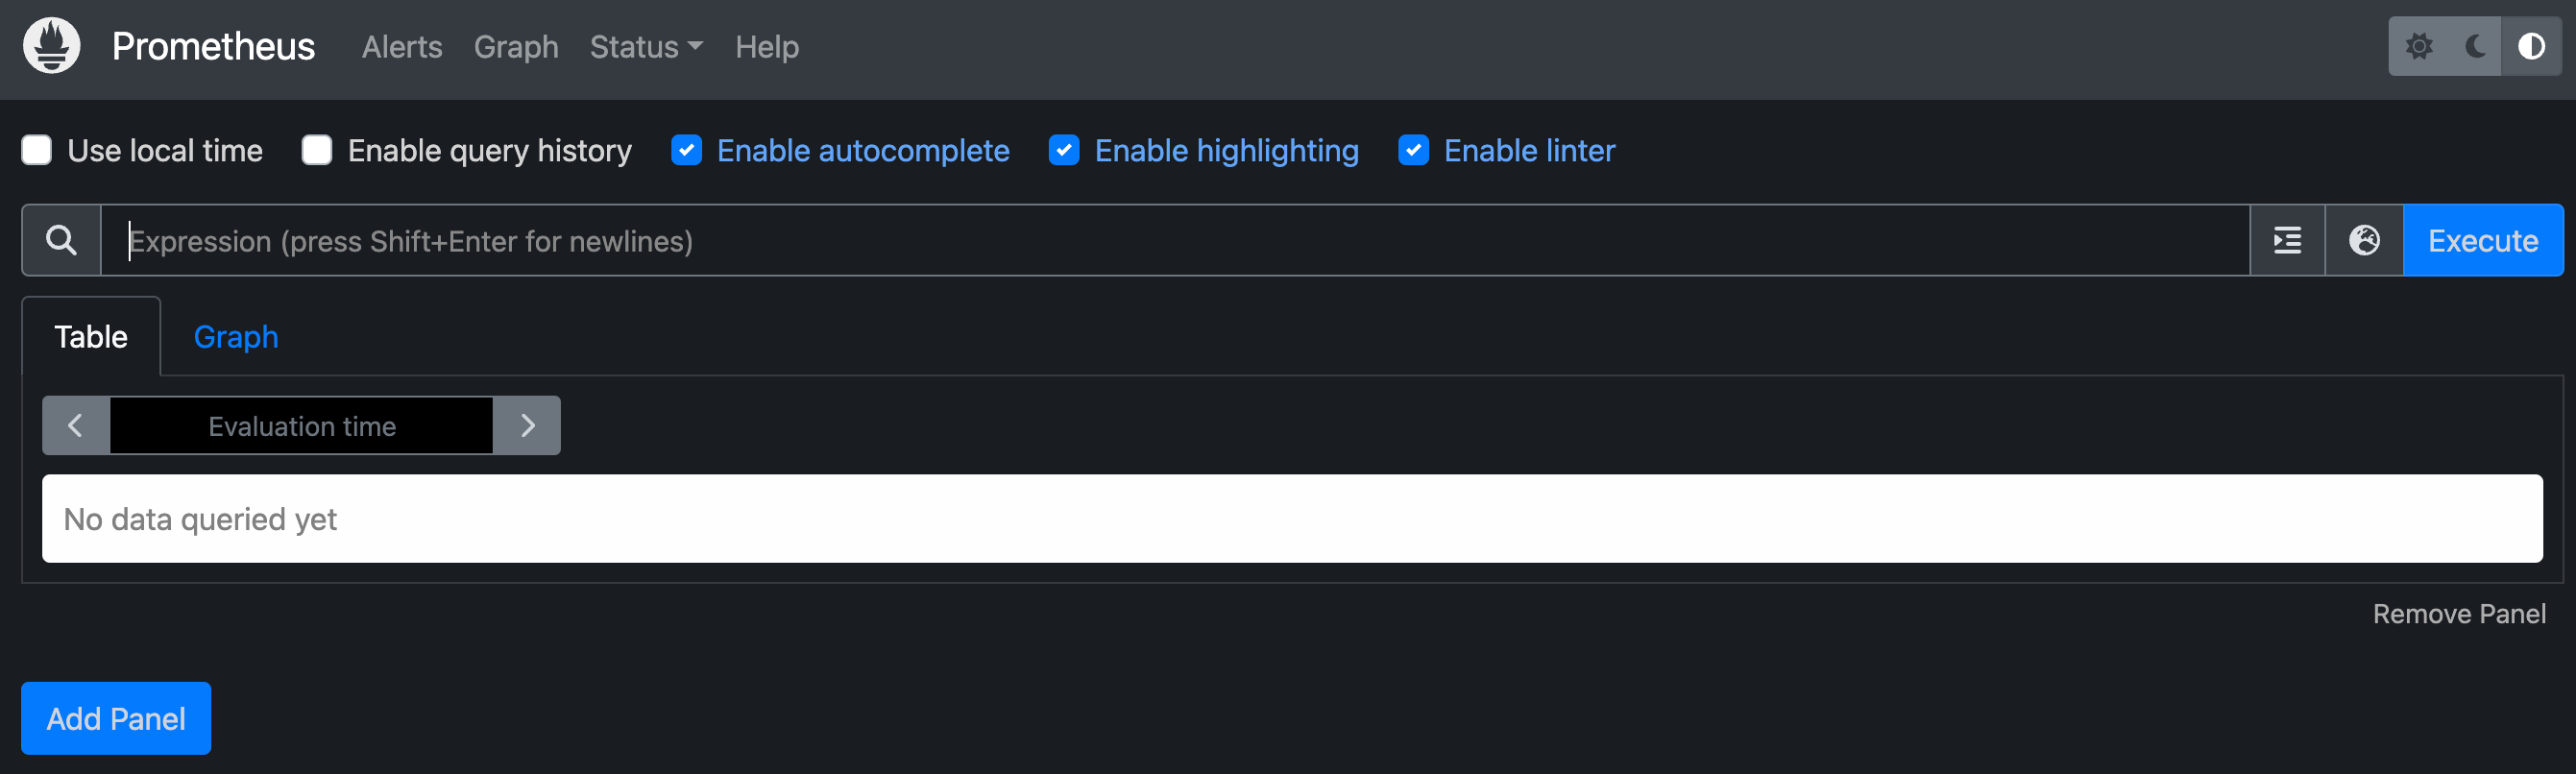
Prometheus WEB UI 접속
- Prometheus의 기본 포트인 9090 포트로 접속하여 Prometheus의 WEB UI가 잘 실행되는 것을 확인할 수 있습니다.
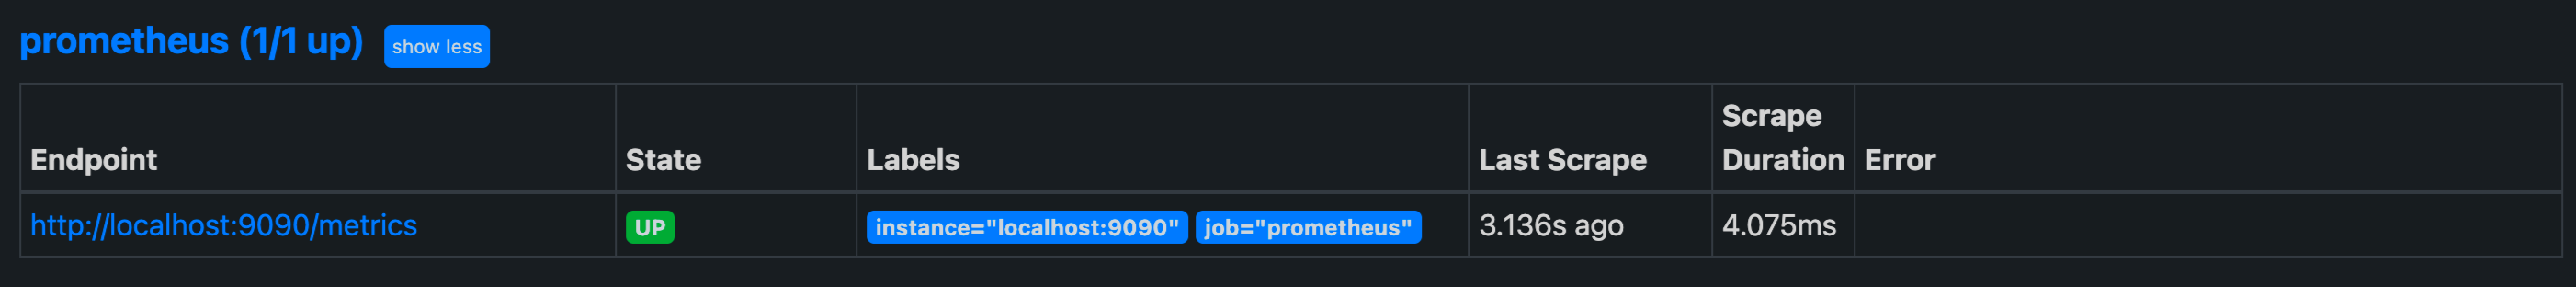
- target 탭에서 Prometheus 자신의 상태 정보를 받아오는 것을 확인할 수 있습니다.
3. 서버 별로 Node Exporter 설치
📤 Exporter란?
모니터링 에이전트로 타겟 시스템에서 메트릭을 읽어서, Prometheus에서 Pull 방식으로 모니터링 대상 서버의 데이터를 가져갈 수 있도록 시계열 데이터를 제공하는 역할을 합니다.
HTTP GET으로 메트릭을 텍스트 형태로 프로메테우스에 반환하며 히스토리 저장의 기능은 없습니다.
그 중 Node Exporter는 필요한 모니터링 정보 중에 node의 cpu, memory 등의 정보를 노출합니다.
Node Exporter 바이너리 설치
Node Exporter Download: https://prometheus.io/download/#node_exporter
# 현재 최신 버전 v1.5.0 (2023.05.17 기준) 다운로드
wget https://github.com/prometheus/node_exporter/releases/download/v1.5.0/node_exporter-1.5.0.linux-amd64.tar.gz

# 압축 풀기
tar xzvf node_exporter-1.5.0.linux-amd64.tar.gz
cd node_exporter-1.5.0.linux-amd64

# Node Exporter 실행
./node_exporter
백그라운드로 Node Exporter 실행
- 백그라운드로 Node Exporter를 실행하기 위해
node_exporter.service서비스 파일을 생성합니다.
sudo vi /etc/systemd/system/node_exporter.service[Unit]
Description=Node Exporter
Wants=network-online.target
After=network-online.target
[Service]
User=root
Group=root
Type=simple
ExecStart=/home/centos/node_exporter-1.5.0.linux-amd64/node_exporter
[Install]
WantedBy=multi-user.target- 백그라운드 서비스 등록
sudo systemctl daemon-reload
sudo systemctl enable node_exporter.service
sudo systemctl start node_exporter.service
sudo systemctl restart node_exporter.service
sudo systemctl status node_exporter.service
Node Exporter 실행 확인
- Node Exporter의 기본 포트인 9100 포트로 접속하여 잘 실행되고 있는 것을 확인할 수 있습니다.
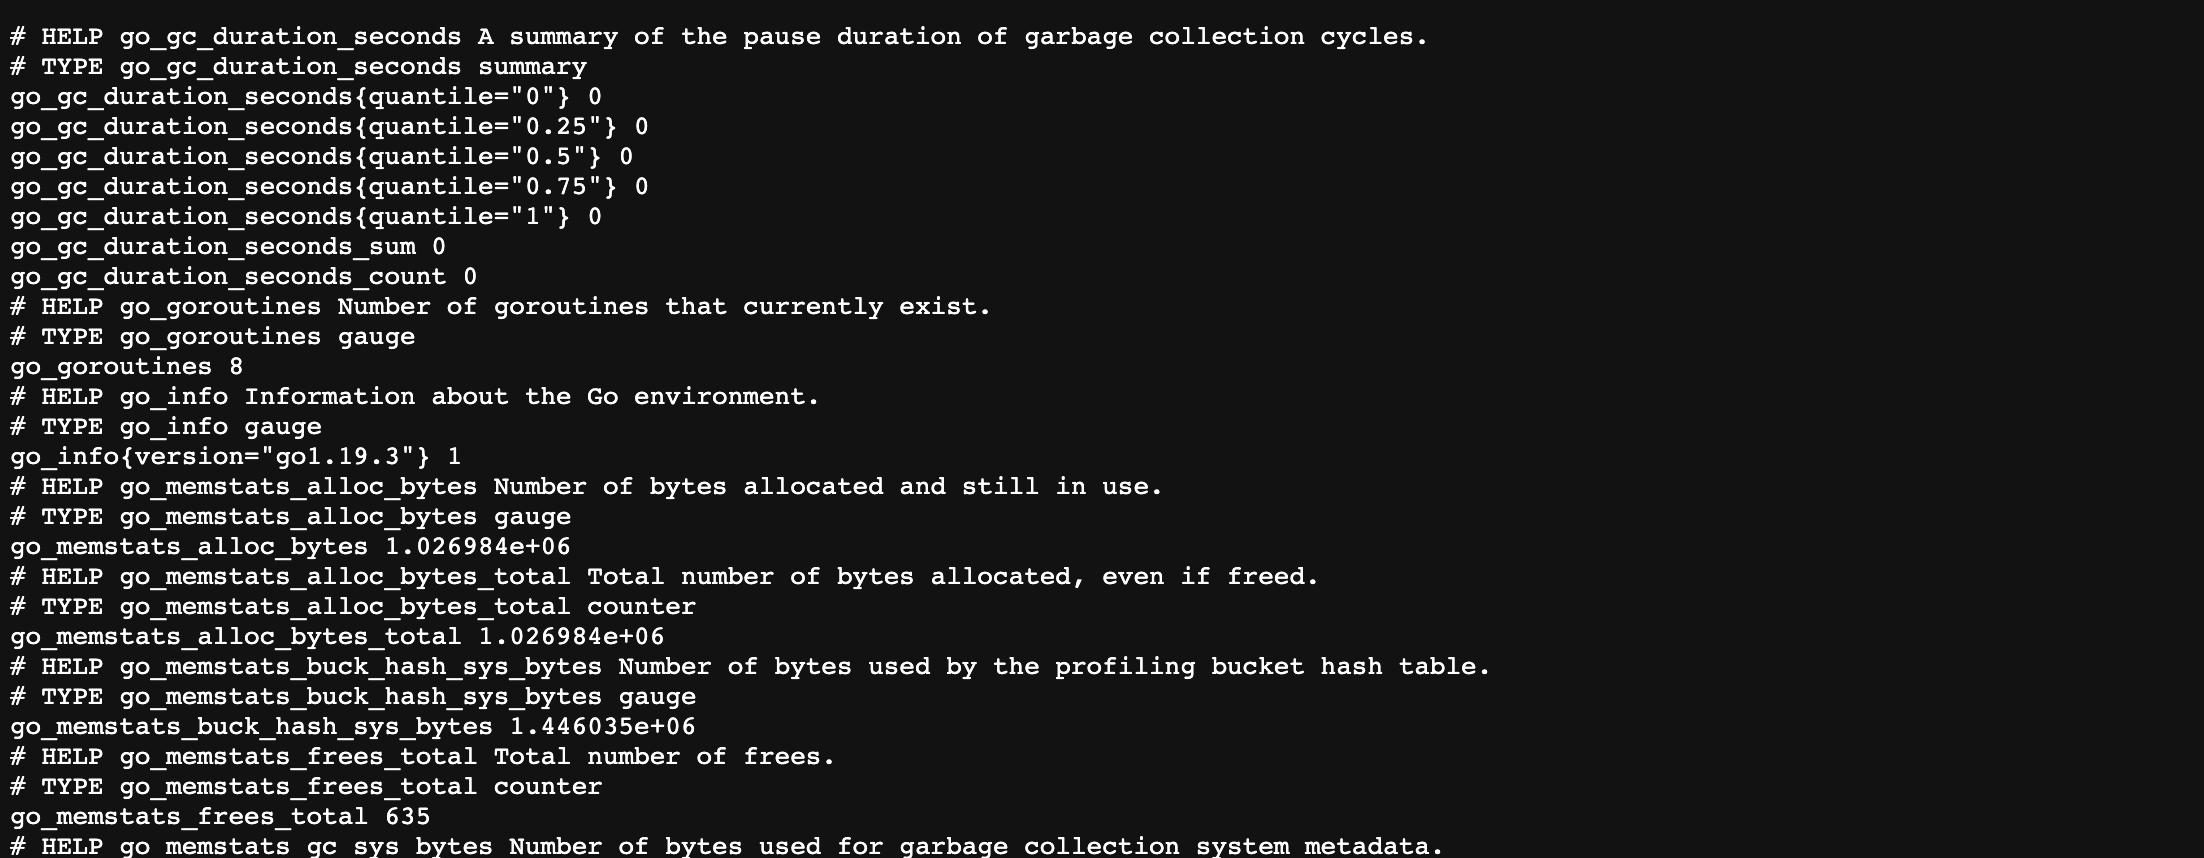
Metrics로 접속하면 Node Exporter가 수집하는 매트릭에 관한 정보를 확인할 수 있습니다.
Prometheus 서버 yaml 설정 파일 수정
- Prometheus가 Node Exporter의 metrics HTTP endpoint에 접근할 수 있도록 Prometheus가 설치된 서버에서 아래와 같이
prometheus.yaml파일 내용을 추가합니다.
scrape_configs:
  - job_name: "node-exporter"
    static_configs:
- targets: ["133.186.144.9:9100"]- 변경 내용을 적용하기 위해 Prometheus를 재시작해줍니다.
sudo systemctl restart prometheus.service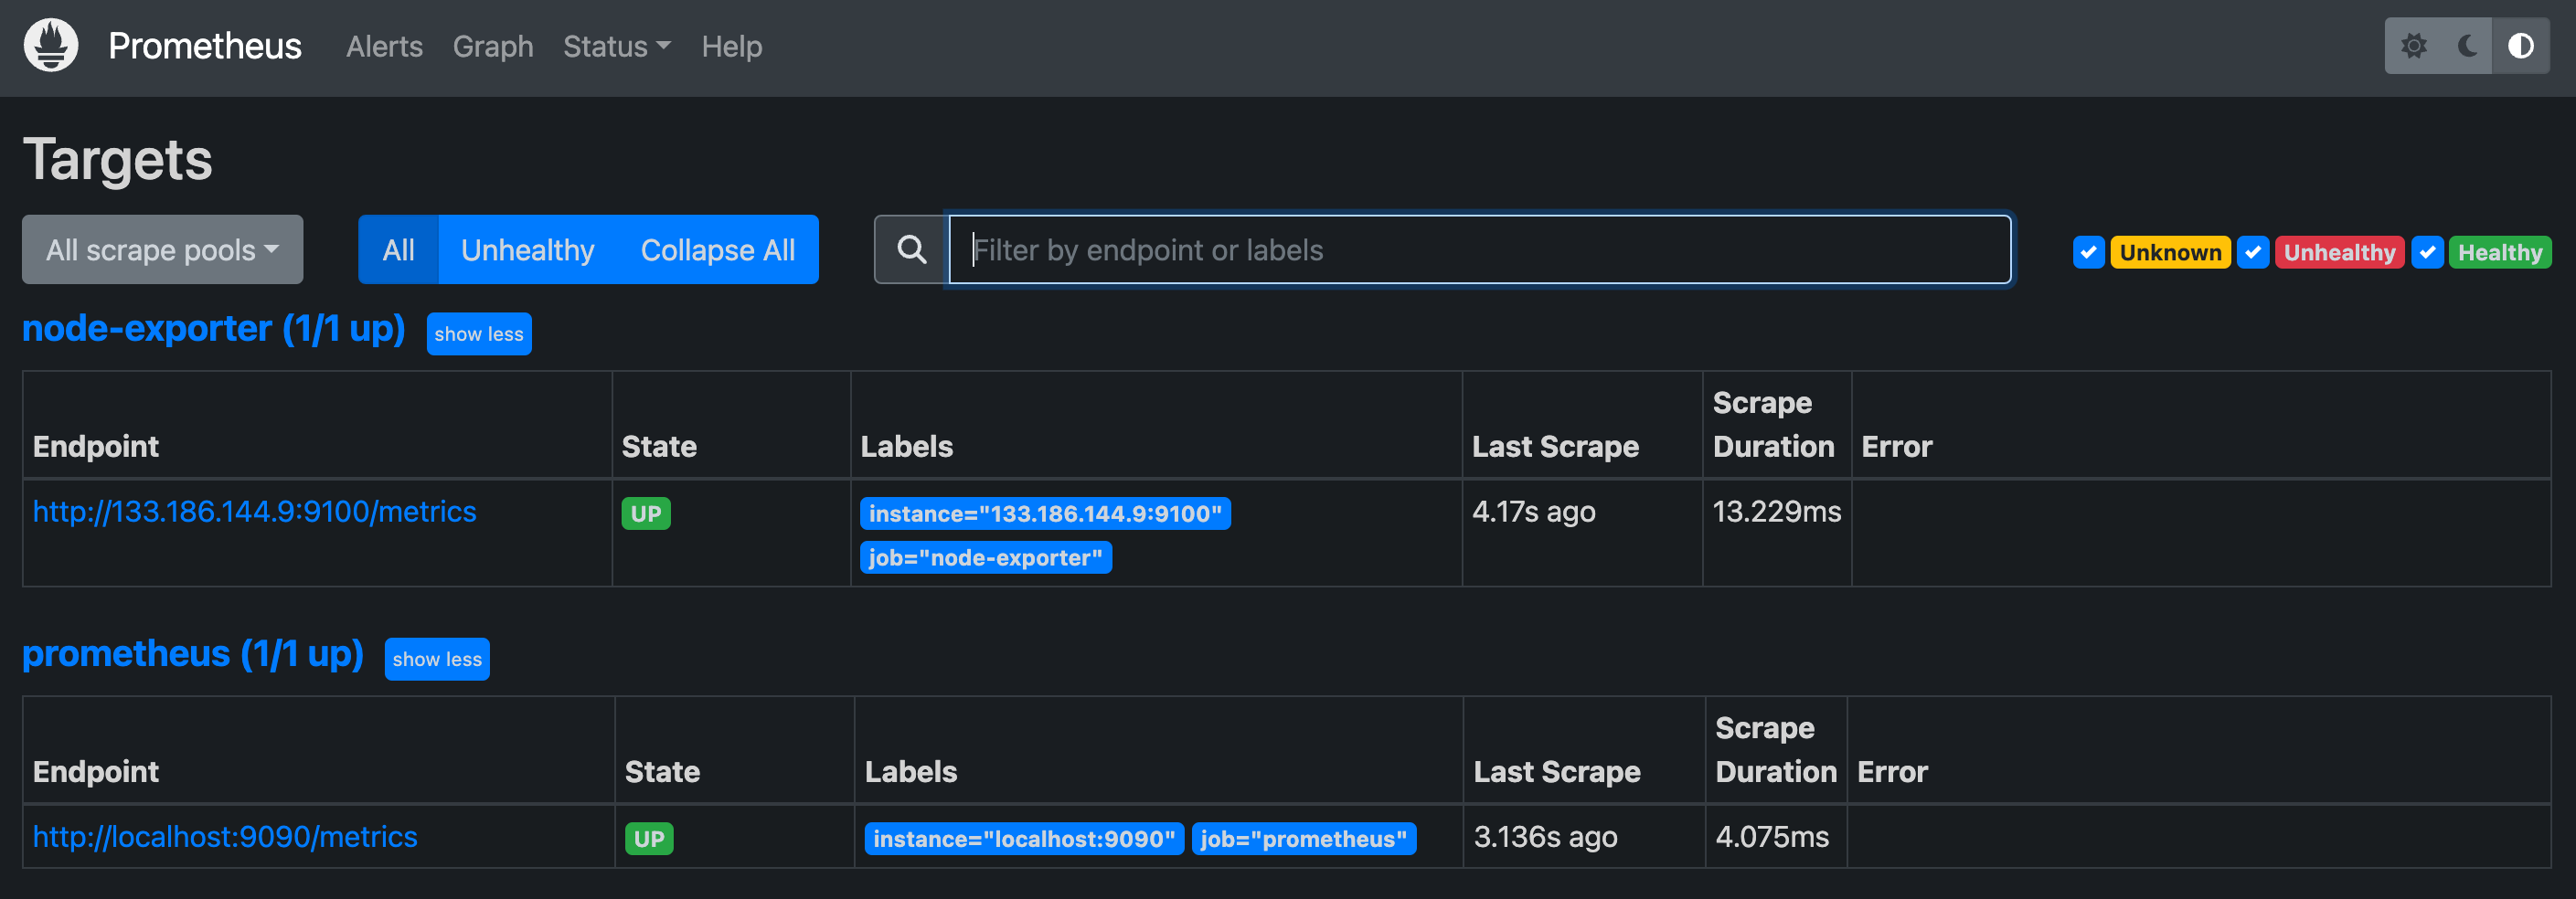
sudo systemctl status prometheus.service- Prometheus WEB UI에 접속하면, target에 Node Exporter가 정상적으로 추가된 것을 확인할 수 있습니다.
4. DB 인스턴스 별로 MySQLD Exporter 설치
MySQLD Exporter 바이너리 설치
MySQLD Exporter Download: https://prometheus.io/download/#mysqld_exporter
# 현재 최신 버전 v0.14.0 (2023.05.17 기준) 다운로드
wget https://github.com/prometheus/mysqld_exporter/releases/download/v0.14.0/mysqld_exporter-0.14.0.linux-amd64.tar.gz

tar xzvf mysqld_exporter-0.14.0.linux-amd64.tar.gz
cd mysqld_exporter-0.14.0.linux-amd64
MySQL에 권한 추가
- MySQLD Exporter가 MySQL 서버에서 정보를 읽을 수 있도록 권한을 추가해줍니다.
CREATE USER 'exporter'@'localhost' IDENTIFIED BY 'exporter_password' WITH MAX_USER_CONNECTIONS 2;
GRANT PROCESS, REPLICATION CLIENT, SELECT ON *.* TO 'exporter'@'localhost';
FLUSH PRIVILEGES;
EXIT;
MySQLD Exporter에 설정 추가
- MySQL 서버에 추가해준 권한을 MySQLD Exporter 설정 파일에 추가해줍니다.
vi mysqld_exporter.cnf[client]
user=exporter
password=exporter_password백그라운드로 MySQLD Exporter 실행
- 백그라운드로 MySQLD Exporter를 실행하기 위해
mysqld_exporter.service서비스 파일을 생성합니다.
sudo vi /etc/systemd/system/mysqld_exporter.service[Unit]
Description=MySQL Exporter
Wants=network-online.target
After=network-online.target
[Service]
[Service]
User=root
Group=root
Type=simple
Restart=always
ExecStart=/home/centos/mysqld_exporter-0.14.0.linux-amd64/mysqld_exporter \
--config.my-cnf /home/centos/mysqld_exporter-0.14.0.linux-amd64/mysqld_exporter.cnf \
--collect.global_status \
--collect.info_schema.innodb_metrics \
--collect.auto_increment.columns \
--collect.info_schema.processlist \
--collect.binlog_size \
--collect.info_schema.tablestats \
--collect.global_variables \
--collect.info_schema.query_response_time \
--collect.info_schema.userstats \
--collect.info_schema.tables \
--collect.perf_schema.tablelocks \
--collect.perf_schema.file_events \
--collect.perf_schema.eventswaits \
--collect.perf_schema.indexiowaits \
--collect.perf_schema.tableiowaits \
--collect.slave_status \
--web.listen-address=0.0.0.0:9104
[Install]
WantedBy=multi-user.target- 백그라운드 서비스 등록
systemctl daemon-reload
systemctl start mysqld_exporter
systemctl enable mysqld_exporter
systemctl restart mysqld_exporter
systemctl status mysqld_exporter
MySQLD Exporter 실행 확인
- MySQLD Exporter의 기본 포트인 9104 포트로 접속하여 잘 실행되고 있는 것을 확인할 수 있습니다.
- 앞선 설정에서 DB 1번은 서버의 9104 포트, DB 2번은 9105 포트로 매핑되어 있습니다.

Metrics로 접속하여 MySQLD Exporter가 수집하는 매트릭에 관한 정보를 확인할 수 있습니다.

Prometheus 서버 yaml 설정 파일 수정
- Prometheus가 설치된 서버에서 MySQLD Exporter의 metrics HTTP endpoint에 접근할 수 있도록 아래와 같이
prometheus.yaml파일에 내용을 추가합니다.- targets에 DB 1번과 2번 모두 추가해줍니다.
scrape_configs:
  - job_name: "mysqld-exporter"
    static_configs:
- targets: ["133.186.144.9:9104", "133.186.144.9:9105"]- 변경 내용을 적용하기 위해 Prometheus를 재시작해줍니다.
sudo systemctl restart prometheus.service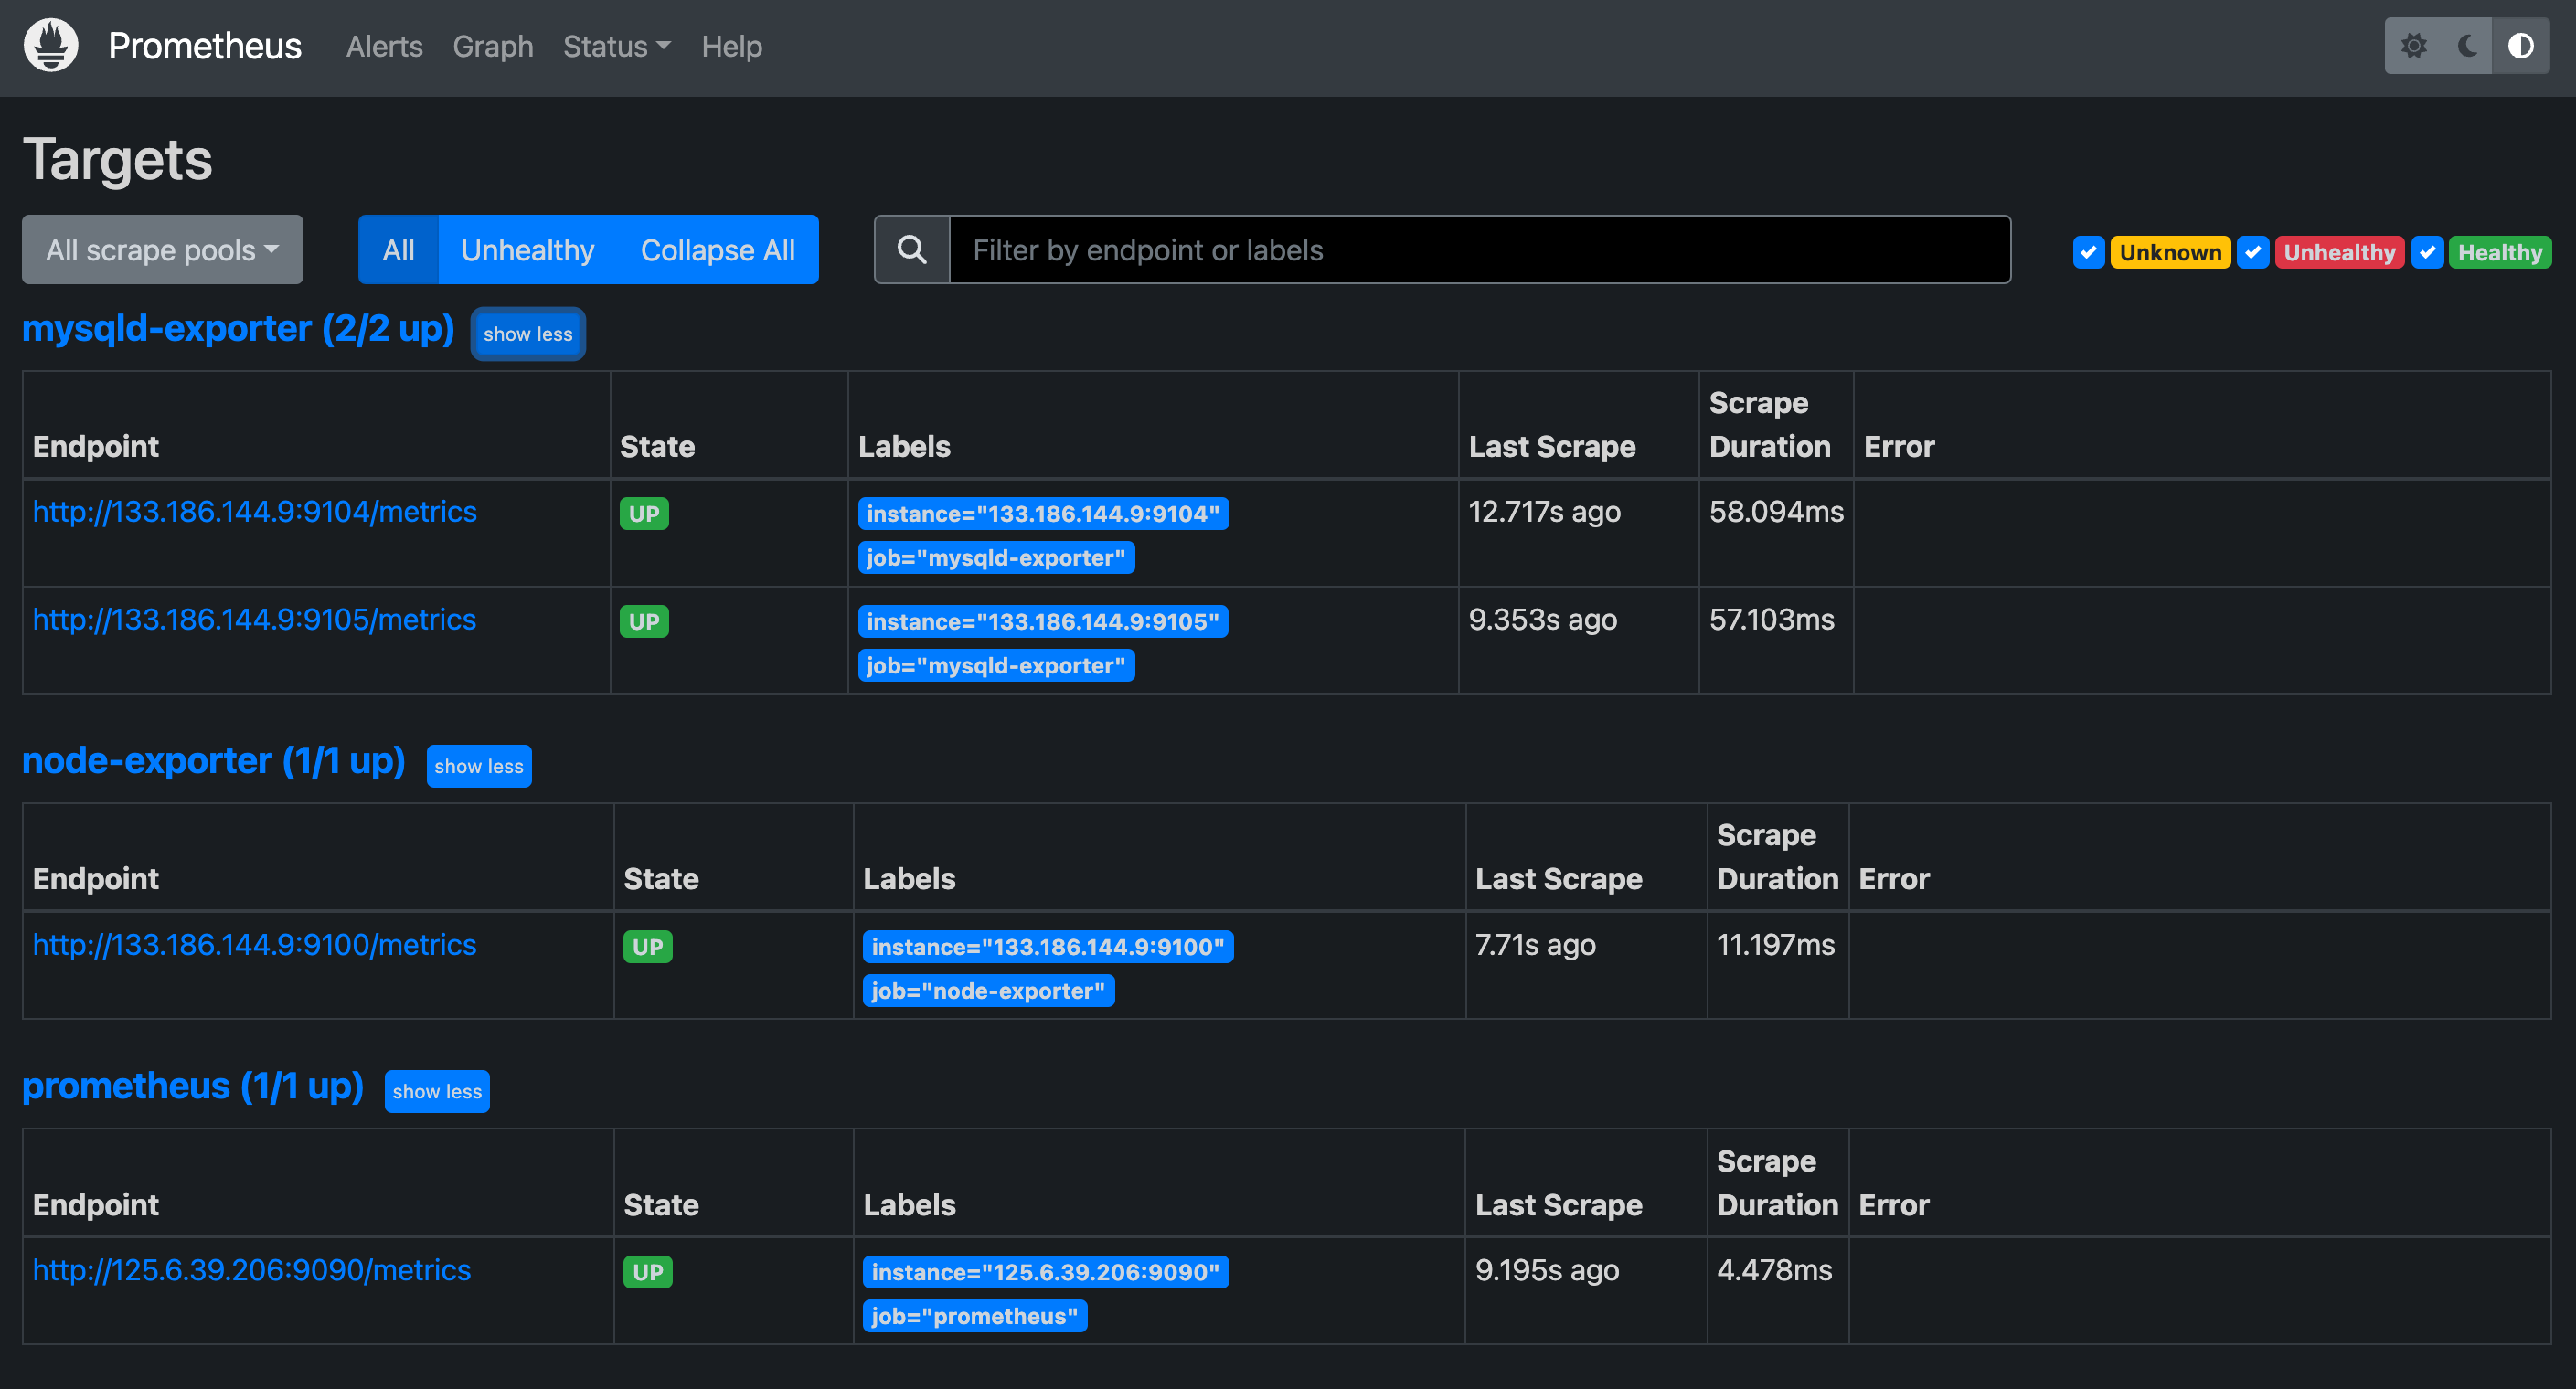
sudo systemctl status prometheus.service- Prometheus WEB UI에 접속하면, target에 MySQLD Exporter가 정상적으로 추가된 것을 확인할 수 있습니다.
5. 모니터링 서버에 Grafana 설치 및 대시보드 구축
🌀 Grafana란?
프로메테우스가 메트릭의 정보를 가져오는 모니터링 툴이었다면, 그라파나는 가져온 메트릭 정보를 시각화 해주는 오픈소스 도구입니다.
Graphite, Prometheus, InfluxDB등 다양한 데이터베이스와 메트릭수집 시스템을 지원합니다. 하나의 대시보드에 여러 메트릭 시스템들의 지표를 표시할 수 있으며, notification 기능을 이용하여 슬랙, 이메일, 라인 등 웹훅을 연동할 수 있습니다.
yum을 사용하여 Grafana 설치
Grafana Install: https://grafana.com/docs/grafana/latest/setup-grafana/installation/debian/
Grafana Download: https://grafana.com/grafana/download
# 현재 최신 버전 v9.5.2 (2023.05.17 기준) 다운로드
sudo yum install -y https://dl.grafana.com/enterprise/release/grafana-enterprise-9.5.2-1.x86_64.rpm
백그라운드로 Grafana 실행
- Grafana에서 제공하는 서비스파일로 Grafana를 백그라운드로 실행합니다.
systemctl start grafana-server.service
systemctl enable grafana-server.service
systemctl stop grafana-server.service
systemctl restart grafana-server.service
netstat -ntap | grep LISTEN | grep 3000- Grafana가 정상적으로 실행되었다면,
<IP주소>:3000/login에 접속하여 로그인 후 Web UI를 볼 수 있습니다.- 기본 로그인 정보: admin / admin
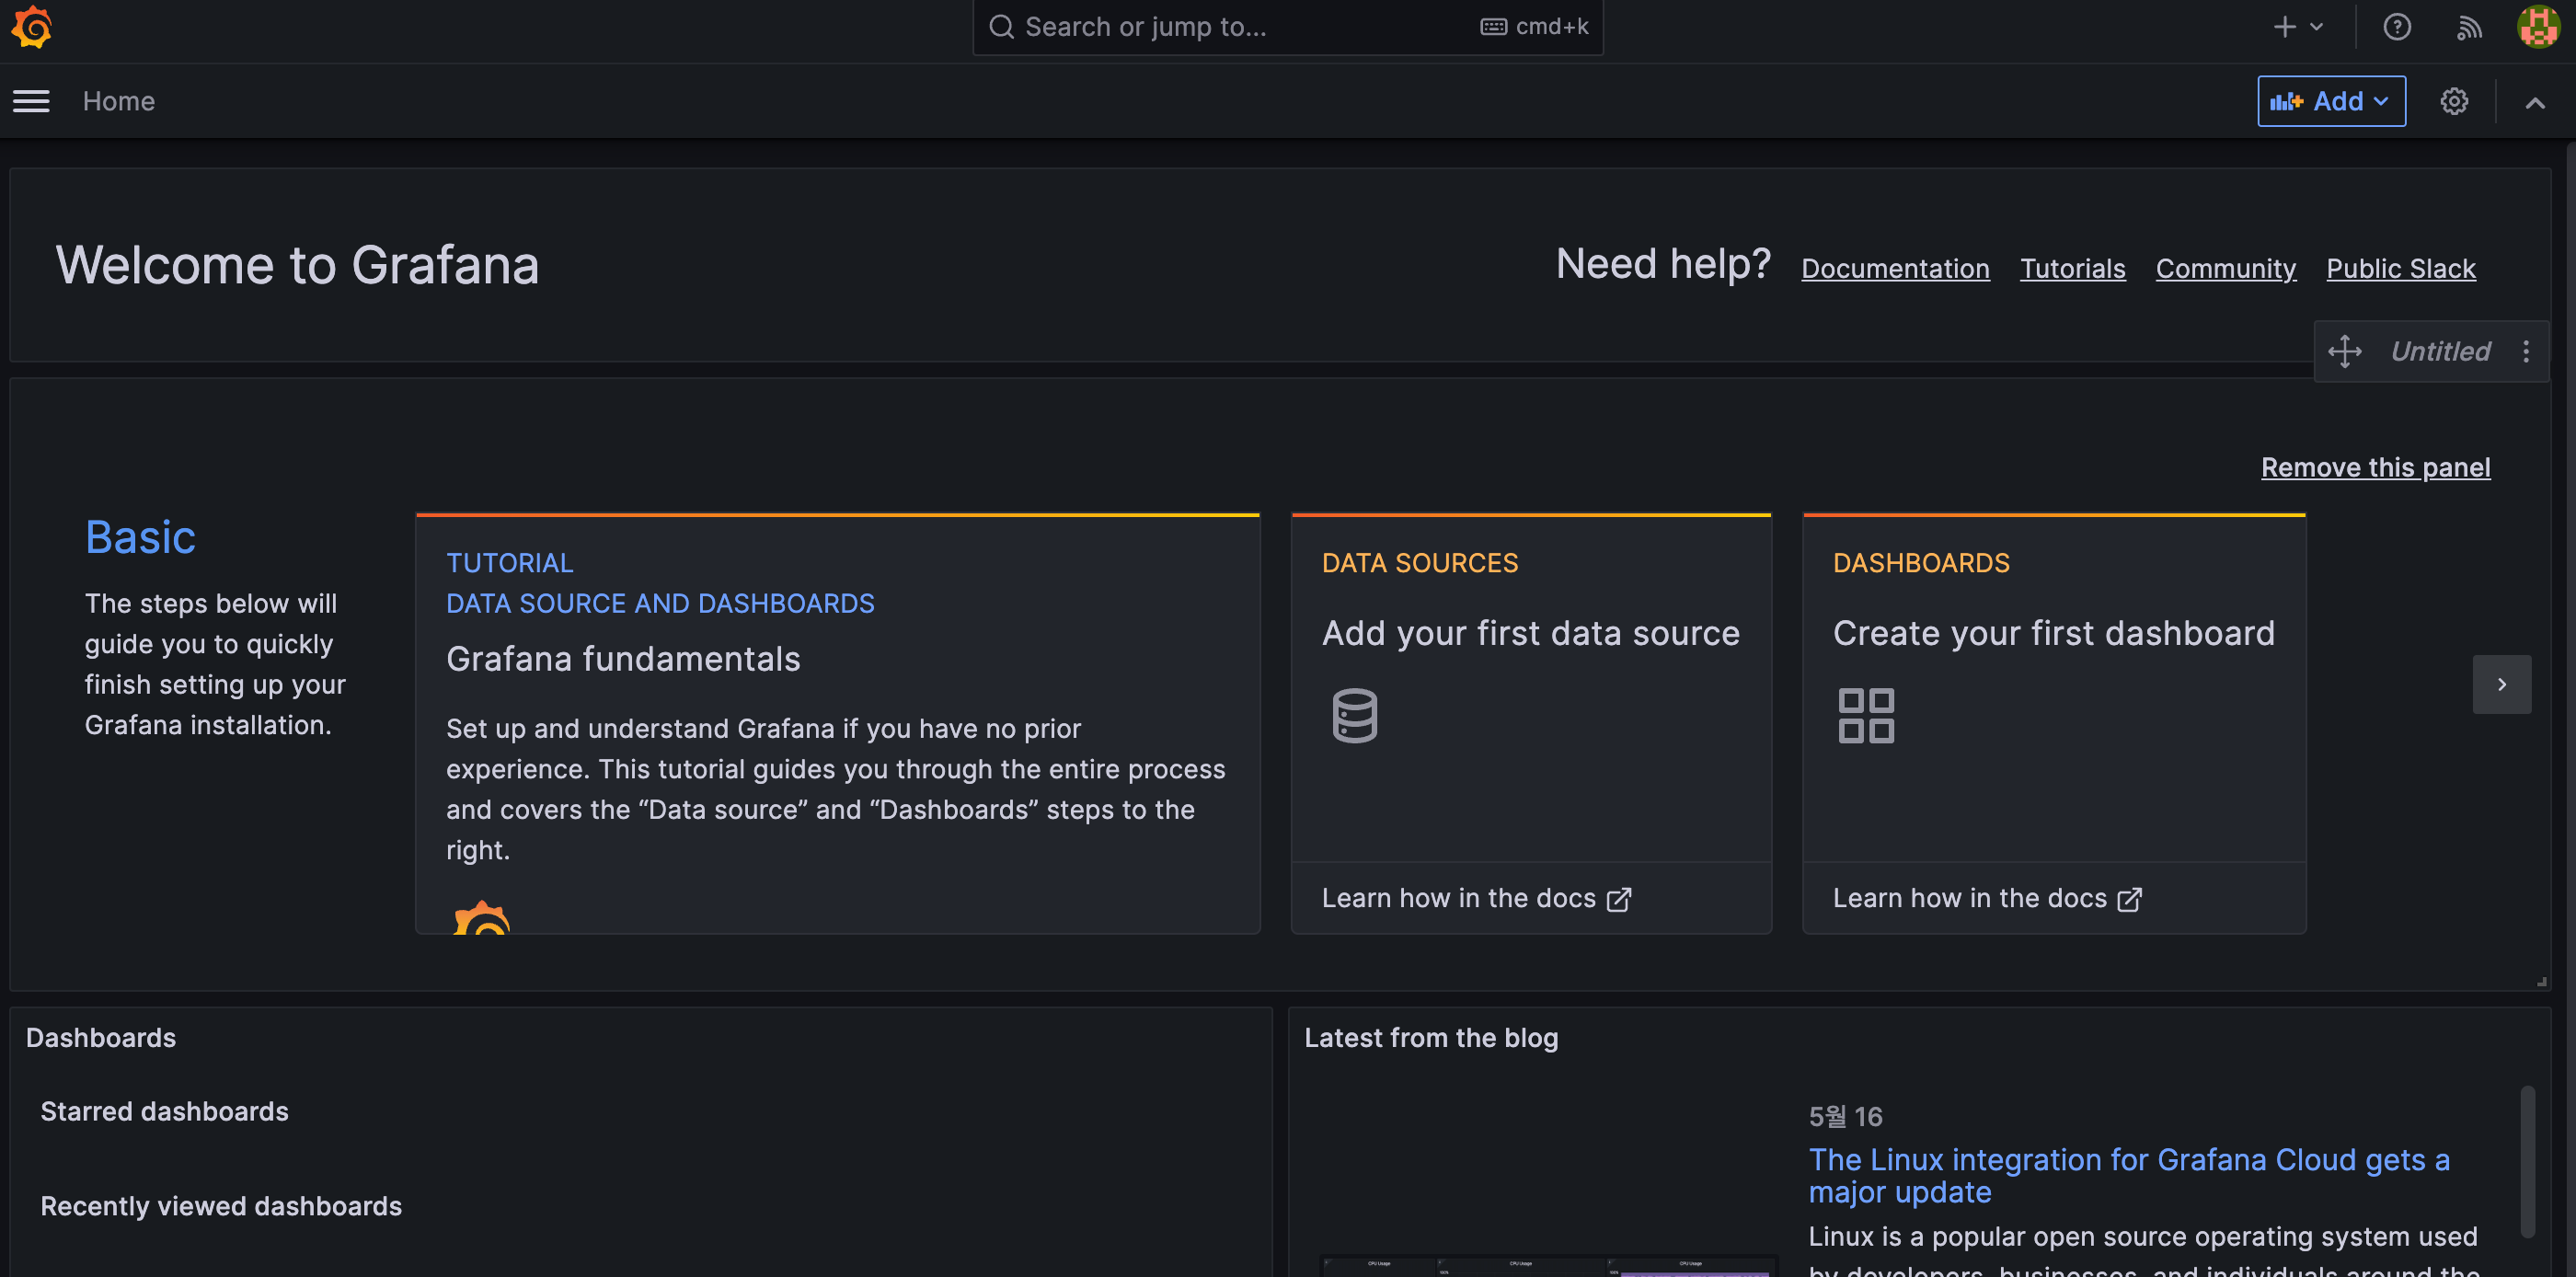
Prometheus와 연동
- Connect data를 눌러 프로메테우스와 연동합니다.
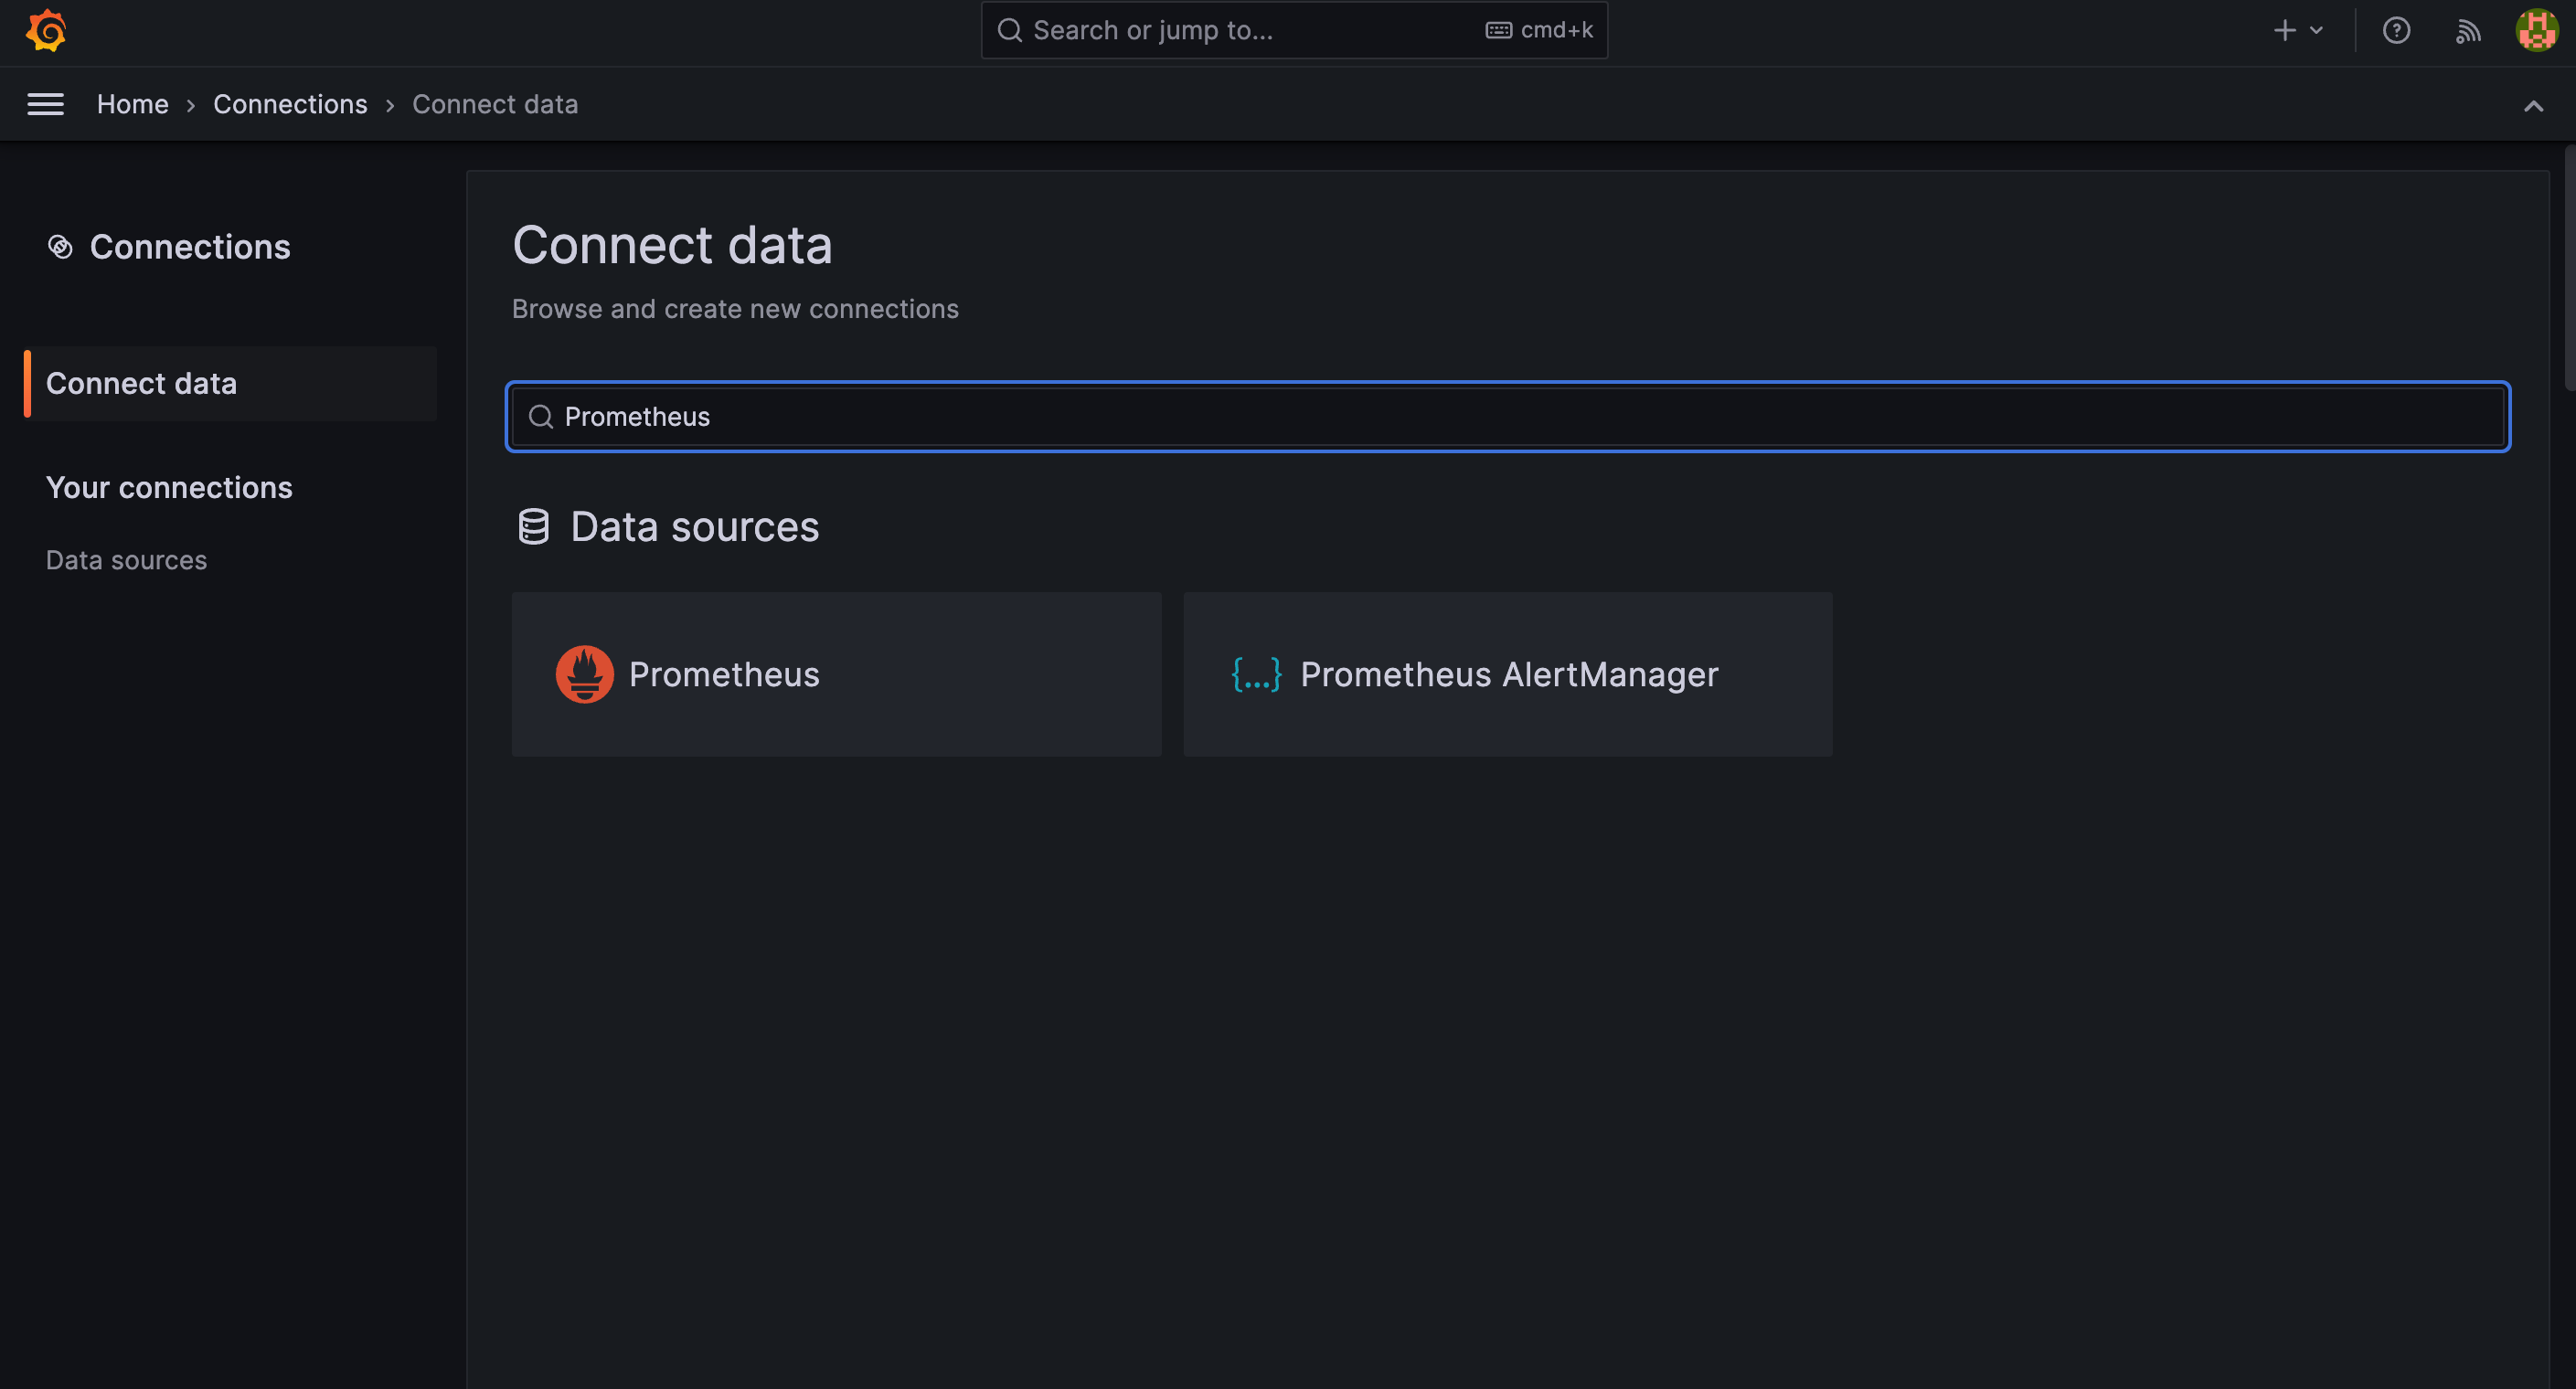
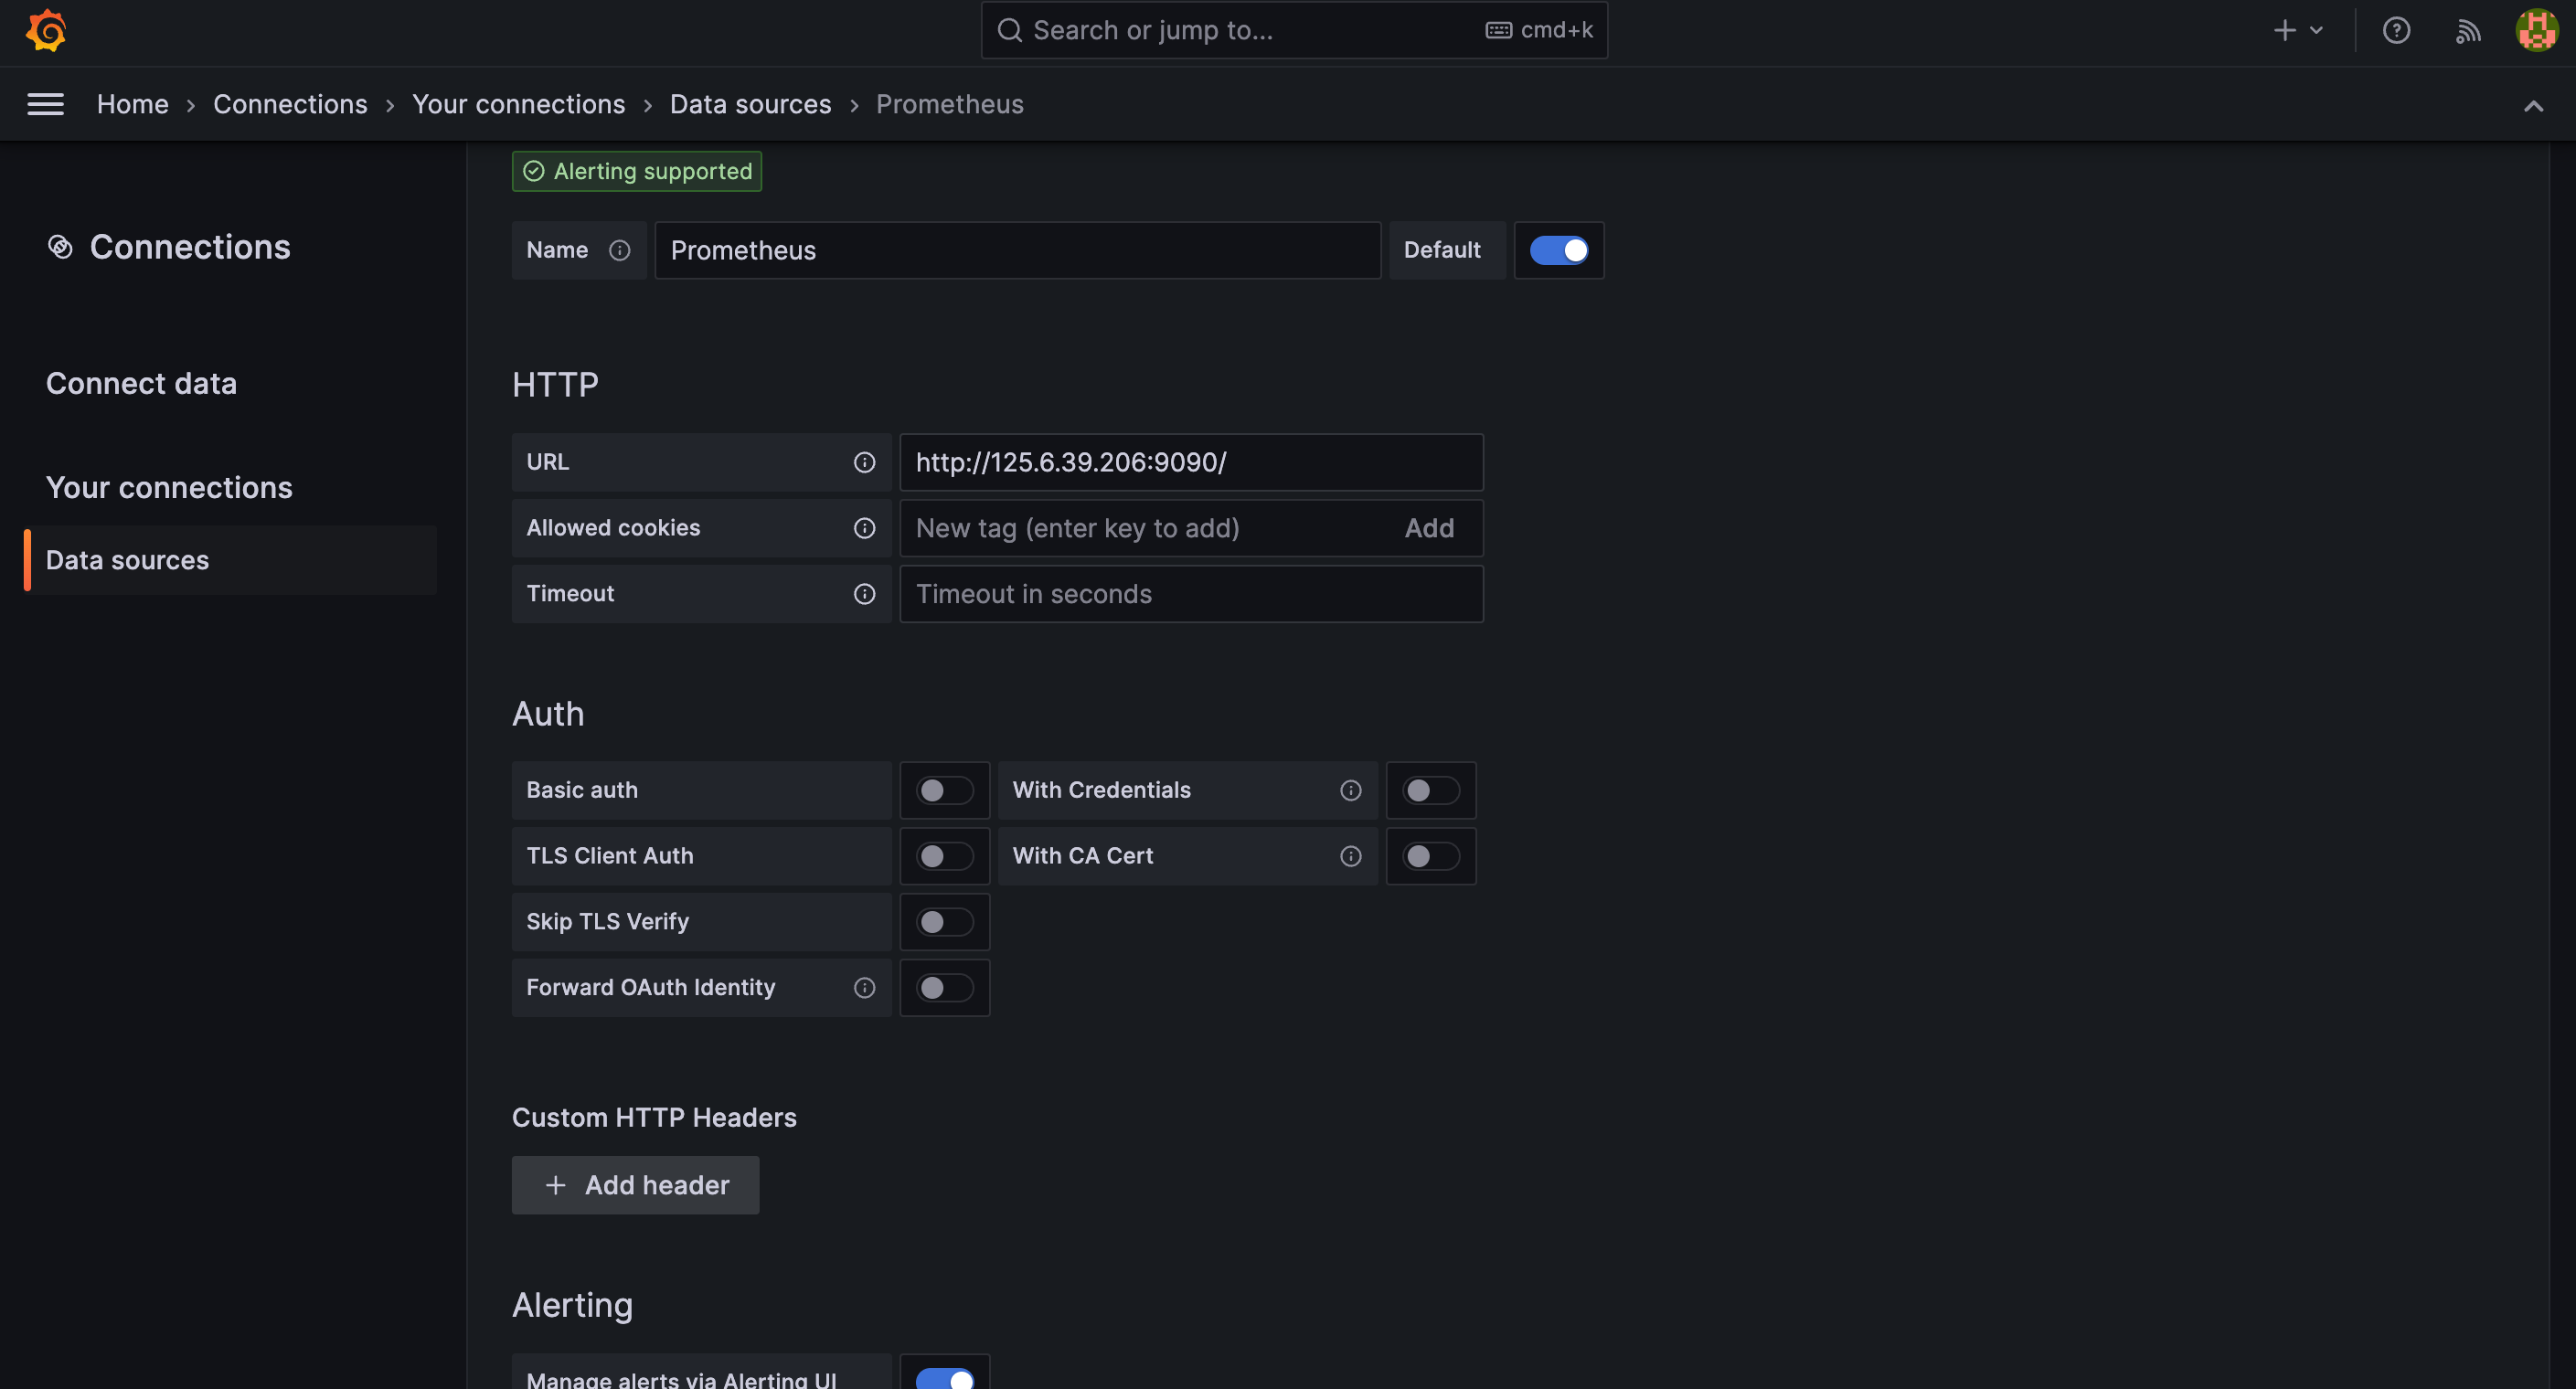
- 프로메테우스가 설치된 서버의 URL을 입력하고 연동합니다. (Save&Test 클릭)
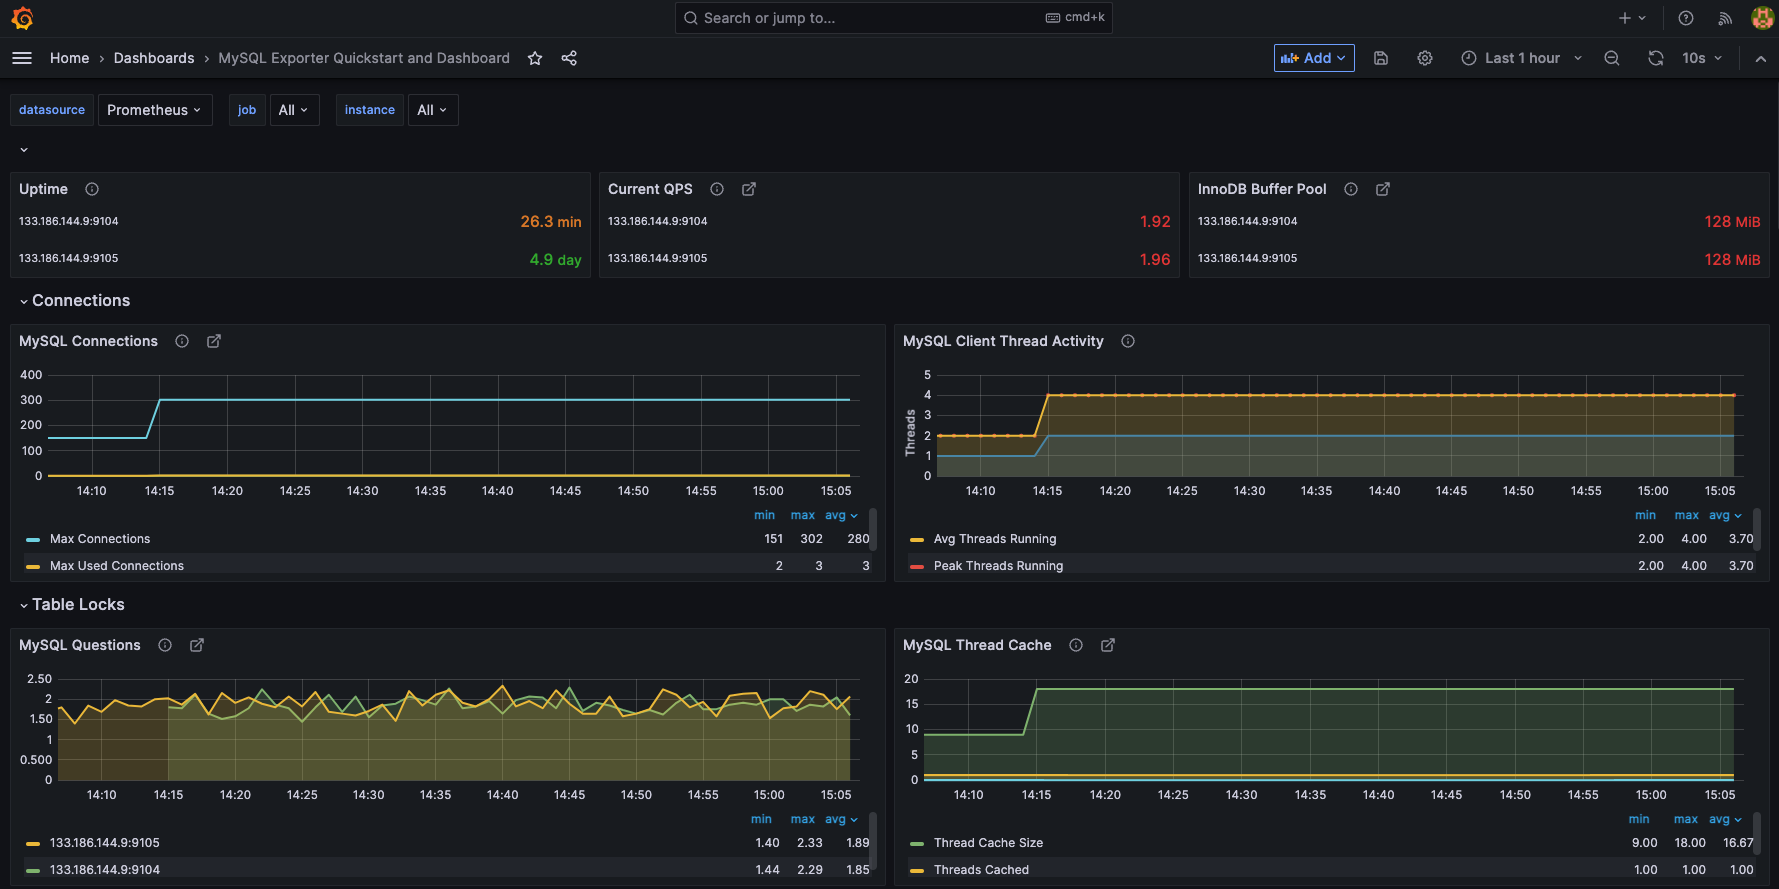
Dashboard 구성
- Grafana에서 기본 제공하는 MySQL 대시보드를 Import 합니다.
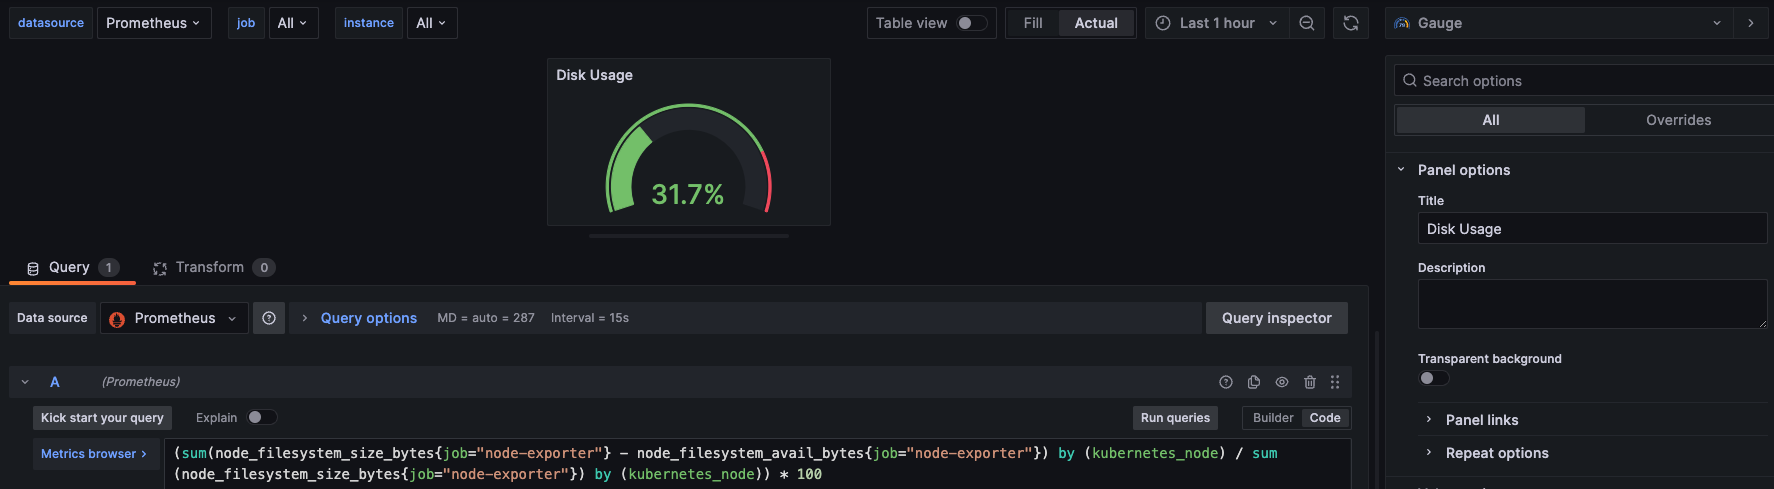
- 추가로 수집할 메트릭 조회 쿼리를 작성합니다.
- ex) 디스크 사용량 조회
(sum(node_filesystem_size_bytes{job="node-exporter"} - node_filesystem_avail_bytes{job="node-exporter"}) / sum(node_filesystem_size_bytes{job="node-exporter"})) * 100
- ex) 디스크 사용량 조회
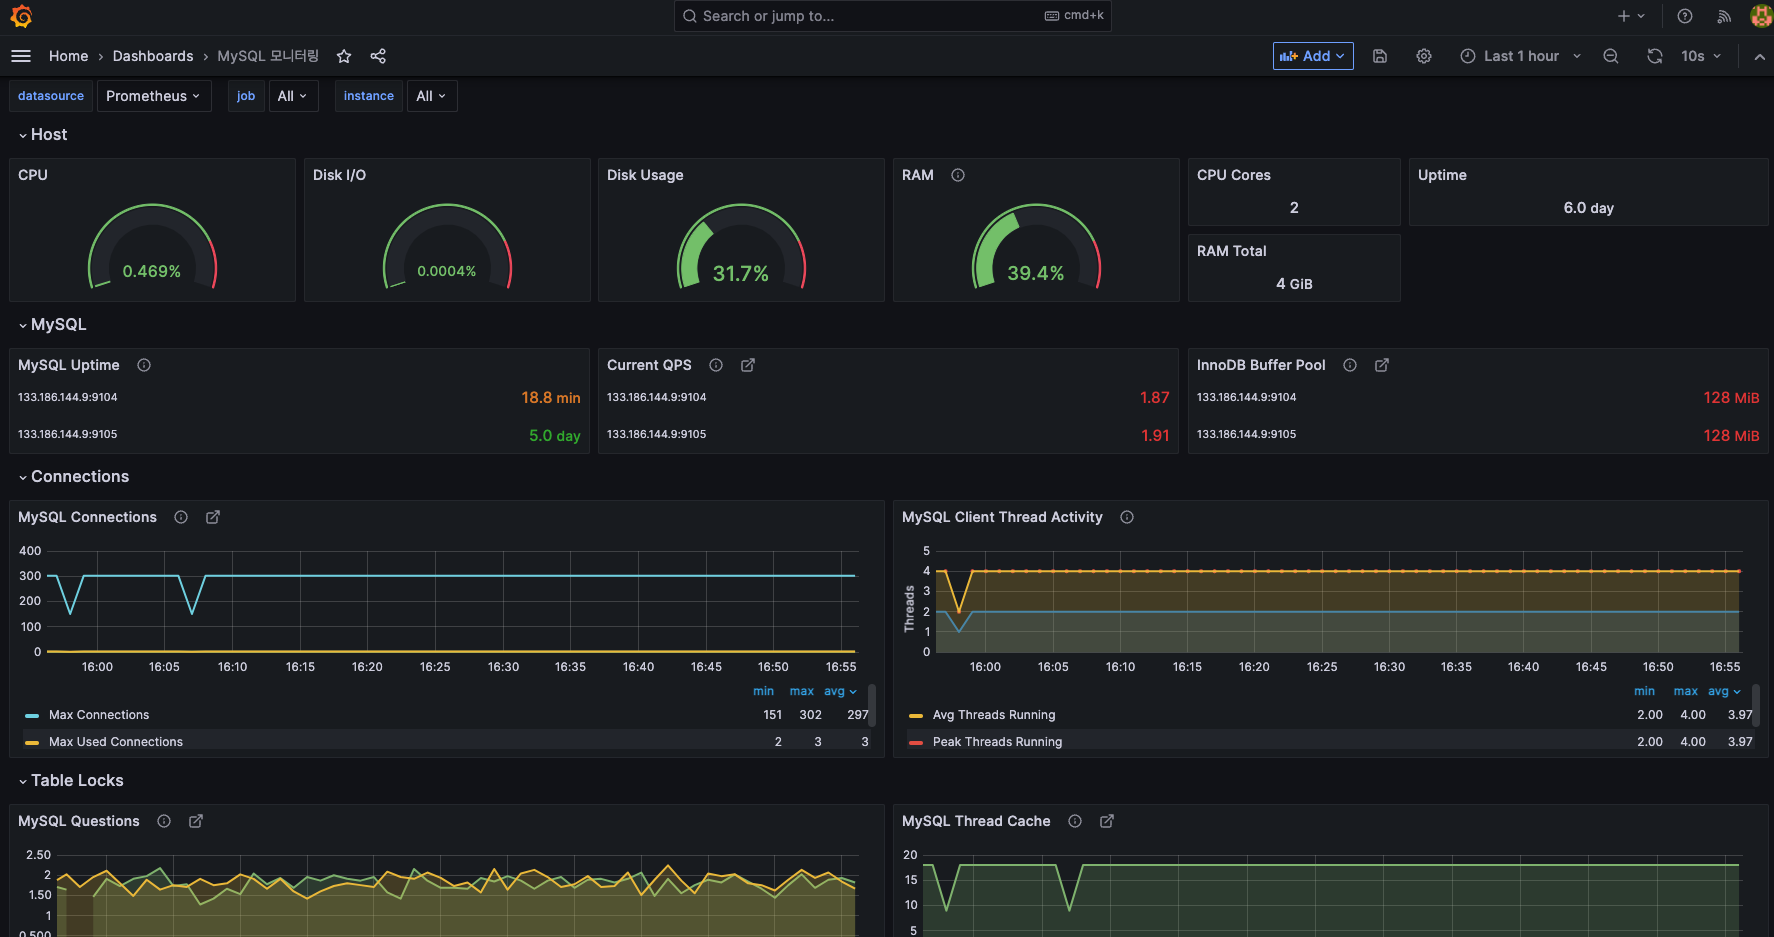
- 모니터링 항목
- Host 서버 관련
- CPU 사용량, Disk IO 사용량, Disk 사용량, RAM 사용량, CPU 코어 수, 전체 RAM 용량, Host 서버 Uptime 시간
- MySQL 서버 관련
- MySQL 서버 Uptime 시간, 현재 QPS, InnoDB Buffer Pool 사이즈
- 총 Connection 수/실행 Connection 수, Client Thread 정보
- 실행된 쿼리 수, Thread Cache 재사용 수, Object 정보, Select Type 정보
- Sort, Slow Queries, Aborted Connections, Table Lock
- Network Traffic, Memory, Command 실행 비율 등
- Host 서버 관련
참고) MySQLD Exporter 지표: https://github.com/prometheus/mysqld_exporter
과제 2
1. Alert Manager 설치
🔔 Alert Manager란?
메트릭에 특정 조건을 설정하여 알람 제공해주는 도구입니다. Prometheus에서 발생한 알람을 Alert Manager에 전달하게 됩니다. Slack, Email, Webhook 등과 연동 가능합니다.
Alert Manager 바이너리 설치
Alert Manager Download: https://prometheus.io/download/#alertmanager
# 현재 최신 버전 v0.25.0 (2023.05.17 기준) 다운로드
wget https://github.com/prometheus/alertmanager/releases/download/v0.25.0/alertmanager-0.25.0.linux-amd64.tar.gz

# 압축 풀기
tar xzvf alertmanager-0.25.0.linux-amd64.tar.gz
cd alertmanager-0.25.0.linux-amd64
백그라운드로 Alert Manager 실행
- 백그라운드로 Alert Manager를 실행하기 위해
alertmanager.service서비스 파일을 생성합니다.
sudo vi /etc/systemd/system/alertmanager.service[Unit]
Description=Alert Manager
Wants=network-online.target
After=network-online.target
[Service]
User=root
Group=root
Type=simple
ExecStart=/home/centos/alertmanager-0.25.0.linux-amd64/alertmanager --config.file=/home/centos/alertmanager-0.25.0.linux-amd64/alertmanager.yml
[Install]
WantedBy=multi-user.target- 백그라운드 서비스 등록
sudo systemctl daemon-reload
sudo systemctl enable alertmanager.service
sudo systemctl start alertmanager.service
sudo systemctl restart alertmanager.service
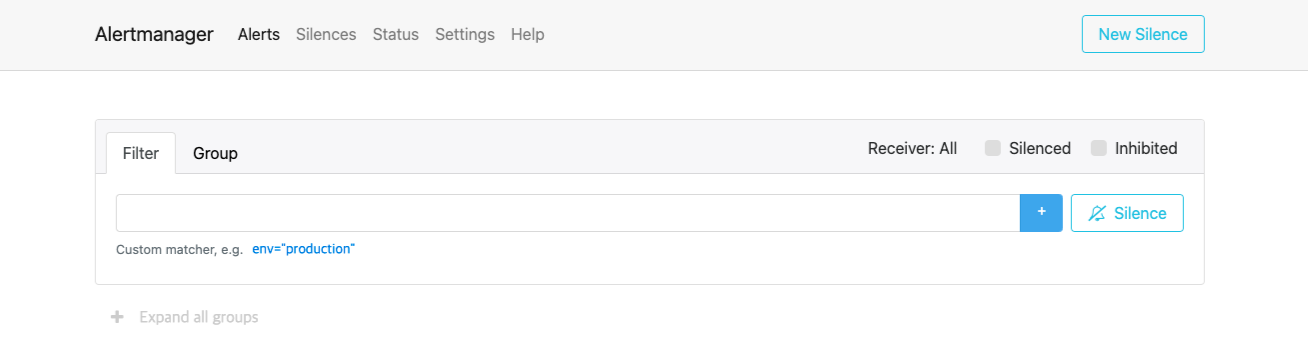
sudo systemctl status alertmanager.serviceAlert Manager 실행 확인
- Alert Manager의 기본 포트인 9093 포트로 접속하여 WEB UI가 잘 실행되는 것을 확인할 수 있습니다.
2. Dooray! 웹훅 연동
Dooray! 웹훅 생성
- 두레이 대화방 설정 > 서비스 연동 > 서비스 추가 > 인커밍훅에 이름을 지정하여 웹훅을 생성합니다.
Alert Manager 설정 파일 수정
- Alert Manager 설정 파일(alertmanager.yaml)에 생성한 웹훅 URL을 추가해줍니다.
vi /home/centos/alertmanager-0.25.0.linux-amd64/alertmanager.ymlglobal:
resolve_timeout: 5m
route: # 라우트 대상 설정
group_by: ['alertname'] # prometheus.yml의 targets-labels > label_name
group_wait: 10s # 알림 발생 전 대기시간
group_interval: 5m # 알림 간 시간 간격 설정
repeat_interval: 10m # 알림 재발생
receiver: 'webhook' # 알림 설정 대상
receivers: # 알림 설정 대상
- name: 'webhook'
webhook_configs:
- url: '생성한 웹훅 URL' # 웹훅 URL
inhibit_rules:
- source_match: # inhibit rule을 적용하기 위해 존재해야 하는 조건
severity: 'critical'
target_match: # 음소거 대상
severity: 'warning'3. Prometheus에 Alert Rule 설정
Alert Rule 작성
- Prometheus가 설치된 서버에서 아래와 같이 alert rule에 대한 yaml 파일을 생성하고 원하는 Rule을 작성합니다.
vi rules/alert_rules.yaml- alert rule 예제 참고: https://samber.github.io/awesome-prometheus-alerts/rules
groups:
- name: AllInstances
  rules:
  - alert: InstanceDown
    expr: up == 0
    for: 1m
    annotations:
      title: 'Instance {{ $labels.instance }} down'
      description: '{{ $labels.instance }} of job {{ $labels.job }} has been down for more than 1 minute.'
    labels: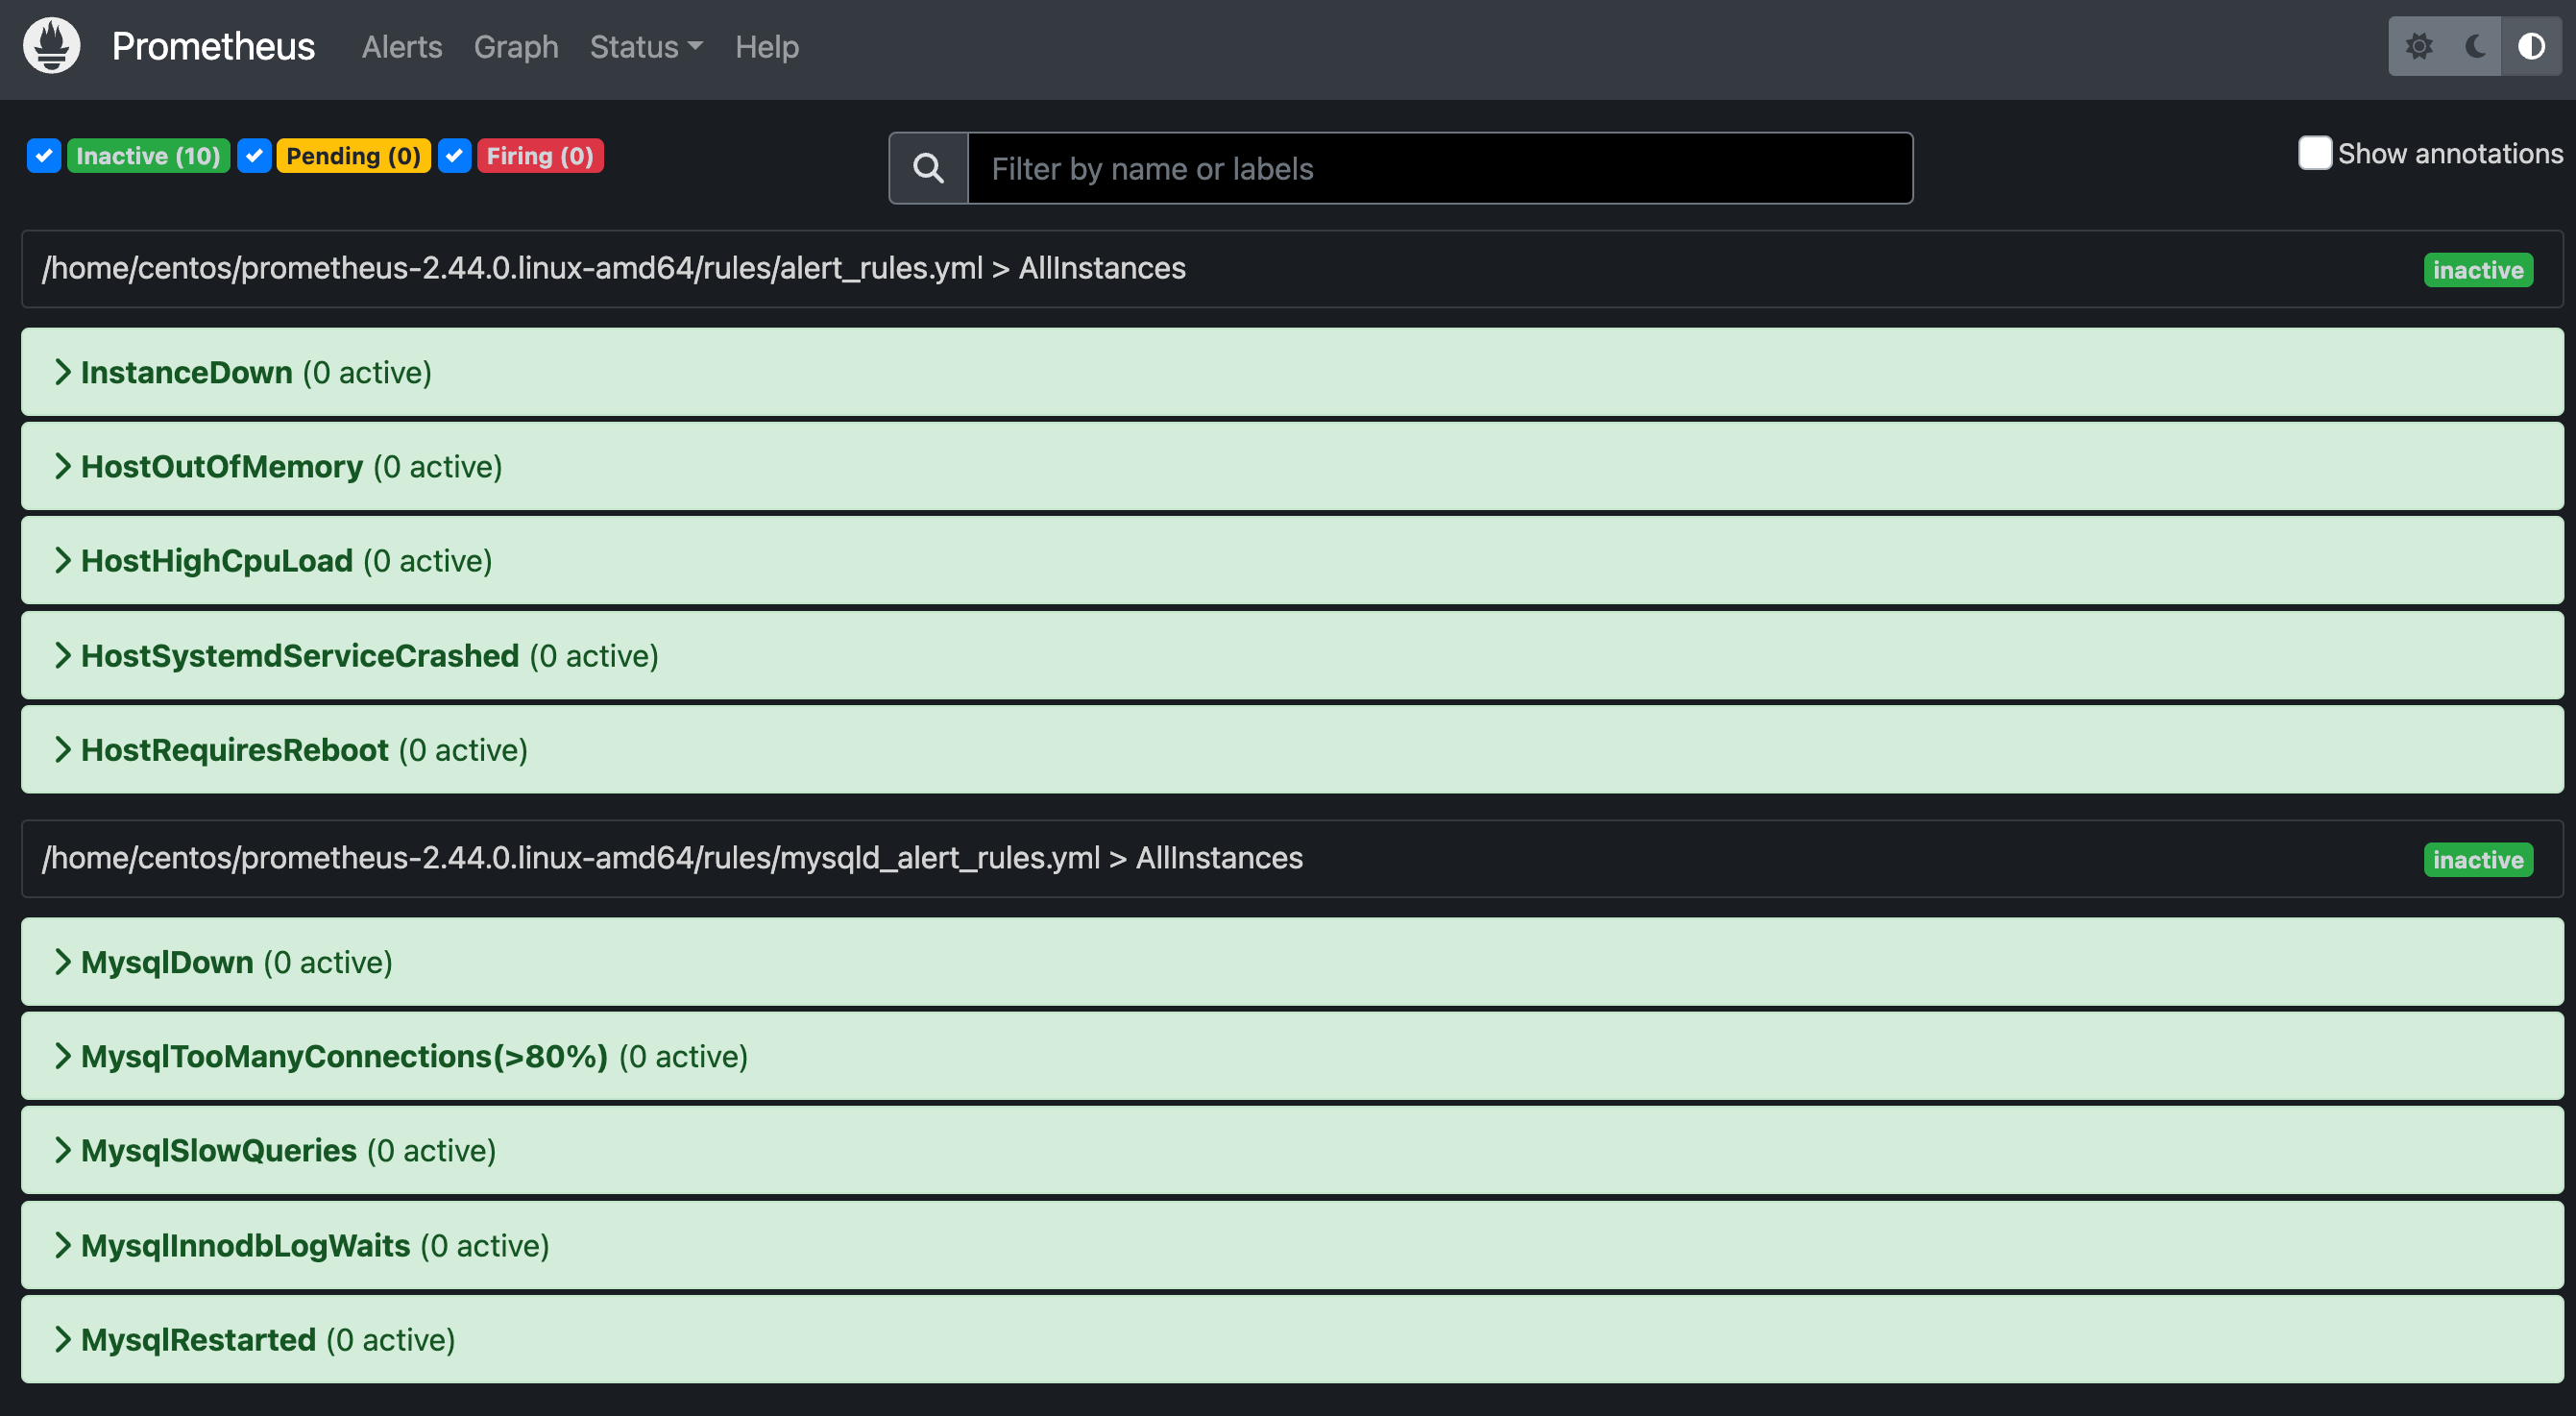
severity: 'critical'alert_rules.ymlInstanceDown: 호스트 시스템의 인스턴스가 1분 이상 다운된 경우HostOutOfMemory: 호스트 시스템의 메모리가 부족한 경우 (10% 이하가 남은 경우)HostHighCpuLoad: 호스트 시스템의 CPU 부하가 발생한 경우 (80% 이상인 경우)HostSystemdServiceCrashed: 호스트 시스템의 systemd 서비스가 충돌한 경우HostRequiresReboot: 호스트 시스템 재부팅이 필요한 경우
mysqld_alert_rules.ymlMysqlDown: MySQL 인스턴스가 다운된 경우MysqlTooManyConnections: MySQL connections이 너무 많은 경우 (max 값 기준 80% 이상)MysqlSlowQueries: MySQL에 새로운 Slow Query가 발생한 경우MysqlInnodbLogWaits: MySQL innodb 로그 쓰기 지연이 발생한 경우MysqlRestarted: MySQL이 재시작된 경우 (uptime < 60)
Prometheus 서버와 Alert Manager 연동
- Prometheus 설정 파일(
prometheus.yml) 수정
# Alertmanager configuration
alerting:
  alertmanagers:
    - static_configs:
        - targets:
           - localhost:9093

# Load rules once and periodically evaluate them according to the global 'evaluation_interval'.
rule_files:
   - "/home/centos/prometheus-2.44.0.linux-amd64/rules/alert_rules.yml"
- "/home/centos/prometheus-2.44.0.linux-amd64/rules/mysqld_alert_rules.yml"- 변경 내용을 적용하기 위해 Prometheus를 재시작해줍니다.
sudo systemctl restart prometheus.service
sudo systemctl status prometheus.service
Alert Rule 적용 확인
- Prometheus 서버의 Alert 탭에서 설정한 alert 내용을 확인할 수 있습니다.
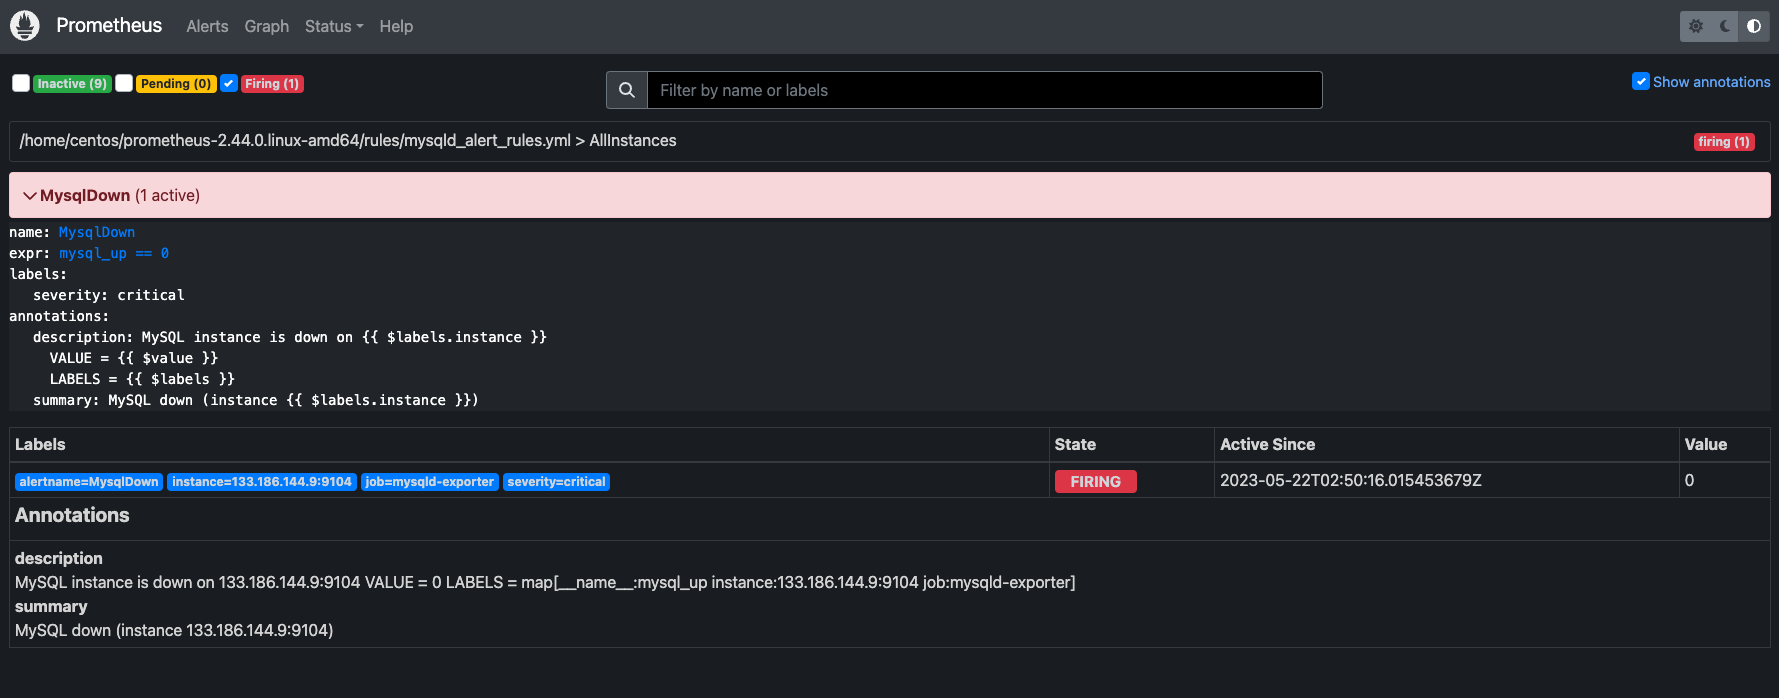
특정 Rule 도달 시 알람 확인
- 생성한 Rule 중에서 MySQL이 다운된 경우와 MySQL이 재시작된 경우에 대한 테스트를 진행하였습니다.
- MySQL 서버 중 하나를 중지한 후 Prometheus WEB UI에서 Alert 발생 감지가 정상적으로 수행되는 것을 확인할 수 있었습니다.
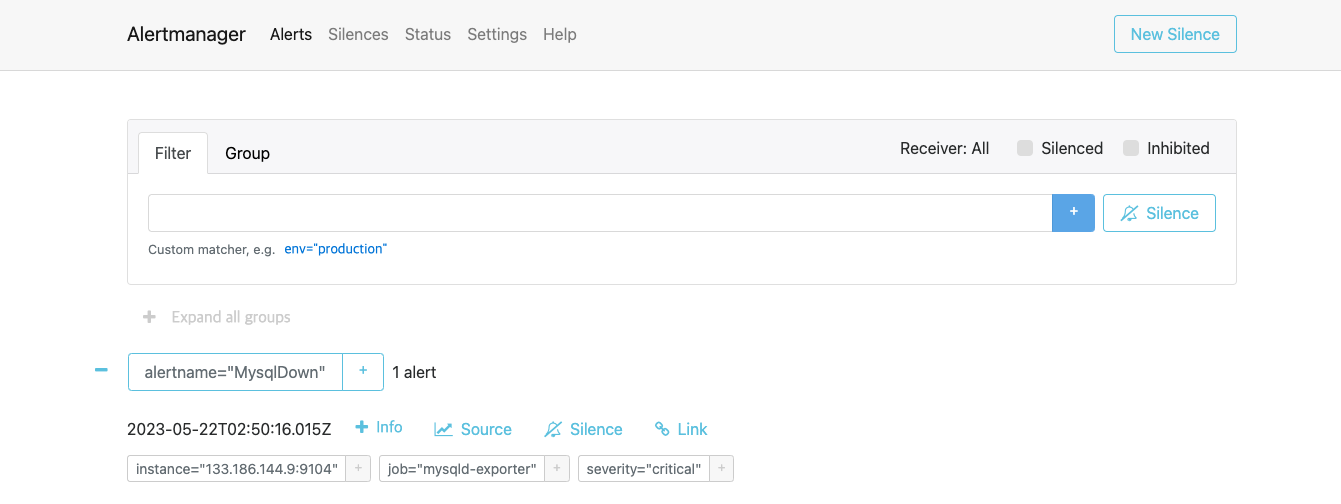
- AlertManager WEB UI에서도 Alert 발생 감지가 정상적으로 수행되는 것을 확인할 수 있습니다.
🚨 문제점
- Alert Rule에 따른 Alert 발생은 정상적으로 수행되었으나, Dooray! 웹훅을 통해 메세지가 제대로 전송되지 않는 문제점이 발생하였습니다.

- 문제 원인
- Alert Manager에서 전송하는 JSON 포맷이 Dooray! 웹훅과 맞지 않음
- 버전이 업그레이드되면서 웹훅으로의 Alert 전송 메세지 구성요소 커스텀이 불가능해짐
해결 방법 생각해보기
- Alert Manager에서 발생한 알람을 Grafana Notification과 연동
- Grafana Alerting에서 Dooray! 웹훅 연결 후 Grafana Alert Rule 생성
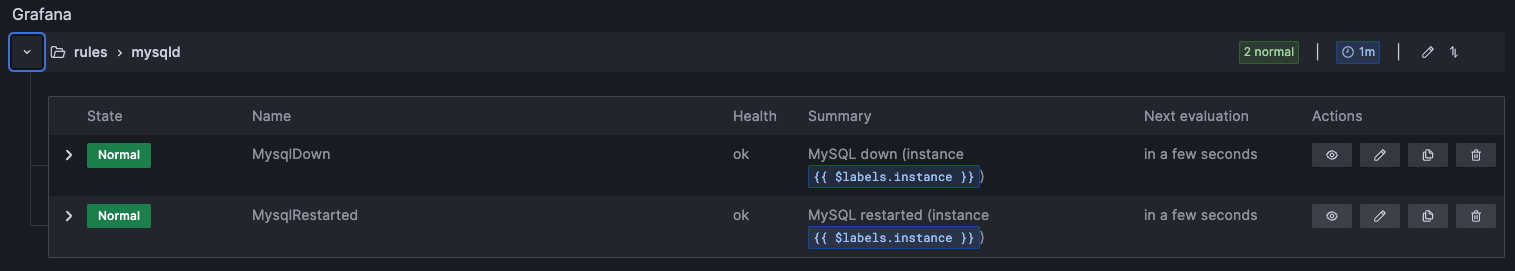
Grafana에서 MysqlDown과 MysqlRestarted에 대한 Alert Rule을 설정
Contact points에 Dooray! 웹훅을 등록

Notification policies에 설정한 Dooray Contact point 설정

MySQL 서버 중 하나를 재시작하여 테스트 진행
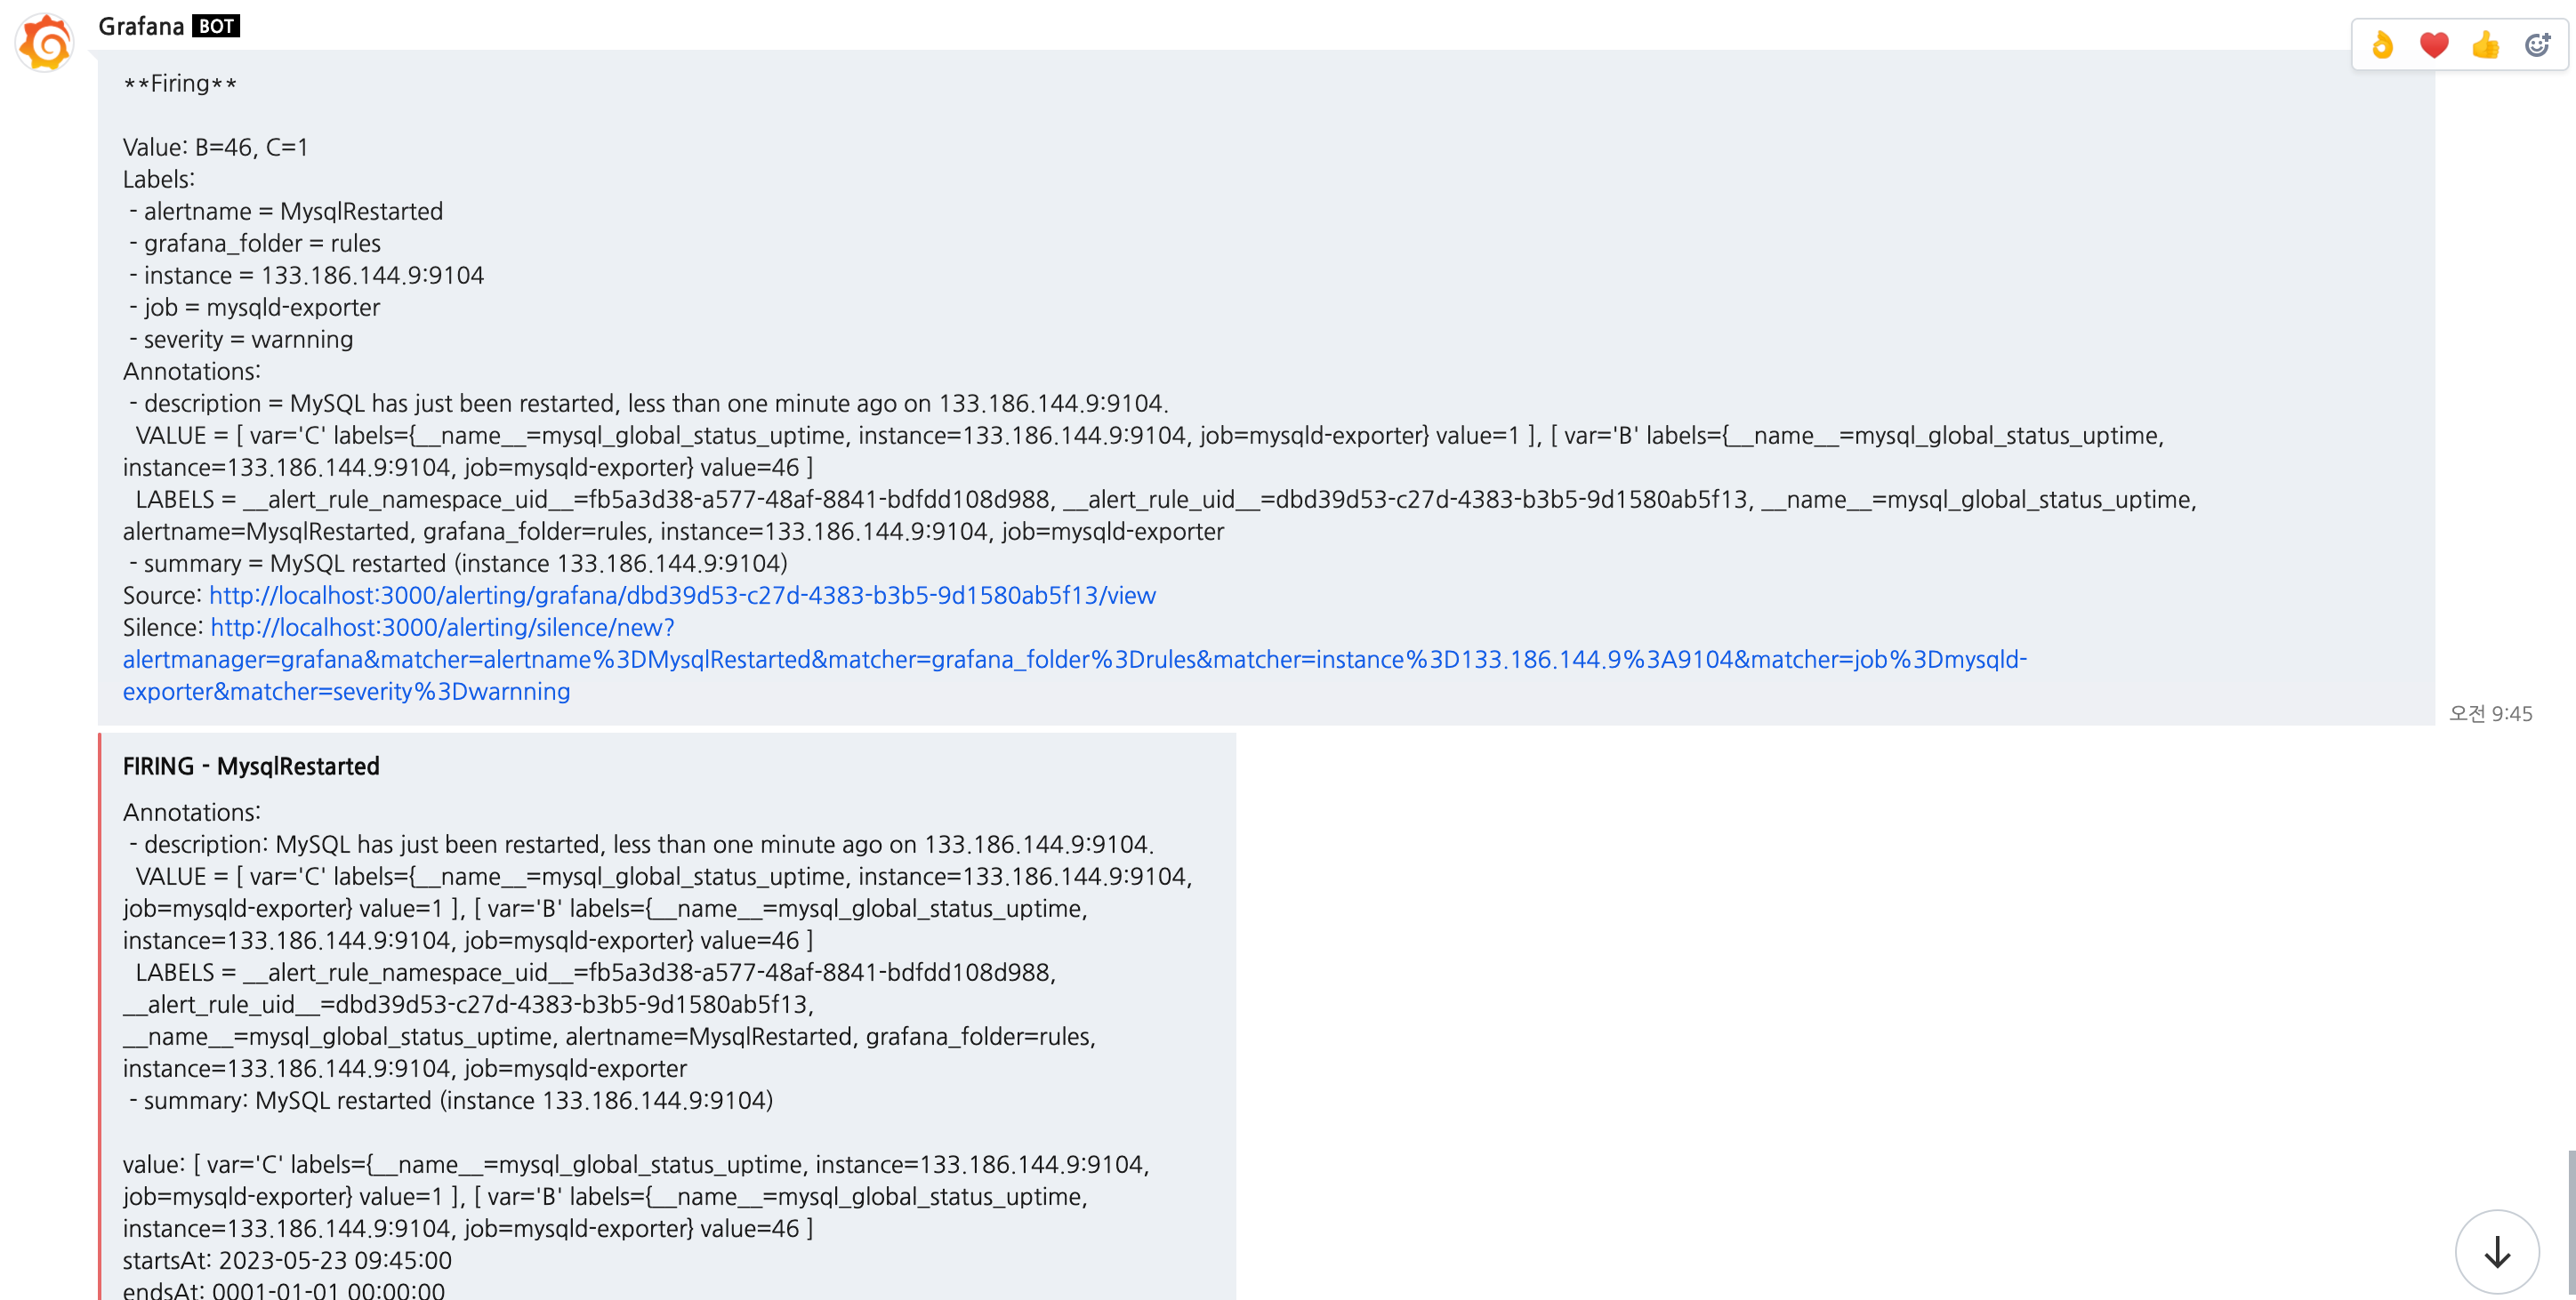
Alert 메세지가 정상적으로 수신되는 것을 확인할 수 있었습니다.
참고
https://prometheus.io/docs/introduction/
https://prometheus.io/download/
https://github.com/prometheus/mysqld_exporter
https://grafana.com/docs/grafana/latest/setup-grafana/installation/debian/
https://grafana.com/grafana/download
https://grafana.com/grafana/dashboards/
https://github.com/prometheus/alertmanager
https://samber.github.io/awesome-prometheus-alerts/rules