데이터 프로파일링을 통한 EDA
1. 탐색적 데이터 분석(EDA)
📌 1. 탐색적 데이터 분석(EDA)
EDA : Exploratory Data Analysis, 탐색적 데이터 분석
데이터를 다양한 각도에서 관찰하고 이해하는 일련의 과정을 말한다.
데이터 분석 이전에 그래프나 통계적인 방법으로 자료를 직관적으로 바라보는 방법이다.
EDA의 이점
- 데이터의 잠재적인 문제 발견
- 데이터의 다양한 패턴 발견
- 자료수집을 위한 기반(추가 자료수집도 포함)
- 적절한 통계 도구 제시
📌 2. EDA 프로세스
- 전체적인 데이터 분석
- 분석의 목적과 목적에 맞는 변수가 무엇인지
- 데이터형 확인/ 데이터의 오류나 누락이 없는지
- 데이터를 구성하는 각 속성값이 예측한 범위와 분포를 갖는지
- 데이터 개별 속성값 관찰
- 개별 데이터를 관찰하며 전체적인 추세와 특이사항 관찰
- 적절한 요약통계 지표 사용(평균, 중앙값, 분산 등)
- 시각화를 통해 데이터의 개별 속성에 어떤 통계 지표가 적절한지 결정
- 속성 간 상관분석
- 개별 속성 관찰에서 찾아내지 못했던 속성들의 조합, 패턴 발견
- 그래프를 통해 시각화하여 속성 간 관계 분석
- 상관계수를 통한 상관관계 확인
📌 3. 변수 분석
1. 단변량 분석
: 변수 하나에 대한 기술통계량(descriptive statistics)확인하기
- 대표값 : 데이터의 평균, 중위수, 최빈수
- 산포 : 표준편차, 분산, 범위, 사분위수
- 분포 : 왜도, 첨도
- 기타 : 신뢰구간, 데이터의 정규성
: Histogram이나 Boxplot을 통해 평균, 최빈값, 중간값 등과 함께 각 변수들의 분포 확인
: 범주형 변수의 경우 Boxplot 사용해 빈도 수 분포를 체크
2. 이변량 분석
: 변수 2개 간의 상관관계 분석
- 상관관계 분석(Correlation Analysis) : 두 개 이상의 변수 사이에 존재하는 상호 연관성의 존재 여부와 연관성의 강도를 측정해 분석
3. 다변량 분석
: 범주형 변수가 하나 이상 포함되어 있는 경우, 변수를 범주에 따라 분리한 뒤 위의 분석 방법에 따라 분석
: 모두 연속형 변수라면 연속형 변수를 Feature Engineering을 통해 범주형 변수로 변환한 후 분석 or 3차원 그래프를 그려 시각적으로 확인
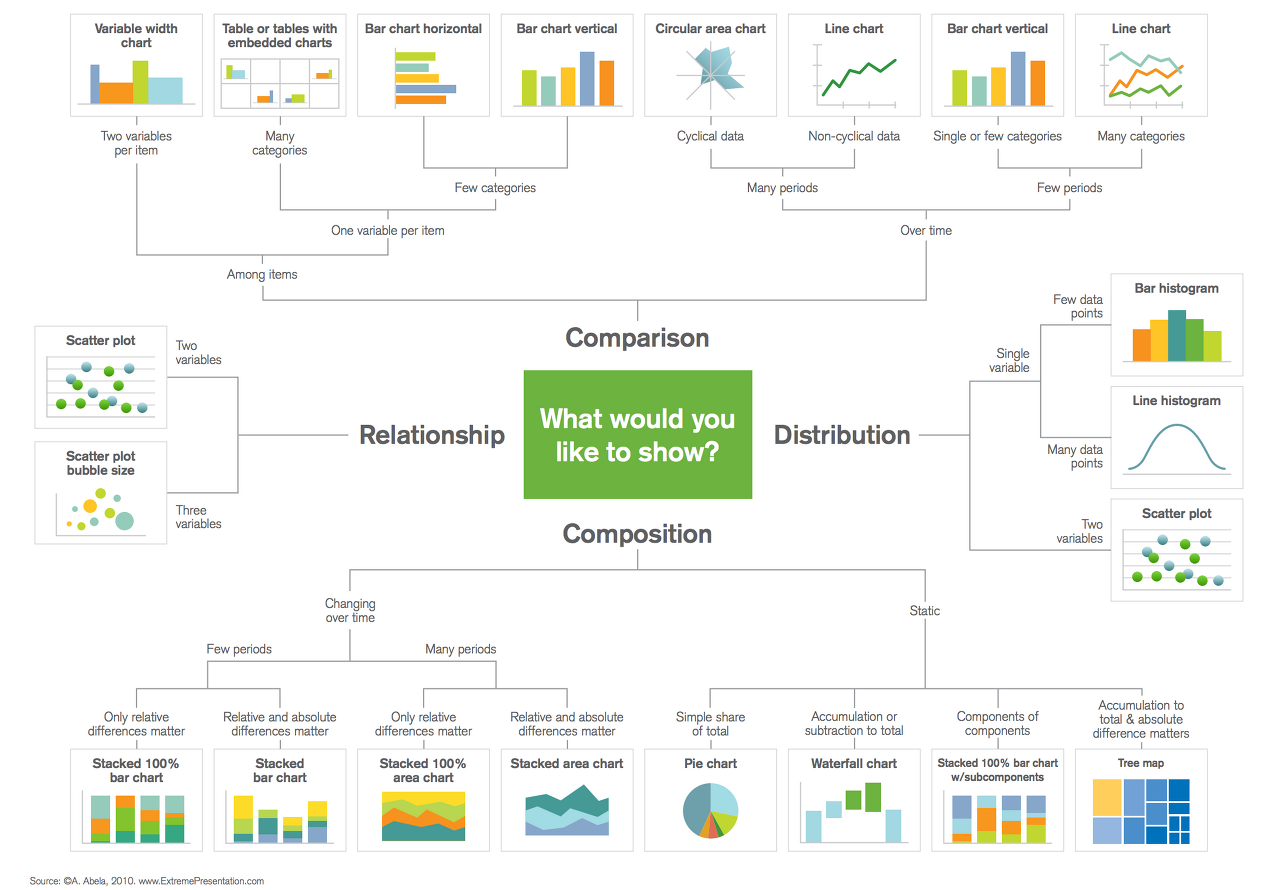
4. 그래프 분석
: 데이터의 종류에 따라 적절한 그래프 선택
: 다양한 그래프 통해 피처들의 특성 파악하는 것이 중요
2. 데이터 프로파일링
📌 1. 데이터 프로파일링
- EDA를 수행하는 것을 의미한다
- 데이터 내 값의 분포, 변수 간의 관계, Null 값과 같은 결측값(Missing Values) 존재 유무 등 분석
📌 2. 데이터 프로파일링 단계
1. 메타데이터 수집 및 분석
- 실제 운영 중인 DB의 테이블 명, 컬럼 명, 제약 조건 등의 정보 분석
- 테이블 정의서, 컬럼 정의서와 같은 데이터 관리 문서의 정보 분석
- 추출된 테이블 및 컬럼에 대한 메타데이터와 데이터 관리 문서를 매핑하여 불일치 사항을 분석
2. 컬럼 속성 분석
- 대상 컬럼의 비유효한 값을 확인하는 과정
- 컬럼의 총 건수, 유일값 수, Null 값 수, 공백값 수, 최댓값, 최솟값, 최대 빈도, 최소 빈도 등 기초 집계값을 산출하여 값이 유효한 범위 내에 있는지 판단
3. 결측치 분석
- 반드시 입력되어야 하는 데 누락이 발생한 컬럼을 발견하는 과정
- 결측치 : NULL값, 공백값, 숫자'0' 등
- NULL 허용 컬럼일지라도 NULL과 공백이 혼재하는 경우 총건수와 NULL 건수가 같아 미사용으로 추정되는 컬럼을 발견하는 경우도 포함
4. 허용범위 분석
- 값이 가져야 할 범위 내에 그 값이 있는지 파악하는 과정
- 허용범위는 해당 속성의 도메인 유형에 따라 정해짐
- 해당 값이 오류 데이터라면 NULL값 부여해야
5. 허용값 분석
- 해당 컬럼의 허용값 목록이나 집합에 포함되지 않는 값을 발견하는 과정
- 코드 매핑 정의서에 기술한 코드 성격의 컬럼이 분석 대상에 해당
6. 패턴 분석
- 해당 컬럼의 문자열 유형을 따르지 않는 오류 유형을 발견하는 과정
- 문자일 경우 C, 숫자일 경우 9, 공백일 경우 S를 반환하는 함수 만들어 사용
7. 날짜 유형 분석
- 대상 컬럼이 DBMS의 DATE 관련 자료형을 가지면 날짜 패턴 및 유효성 검증은 문제없음
8. 유일값 분석
- 업무적 의미에서 유일해야 하는 컬럼에 중복값이 발생했는지 파악하는 과정
- DBMS 제약조건으로 PK(Primary Key)가 설정된 컬럼이나 UNIQUE가 설정된 컬럼은 문제없음.
9. 구조 분석
- 구조 결함으로 인해 일관되지 못한 데이터를 발견하는 분석기법
- ERD(Entity Relationship Diagram) 등 설계 시에는 관계를 설정해두고 DB에는 제약 조건을 적용하지 않고 개발한 경우 발생하는 문제 해결
3. 데이터 프로파일링을 위한 Python 패키지
📌 1. klib
- pandas, matplotlib, seaborn 등의 데이터 분석과 시각화 라이브러리를 기반으로 만들어진 utility 패키지
- pandas 데이터프레임을 기반으로 데이터전처리 및 프로파일링을 제공해주는 패키지
- 데이터 품질평가, 데이터 전처리, 관계시각화를 목적으로 사용
1. 제공 API
- klib.describe: 시각화 메서드
- klib.cat_plot(df): 범주형 변수 프로파일링
- klib.corr_mat(df): 상관관계 매트릭스
- klib.corr_plot(df): 상관관계
- klib.dist_plot(df): 분포
- klib.missingval_plot(df): 결측치 - klib.clean: 데이터 정제 메서드
- klib.data_cleaning(df): 데이터 정제 (데이터 유형변경, 중복/결측치행 삭제,…)
- klib.clean_column_names(df): 컬럼명 변경
- klib.convert_datatypes(df): 데이터 유형 변경
- klib.drop_missing(df): 결측행 삭제
- klib.mv_col_handling(df): 피처 삭제
- klib.pool_duplicate_subsets(df): 중복 데이터 삭제 - klib.preprocess: 데이터 전처리(feature selection, scaling, …)
- klib.train_dev_test_split(df): 데이터세트 분리
- klib.feature_selection_pipe(): 피쳐 선택
- klib.num_pipe(): 수치형 데이터 처리
- klib.cat_pipe(): 범주형 데이터 처리
- klib.preprocess.ColumnSelector(): 피쳐 선택
- klib.preprocess.PipeInfo(): 전처리 파이프 라인처리
2. 설치 & import
import warnings

#hide warnings
warnings.filterwarnings("ignore")
import klib
import pandas as pd
import seaborn as sns
df = sns.load_dataset("titanic")
df.head() survived pclass sex age ... deck embark_town alive alone
0 0 3 male 22.0 ... NaN Southampton no False
1 1 1 female 38.0 ... C Cherbourg yes False
2 1 3 female 26.0 ... NaN Southampton yes True
3 1 1 female 35.0 ... C Southampton yes False
4 0 3 male 35.0 ... NaN Southampton no True
[5 rows x 15 columns]결측치에 대한 프로파일링 플롯
klib.missing_plot(df)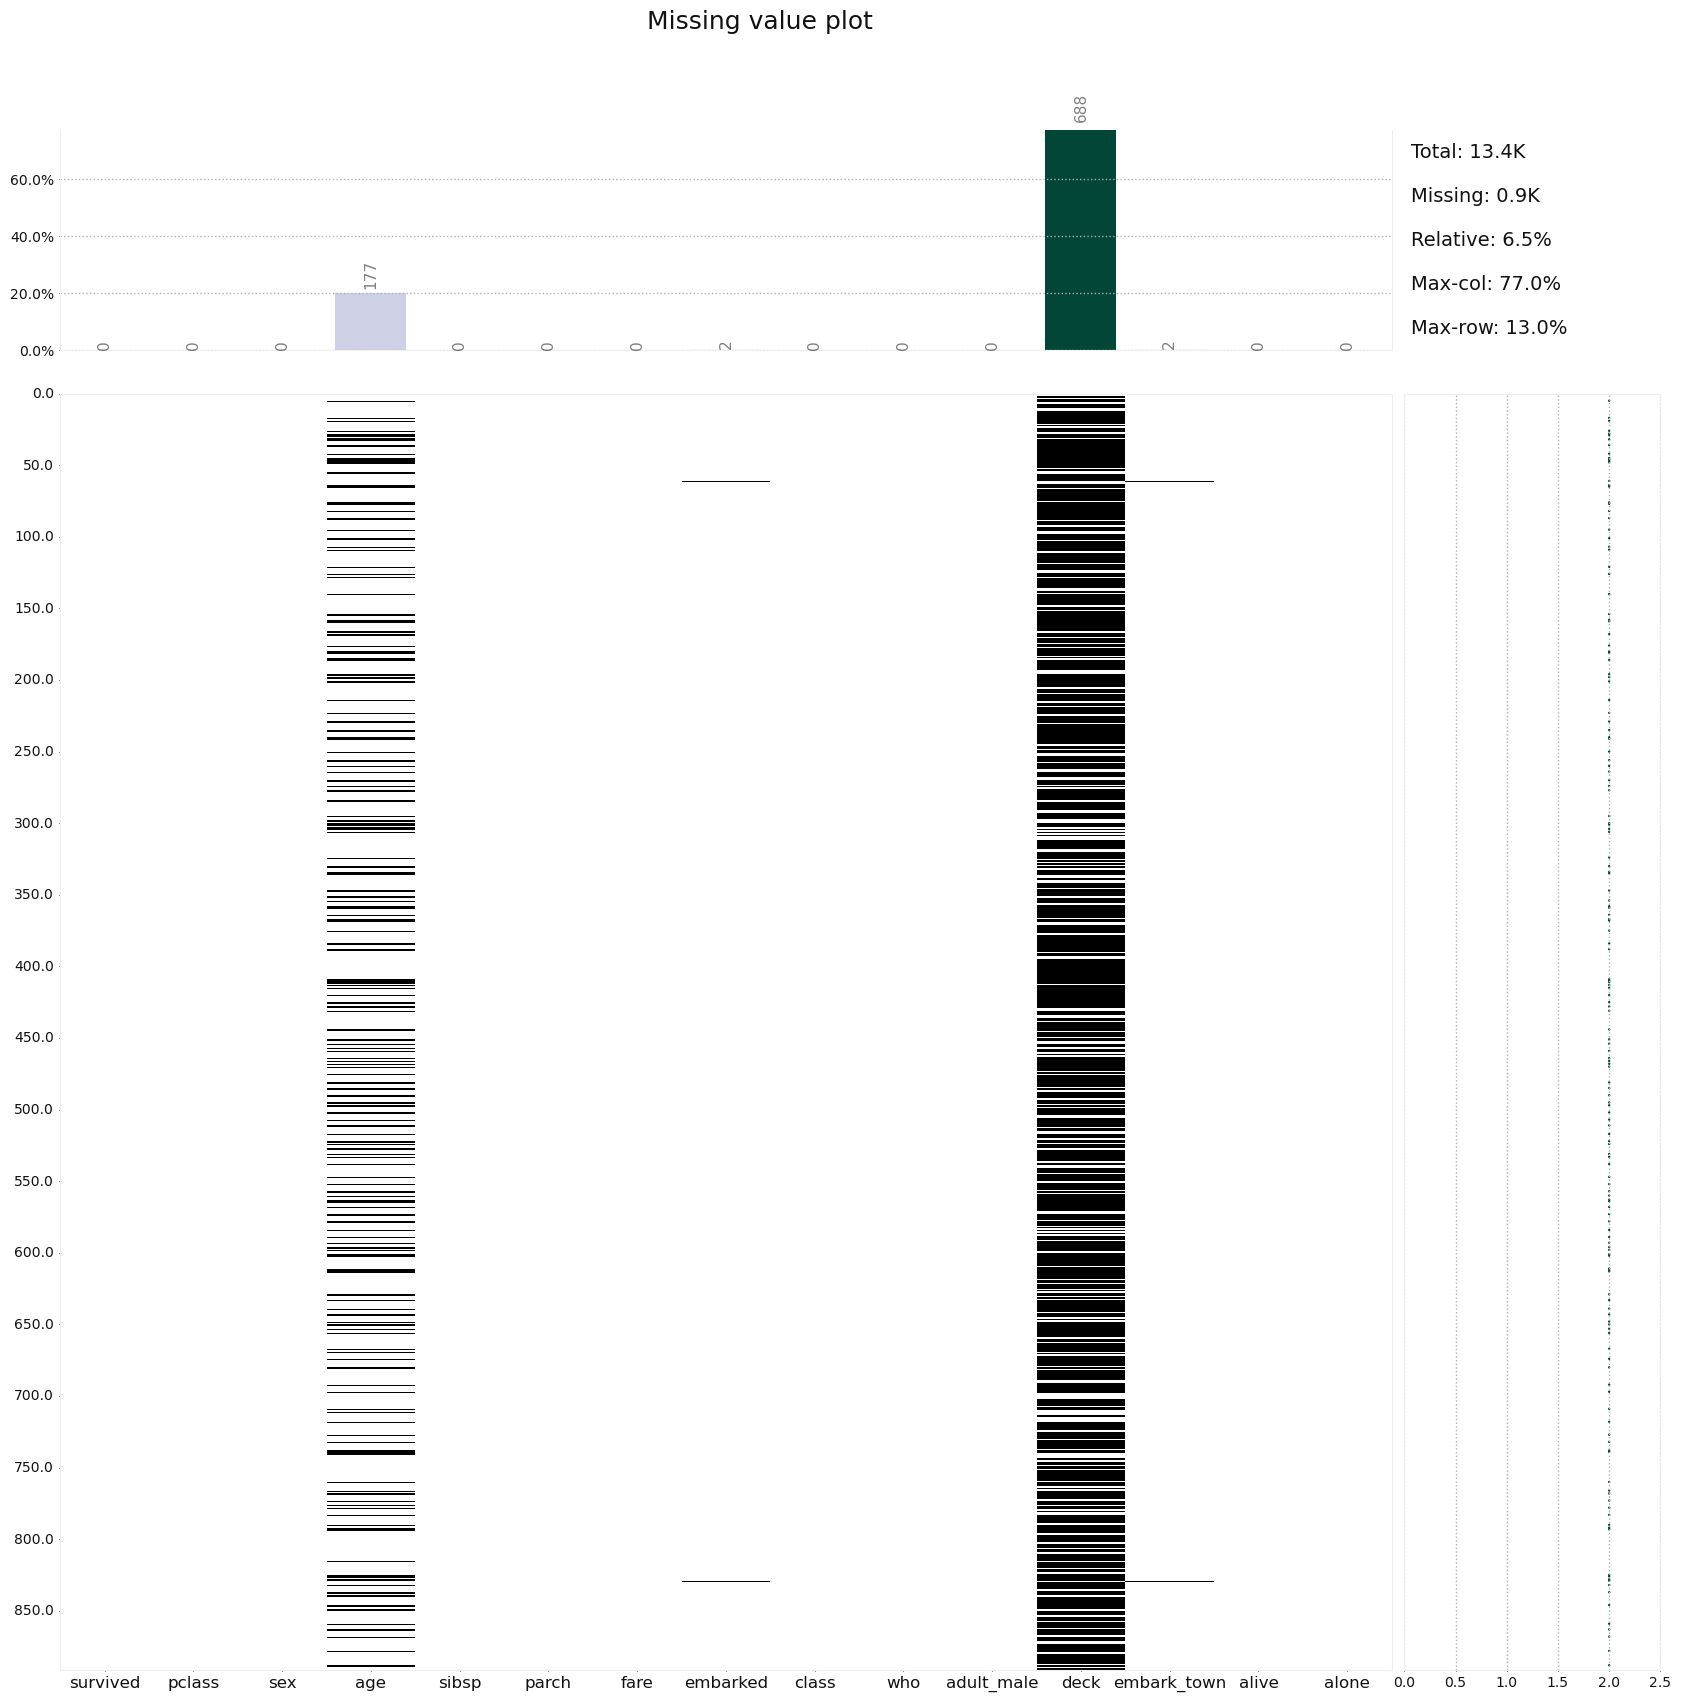
#양의 상관관계 플롯
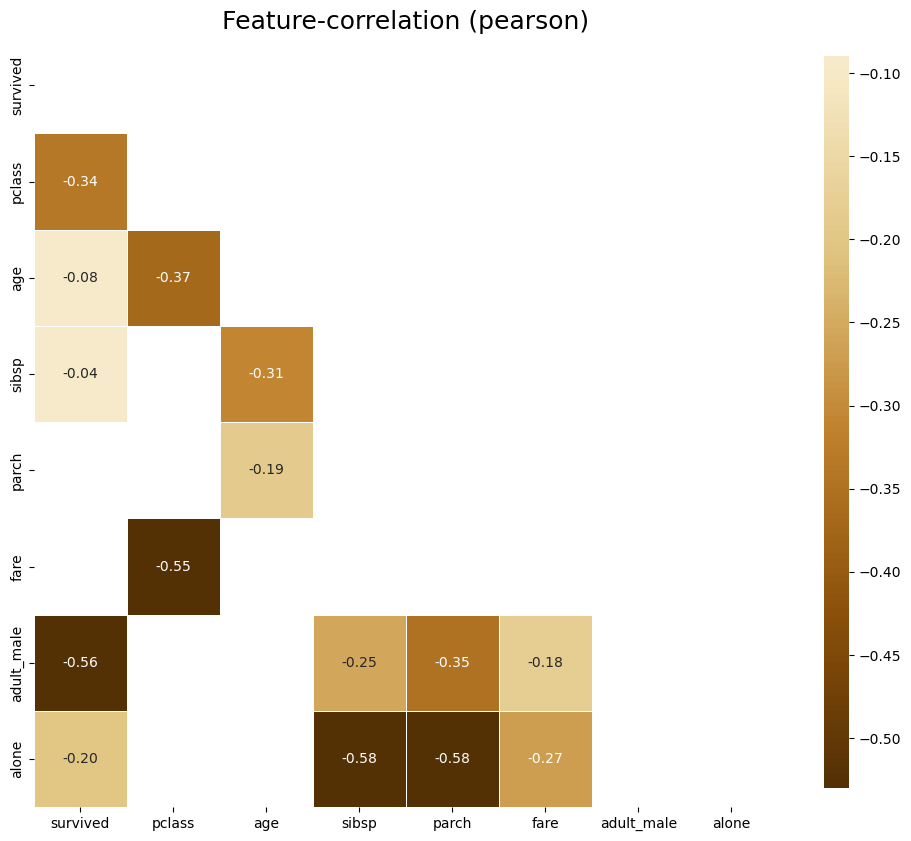
klib.corr_plot(df, split = 'pos')
#음의 상관관계 플롯
klib.corr_plot(df, split = 'neg')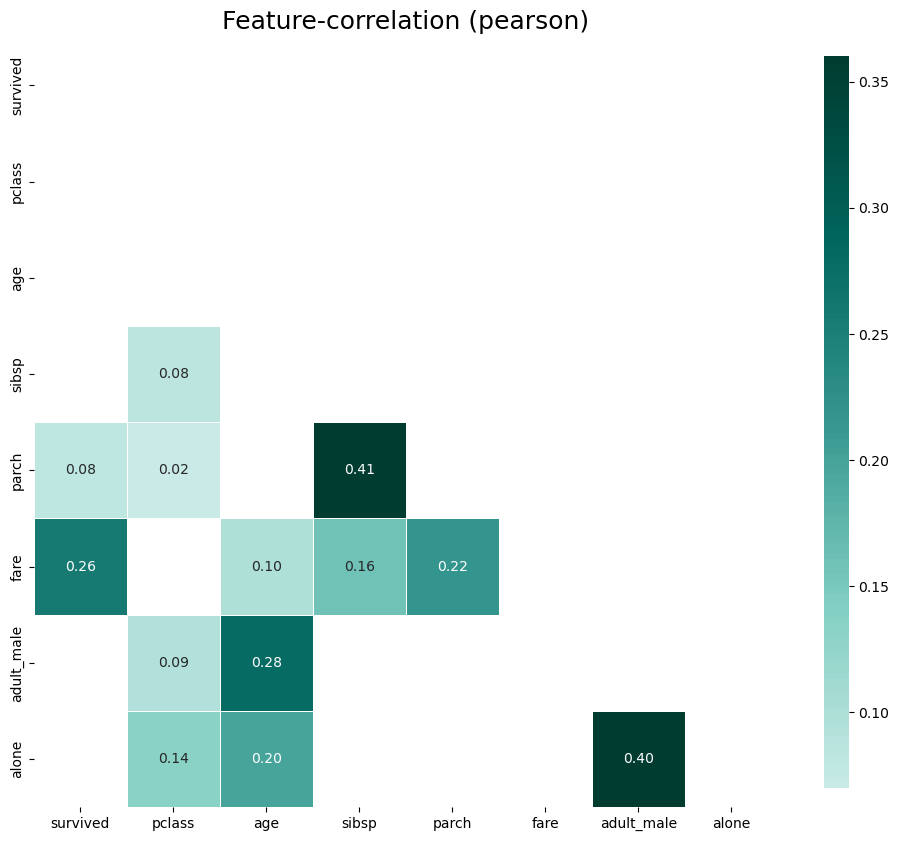
klib.corr_plot(df, target = 'age')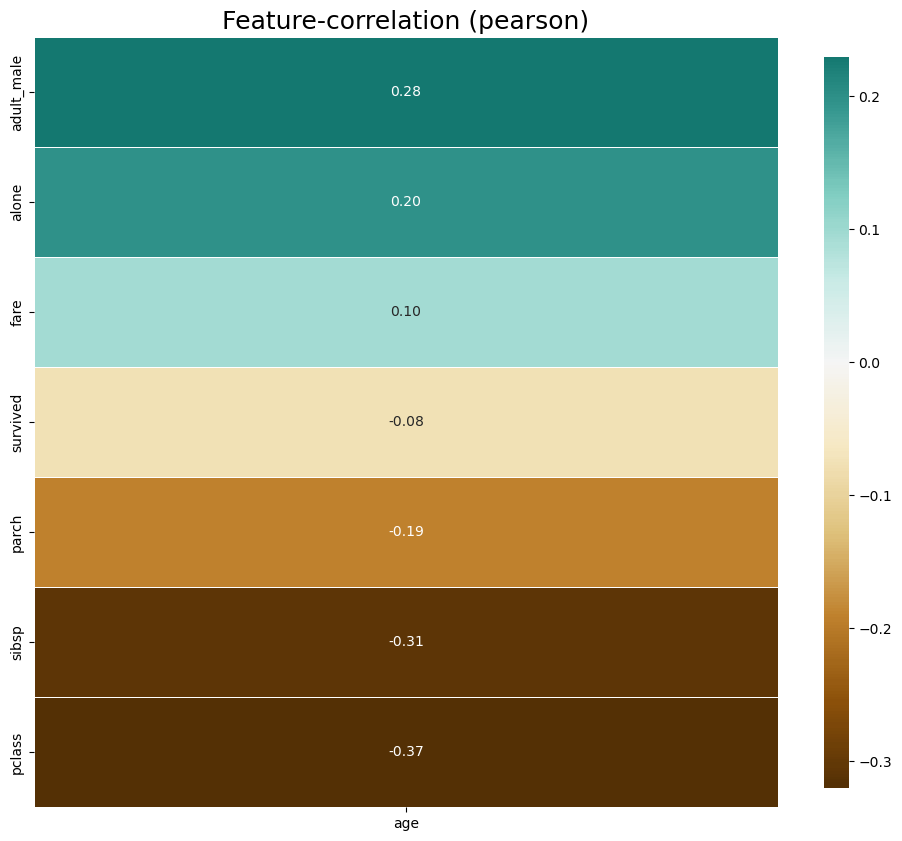
klib.dist_plot(df)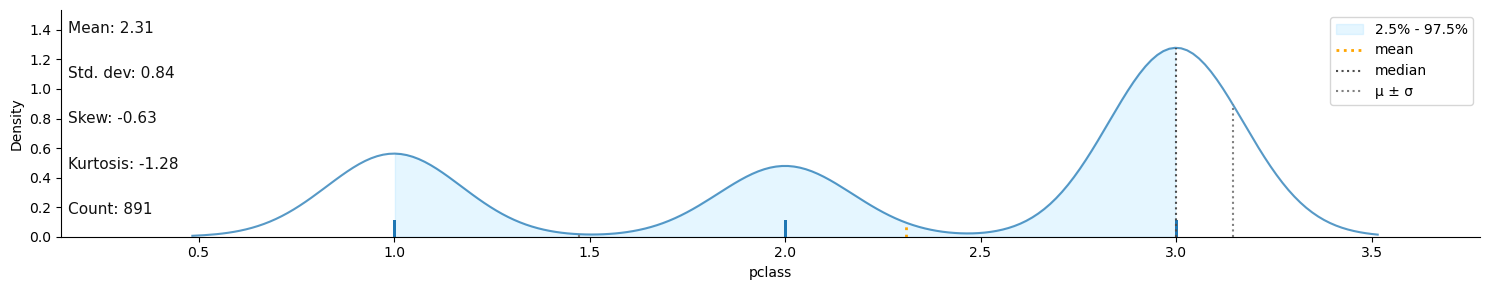
결측치 제거
df_cleaning = klib.data_cleaning(df)Shape of cleaned data: (784, 15) - Remaining NAs: 692
Dropped rows: 107
of which 107 duplicates. (Rows (first 150 shown): [47, 76, 77, 87, 95, 101, 121, 133, 173, 196, 198, 201, 213, 223, 241, 260, 274, 295, 300, 304, 313, 320, 324, 335, 343, 354, 355, 358, 359, 364, 368, 384, 409, 410, 413, 418, 420, 425, 428, 431, 454, 459, 464, 466, 470, 476, 481, 485, 488, 490, 494, 500, 511, 521, 522, 526, 531, 560, 563, 564, 568, 573, 588, 589, 598, 601, 612, 613, 614, 635, 636, 640, 641, 644, 646, 650, 656, 666, 674, 692, 696, 709, 732, 733, 734, 738, 739, 757, 758, 760, 773, 790, 792, 800, 808, 832, 837, 838, 844, 846, 859, 863, 870, 877, 878, 884, 886])
Dropped columns: 0
of which 0 single valued. Columns: []
Dropped missing values: 177
Reduced memory by at least: 0.06 MB (-75.0%)📌 2. ydata-profiling
1. 패키지 설치하기
$ pip install -U ydata-profilingimport numpy as np
import pandas as pd
from ydata_profiling import ProfileReport
df = pd.DataFrame(np.random.rand(300, 5), columns = ['a', 'b', 'c', 'd', 'e'])
print(df.head()) a b c d e
0 0.256913 0.029879 0.703868 0.460997 0.229289
1 0.123758 0.289923 0.876893 0.730410 0.087231
2 0.898840 0.796030 0.097658 0.032270 0.882305
3 0.810458 0.693949 0.651186 0.555393 0.085024
4 0.869552 0.245806 0.887612 0.964292 0.5350382. ydataprofiling
- 활용
- 패키지 import 하기
import numpy as np
import pandas as pd
from ydata_profiling import ProfileReport- 테스트 데이터 만들기
df = pd.DataFrame(np.random.rand(100, 5), columns=["a", "b", "c", "d", "e"])
print(df.head())
a b c d e
0 0.475418 0.632401 0.833304 0.488212 0.457984
1 0.926178 0.982091 0.965655 0.221599 0.208072
2 0.148913 0.149262 0.494310 0.485184 0.313386
3 0.648525 0.330472 0.271104 0.339321 0.677158
4 0.565470 0.245023 0.396740 0.301198 0.384929- 프로파일링 리포트 생성
profile = ProfileReport(df, title = "Ydata Profiling Report")
print(profile)

#profile.to_notebook_iframe()
profile.to_file("..문서/my_profiling_report.html")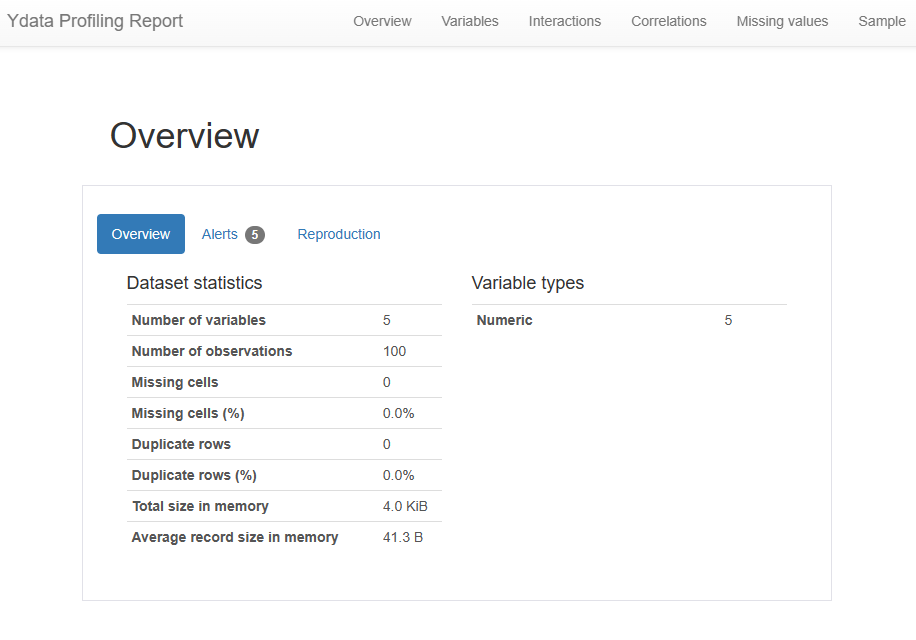
- 결측치가 있는 데이터
import numpy as np
import pandas as pd
from ydata_profiling import ProfileReport
import seaborn as sns

#seaborn Titanic 데이터셋 import
df_titanic = sns.load_dataset("titanic")
print(df_titanic.head())
survived pclass sex age sibsp parch ... who adult_male deck embark_town alive alone
0 0 3 male 22.0 1 0 ... man True NaN Southampton no False
1 1 1 female 38.0 1 0 ... woman False C Cherbourg yes False
2 1 3 female 26.0 0 0 ... woman False NaN Southampton yes True
3 1 1 female 35.0 1 0 ... woman False C Southampton yes False
4 0 3 male 35.0 0 0 ... man True NaN Southampton no True
[5 rows x 15 columns]- 프로파일링 리포트 생성
profile.to_file("..source/titanic_profiling_report.html")
3. 영화 리뷰 데이터 NLP
github konlp rawdata link 에서 ko_test.csv파일 다운로드
import pandas as pd
import numpy as np
from ydata_profiling import ProfileReport

movie_df = pd.read_csv("C:/Users/USER_0/Downloads/ko_test.csv", sep=",")

print(movie_df.head(5))
id document
0 8544678 뭐야 이 평점들은.... 나쁘진 않지만 10점 짜리는 더더욱 아니잖아
1 6825595 지루하지는 않은데 완전 막장임... 돈주고 보기에는....
2 6723715 3D만 아니었어도 별 다섯 개 줬을텐데.. 왜 3D로 나와서 제 심기를 불편하게 하죠??
3 6315043 진정한 쓰레기
4 8932678 갈수록 개판되가는 중국영화 유치하고 내용없음 폼잡다 끝남 말도안되는 무기에 유치한c...- 프로파일링 리포트 생성
pf_movie = ProfileReport(movie_df, title = "네이버 영화 리뷰 데이터 프로파일링 보고서")

pf_movie.to_html()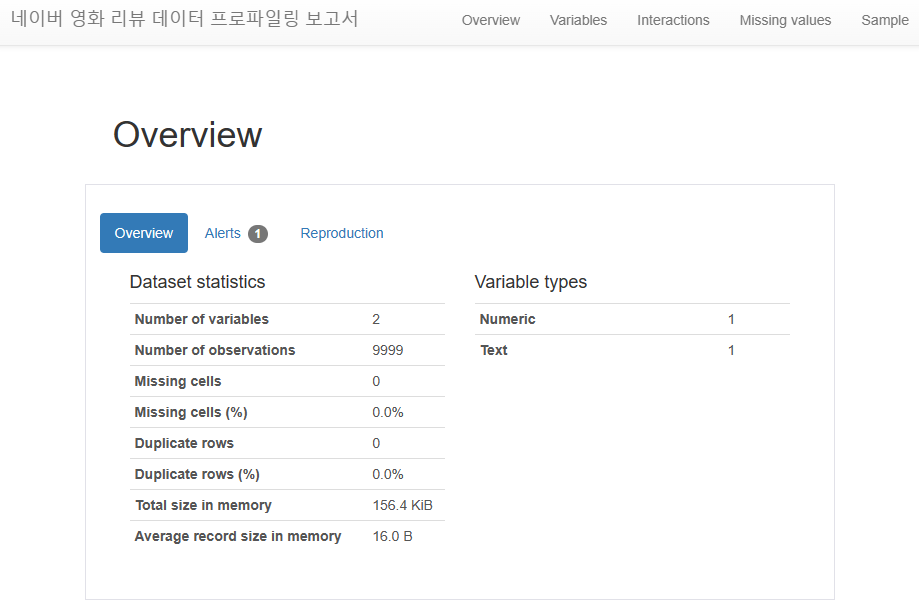
📌 3. PyGWalker
- 시각화를 통합 EDA를 위한 라이브러리
- pandas 데이터 프레임을 시각적으로 탐색하기 위한 tableau 스타일 사용자 인터페이스 제공
-pygwalker 설치
pip install pygwalker윈도우 환경에서 설치, 터미널창에 입력
- 필요 패키지 import
import pandas as pd
import pygwalker as pyg- pandas 데이터프레임으로 pygwalker 실행하기
import seaborn as sns

df_titanic = sns.load_dataset("titanic")
gwalker = pyg.walk(df_titanic).display_on_jupyter()