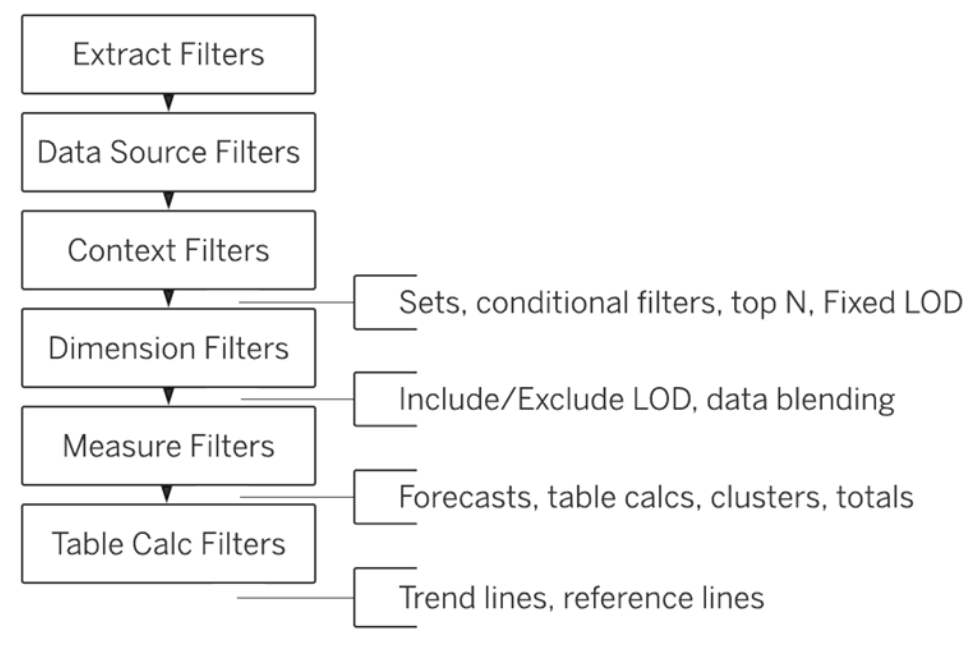
📖 Order of Operations
- LOD expressions are used to bypass the normal aggragation level
- LOD expressions can aggregate data beyond the visualization level
- LOD expressions are used to run complex queries involving many dimensions.
- syntax of Fixed LOD
{FIXED [Region]: SUM([Sales])}
- syntax of Fixed LOD
Context Filters
- Add to Context
- ONLY using the data that passes through the context filter
- Context Filter will only allow data from the segment you select to pass through.
- Appear at the top of the Filters shelf
- Cannot be rearranged on the shelf
- Are identified by a gray color on the Filters shelf
1) Improve performance
2) Create a dependent numerical or top N filter
3) To include only the data of interest
📖 Sorting and Adding a Manual Sort
- Manual Sort: You can define the order in which you want to present your data.
- If you use some other sort such as ascending order, tableau will override the manual sort that you created.
- you can sort a visualization → An axis, A header, and a field label
- Sort By
- Data source order
- Alphabetic
- Field
- Manual
- Nested
- how to clear all sort at a time
- Right click on field - Clear Sort
- Click on Worksheet menu - Clear - Sorts
- Clearsheet toolbar - dropdown menu - Clear Sorts
📖 Histograms
- It displays the shape of a distribution.
- 1개의 측정값 필요
- make use of 'binned' data
- groups values for a continuous measure into ranges, or bins.
Using Parameters with Histograms
📖 Creating Calculated Fields
-
Number / String / Date / Type conversion / Logical / Aggregate / User / Table Calculation / Spatial
Measures → orange color
Functions → blue color
Parameter → violet color
conditional statements → black color
'=' 표시로 계산된 필드 구별 가능 -
Parameters, Filters, Calculated fields, Actions and Highlight actions allow the dynamic control of multiple visualization elements simultaneously in Tableau
1) Numbers
- Profit Ratio
- For creating variable sized bins
2) Dates
- DATEDIFF(date_part, start_date, end_date)
- DATEADD → to increment the specified date
- TODAY() → current Date
- MAKEDATE(2023,01,01): 01/01/2023
3) Strings
- CONTAINS(string, substring): if the string contains the substring
- LEFT(string, num_chars)
- LOWER(string)
- FIND('TABLEAU', 'TU'): 0
- MIN, COUNTD can be applied to string fields
- ZN function is used to replace Null value with Zero
- COUNTD → NULL values are not counted
Split a Field into Multiple Fields
- Only String Fields
1) Split fields automatically (calculated fields)
2) Custom split
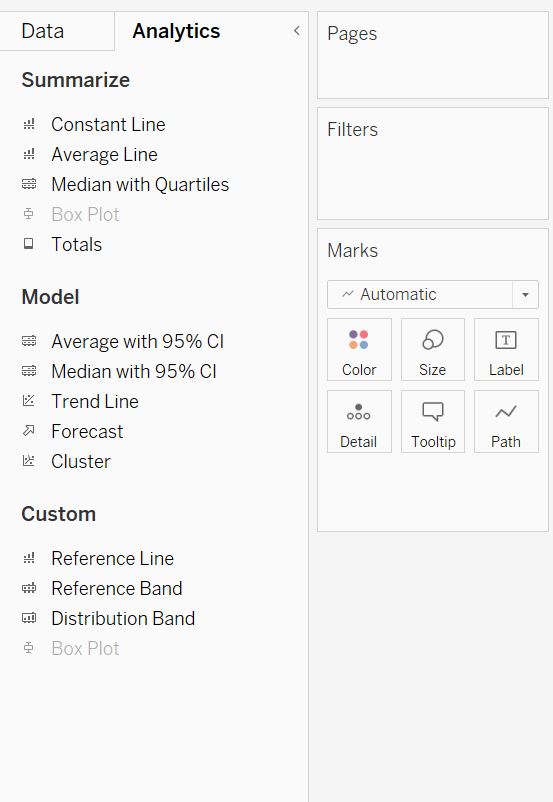
📖 Trend Lines
-
2 measures on opposing axes, or a date and a measure on opposing axes
-
Analytics
- Linear
- Logarithmic
- Exponential
- Polynomial
- Power
-
To add trend lines to a view, both axes must contain a field that can be interpreted as a number.
-
Dates and Time can be read as Numeric by Tableau.
-
Forecasting is designed for in-depth temporal data analysis.
-
Forecasting uses a technique known as exponential smoothing.
📖 Reference Lines and Bands
- add to continuous axis in the view
- Table / Pane / Cell
- Reference bands shade an area behind the marks in the view(starting point, ending point)
Data management features that Tableau offer to enhance analysis
- Data blending, Data pivoting, Data clustering and Data joining
