import pandas as pd
import numpy as np

df = pd.read_excel('sales-funnel.xlsx')
df.head()
pd.pivot_table(df, index=["Name"])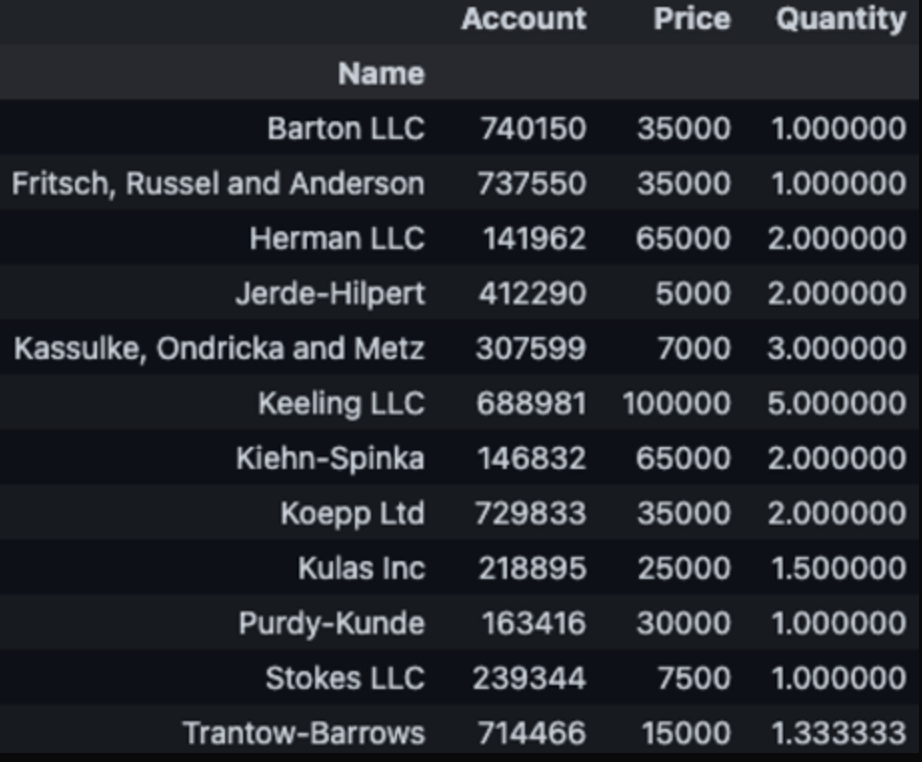
pd.pivot_table(df, index = ["Name","Rep","Manager"])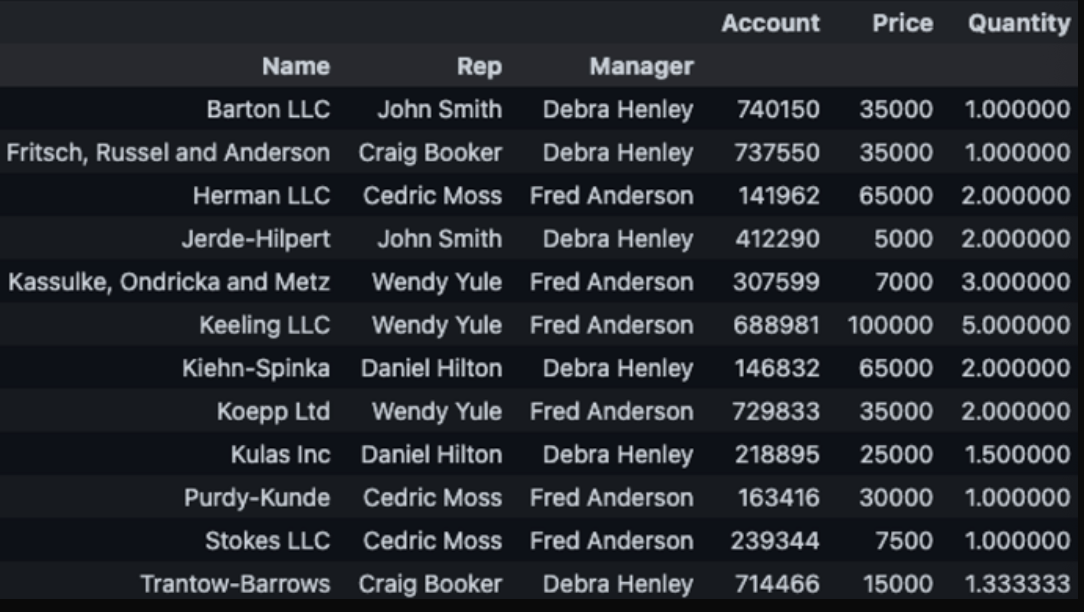
pd.pivot_table(df,index = ["Manager", "Rep"], values=["Price"])
pd.pivot_table(df, index = ["Manager","Rep"], values=["Price"], aggfunc=np.sum)
#aggfunc -> 사용해서 np.sum을 사용하면 된다.
pd.pivot_table(df, index = ["Manager", "Rep", "Product"],
			   values=["Price","Quantity"],
			   aggfunc = [np.sum, np.mean], fill_value = 0, margins = True)

# fill_value는 NaN이 나타나면 0으로 표시를 해라.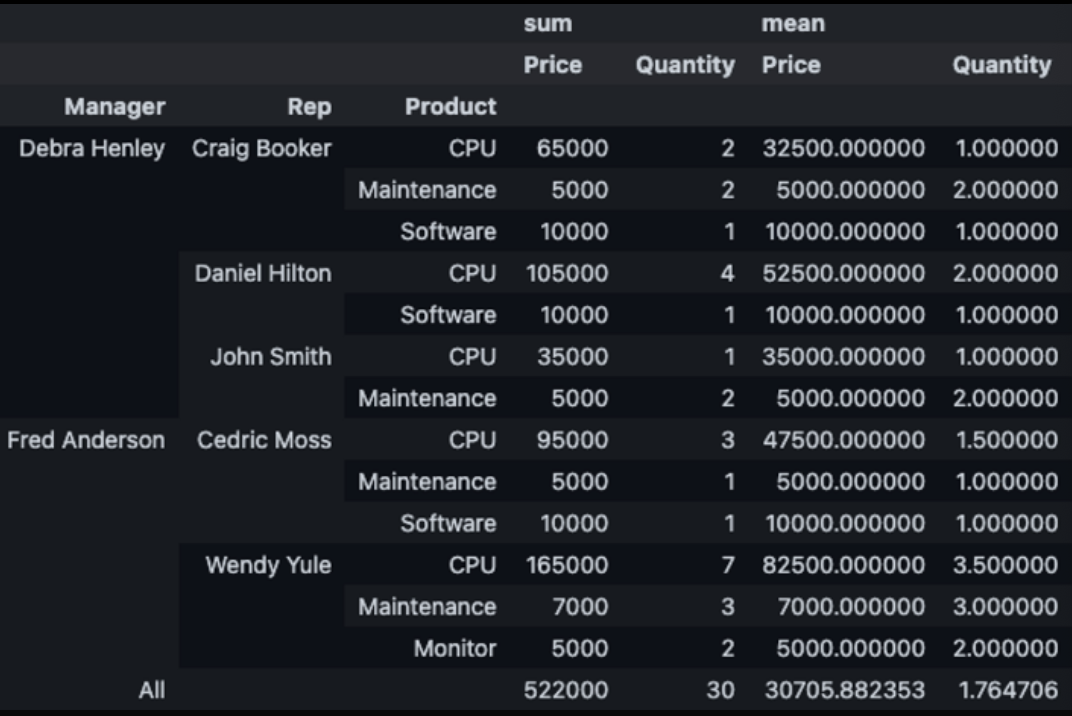
pivot_table을 이용해서 데이터 정리
crime_anal_raw = pd.read_csv("crime_in_Seoul_include_gu_name.csv", encoding='utf-8') crime_anal_raw.head()
crime_anal_raw = pd.read_csv('crime_in_Seoul_include_gu_name.csv',encoding='utf-8', index_col = 0)
crime_anal = pd.pivot_table(crime_anal_raw, index = '구별', aggfunc=np.sum) crime_anal.head()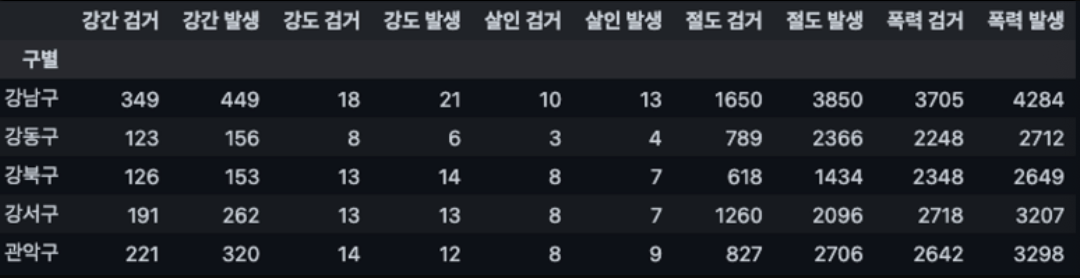

Data Science. DevOps.