이번 글에서 쓰이는 함수 : pd.concat, pd.merge, isnull().sum(), describe(), groupby, pivot_table
데이터 가공 프로세스 공부하기
1. 데이터 읽어들이기
pd.read_csv('데이터 위치', index_col=0) : csv 파일을 읽어오는 함수, index_col=0은 0번째 열을 index로 지정한다는 의미.
- 데이터 다운로드 : https://github.com/wikibook/pyda100
# customer_master : 고객 데이터, item_master : 취급 상품 데이터, transaction_1 : 구매내역 데이터, transaction_detail_1 : 구매내역 상세 데이터
customer_master = pd.read_csv('pyda100-master/1장/customer_master.csv')
item_master = pd.read_csv('pyda100-master/1장/item_master.csv')
transaction_1 = pd.read_csv('pyda100-master/1장/transaction_1.csv')
transaction_detail_1 = pd.read_csv('pyda100-master/1장/transaction_detail_1.csv')
transaction_2 = pd.read_csv('pyda100-master/1장/transaction_2.csv')
transaction_detail_2 = pd.read_csv('pyda100-master/1장/transaction_detail_2.csv')
2. 데이터 결합(세로 방향)
pd.concat([결합 데이터1, 결합 데이터2], ignore_index=True) : 데이터를 세로 방향으로 단순 결합하는데 사용되는 함수
pd.concat : 데이터프레임의 세로 방향 결합
transaction = pd.concat([transaction_1, transaction_2], ignore_index=True)
transaction_detail = pd.concat([transaction_detail_1, transaction_detail_2], ignore_index=True)
transaction.head()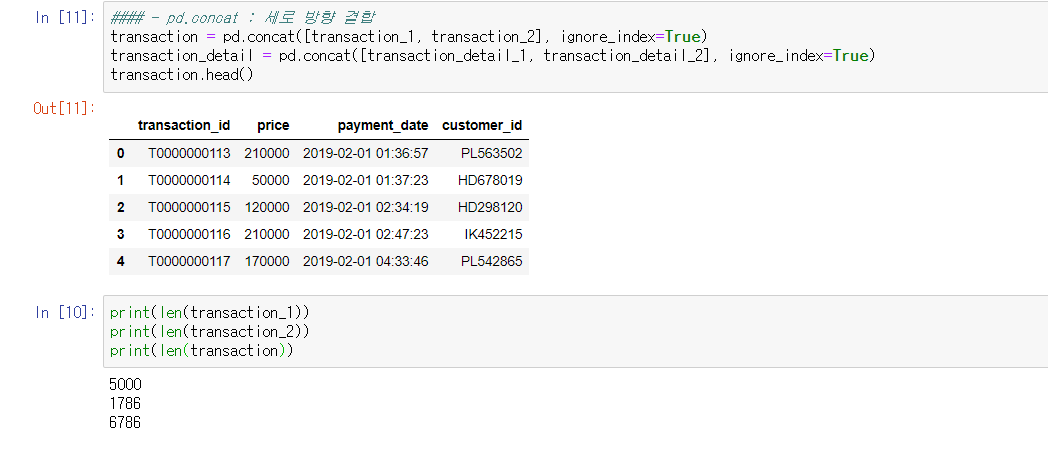
3. 매출 데이터끼리 결합(조인)
pd.merge(데이터1, 데이터2, on='기준 키', how='조인 방식) : 기준 데이터를 결정하여 이를 기준으로 데이터 결합(가로 방향).
join_data = pd.merge(transaction_detail, transaction[["transaction_id",'payment_date', 'customer_id']], on='transaction_id', how='left')
join_data.head()
4. 마스터 데이터를 결합
join_data = pd.merge(join_data, customer_master, on='customer_id', how='left')
join_data = pd.merge(join_data, item_master, on='item_id', how='left')
join_data.head()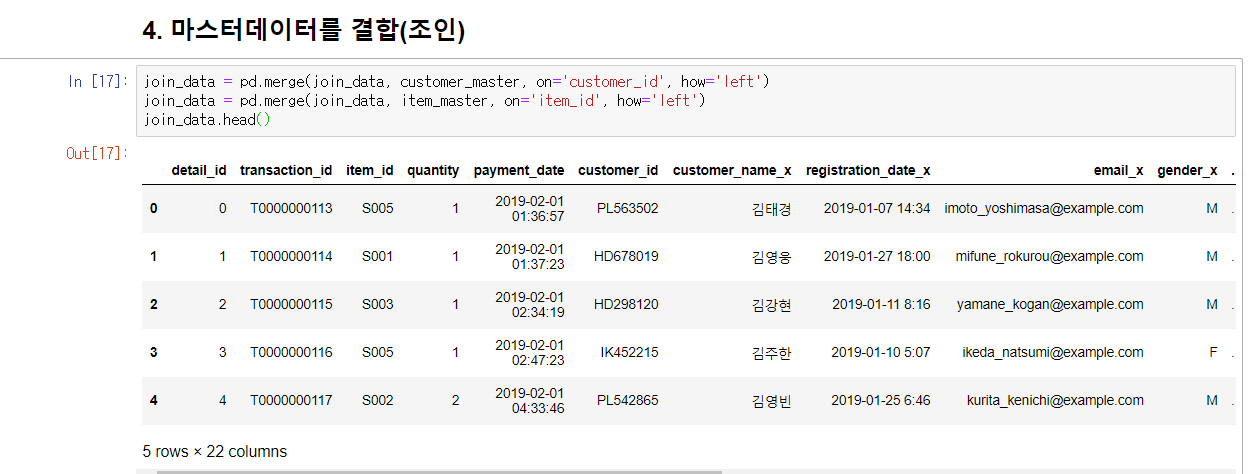
5. 필요한 데이터 컬럼 만들기
df['새로운 컬럼 명'] = 값
위의 형식으로 새로운 컬럼을 만들 수 있음.
join_data['price'] = join_data['quantity'] * join_data['item_price']
join_data[['quantity', 'item_price', 'price']].head()
6. 월별 데이터 집계하기
dataframe.dtypes : 데이터 별 변수의 종류를 알려줌
pd.to_datetime() : datetime 형식으로 변환
groupby('집계하고 싶은 칼럼').집계 방법.표시할 컬럼 : 데이터를 원하는 그룹별로 집계하여 보고자 할 때 사용하는 함수
join_data.dtypes

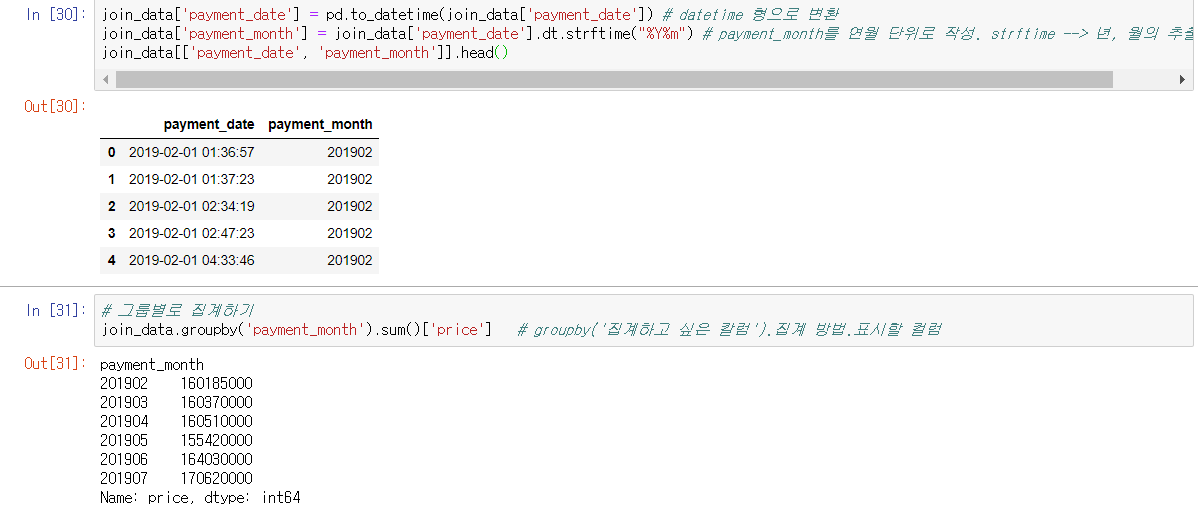
join_data['payment_date'] = pd.to_datetime(join_data['payment_date']) # datetime 형으로 변환
join_data['payment_month'] = join_data['payment_date'].dt.strftime("%Y%m") # payment_month를 연월 단위로 작성. strftime --> 년, 월의 추출이 가능
join_data[['payment_date', 'payment_month']].head()

# 그룹별로 집계하기
join_data.groupby('payment_month').sum()['price']   # groupby('집계하고 싶은 칼럼').집계 방법.표시할 컬럼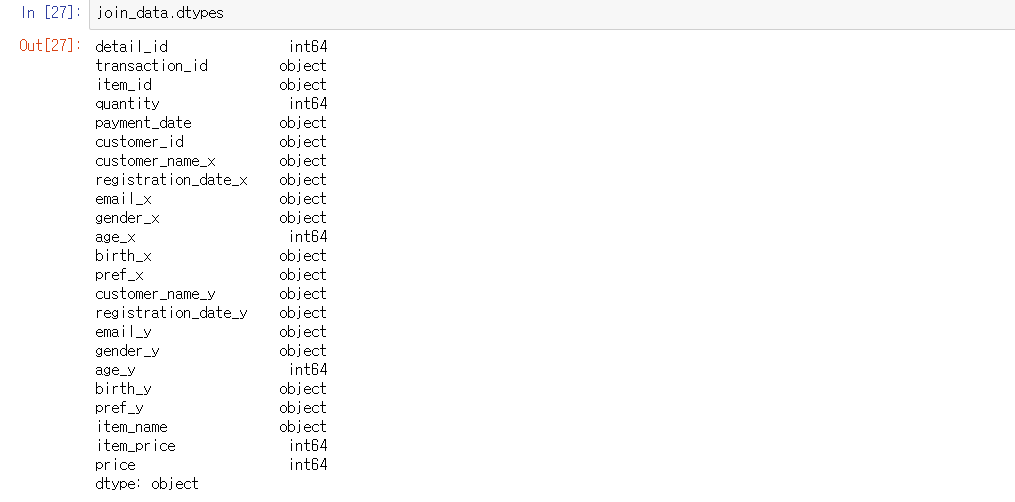
7.월별 상품별로 데이터 집계하기
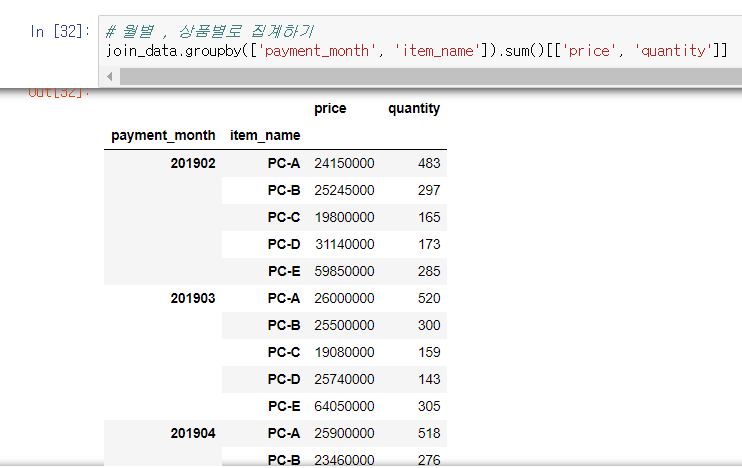
groupby() : group별 데이터 처리
pivot_table() : 데이터 재가공
- groupby에서 출력하고 싶은 칼럼이 여러개 있는 경우 리스트형으로 지정하면 됨.
- pivot_table : 행과 컬럼을 지정할 수 있음. pivot_table(데이터, index='지정 행', columns='지정 열', values='집계하고싶은 열', aggfunc='집계 방식')

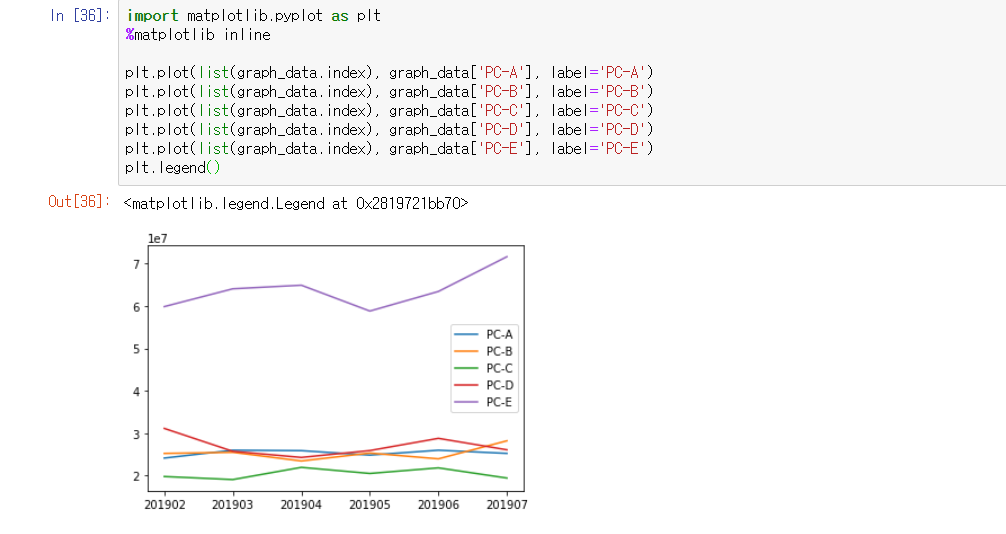
8.상품별 매출 추이를 가시화하기
graph_data = pd.pivot_table(join_data, index='payment_month', columns='item_name', values='price', aggfunc='sum')
graph_data.head()

import matplotlib.pyplot as plt
%matplotlib inline

plt.plot(list(graph_data.index), graph_data['PC-A'], label='PC-A')
plt.plot(list(graph_data.index), graph_data['PC-B'], label='PC-B')
plt.plot(list(graph_data.index), graph_data['PC-C'], label='PC-C')
plt.plot(list(graph_data.index), graph_data['PC-D'], label='PC-D')
plt.plot(list(graph_data.index), graph_data['PC-E'], label='PC-E')
plt.legend()
