
1번 문제
- 수집한 데이터들을 pandas 데이터 프레임으로 정리해주세요.
- 부가 정보 데이터는 셀프 여부와 마찬가지로 Y 또는 N 으로 저장해주세요
- 최종적으로 데이터 프레임에 들어가야할 컬럼은 총 14개로 아래와 같습니다
- 주유소명, 주소, 브랜드, 휘발유 가격, 경유 가격, 셀프 여부, 세차장 여부, 충전소 여부, 경정비 여부, 편의점 여부, 24시간 운영 여부, 구, 위도, 경도
📌 페이지 접근
from selenium import webdriver

url = 'https://www.opinet.co.kr/searRgSelect.do'
driver = webdriver.Chrome(executable_path='../driver/chromedriver.exe')
driver.get(url)
📌 시/도 데이터 가져오기
from selenium.webdriver.common.by import By# 부모 태그 먼저 가져오기
sido_list_raw = driver.find_element(By.CSS_SELECTOR, '#SIDO_NM0')
sido_list_raw.textsido_list_raw.send_keys('서울') 📌 구 데이터 가져오기
# 부모 태그 먼저 가져오기
gu_list_raw = driver.find_element(By.CSS_SELECTOR, '#SIGUNGU_NM0')

# 자식 태그 가져오기
gu_list = gu_list_raw.find_elements(By.TAG_NAME, 'option')

# for() : 하나씩 정보 가져오기
gu_names = [option.get_attribute('value')for option in gu_list]
gu_names = gu_names[1:] # 맨 앞 공백 1개 빼기 위해
gu_names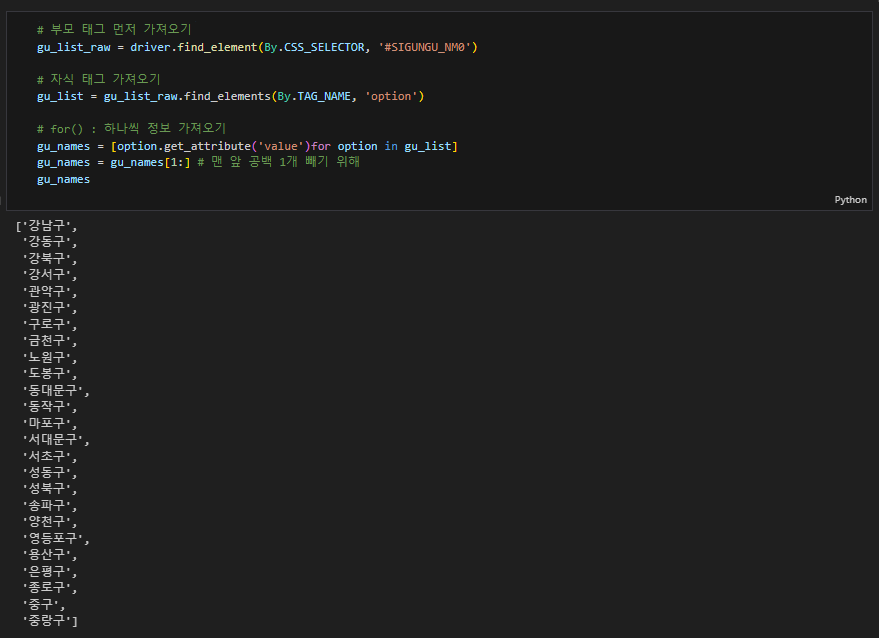
# 구 검색
gu_list_raw = driver.find_element(By.ID, 'SIGUNGU_NM0')
gu_list_raw.send_keys(gu_names[0])
📌 DataFrame
import pandas as pd
import time
import googlemaps
import warnings

from tqdm import tqdm_notebook
from selenium.webdriver.common.by import By

warnings.simplefilter(action='ignore', category=FutureWarning)

gmaps_key = 'AIzaSyALyv5xMRzF_RJUIeJ84qh25GgNWoIJ8LM'
gmaps = googlemaps.Client(key = gmaps_key)
# (1) 브랜드
brandList =[]
# (2) 주유소명
nameList =[]
# (3) 구
gu_locationList =[]
# (4) 주소
addressList =[]
# (5) 휘발유 가격
gasoline_priceList =[]
# (6) 경유 가격
diesel_priceList =[]
# (7) 셀프 여부
selfList =[]
# (8) 세차장 여부
car_washList =[]
# (9) 충전소 여부
chargingList =[]
# (10) 경정비 여부
maintenanceList =[]
# (11) 편의점 여부
storeList =[]
# (12) 24시간 운영 여부
hours24List =[]for gu in tqdm_notebook(gu_names):
# 구 검색
element = driver.find_element(By.ID, 'SIGUNGU_NM0')
element.send_keys(gu)
time.sleep(3)
html = driver.page_source
soup = BeautifulSoup(html, 'html.parser')
# 검색할 주유소 개수
cnt = int(driver.find_element(By.ID, 'totCnt').text)
for i in range(1, cnt+1):
# 각 주유소 클릭
station = driver.find_element(By.CSS_SELECTOR, f'#body1 > tr:nth-child({i}) > td.rlist > a')
station.click()
# time.sleep(1)
html = driver.page_source
soup = BeautifulSoup(html, 'html.parser')
data = soup.select('#os_dtail_info')[0]
# 브랜드
brandList.append(data.select_one('#poll_div_nm').text)
# 주유소명
nameList.append(data.select_one('.header').text.strip())
# 구
gu_locationList.append(gu)
# 주소
addressList.append(data.select_one('#rd_addr').text)
# 휘발유 가격
gasoline_priceList.append(data.select_one('#b027_p').text)
# 경유 가격
diesel_priceList.append(data.select_one('#d047_p').text)
# 셀프
slf = data.select_one('#SPAN_SELF_VLT_YN_ID')
if type(slf.find('img')) == type(None):
selfList.append('N')
else:
selfList.append('Y')
# 세차
cswh = data.select_one('#cwsh_yn')['src']
if 'off' in cswh:
car_washList.append('N')
else:
car_washList.append('Y')
# 충전소
charge = data.select_one('#lpg_yn')['src']
if 'off' in charge:
chargingList.append('N')
else:
chargingList.append('Y')
# 경정비
maint = data.select_one('#maint_yn')['src']
if 'off' in maint:
maintenanceList.append('N')
else:
maintenanceList.append('Y')
# 편의점
cvs = data.select_one('#cvs_yn')['src']
if 'off' in cvs:
storeList.append('N')
else:
storeList.append('Y')
# 24시 영업
sel24 = data.select_one('#sel24_yn')['src']
if 'off' in sel24:
hours24List.append('N')
else:
hours24List.append('Y')
data = {
"brand" : brandList,
"name" : nameList,
"location(gu)" : gu_locationList,
"address" : addressList,
"gasoline_price" : gasoline_priceList,
"diesel_price" : diesel_priceList,
"self" : selfList,
"car_wash" : car_washList,
"charging" : chargingList,
"maintenance" : maintenanceList,
"store" : storeList,
"hours24" : hours24List
}
df = pd.DataFrame(data)
df.head()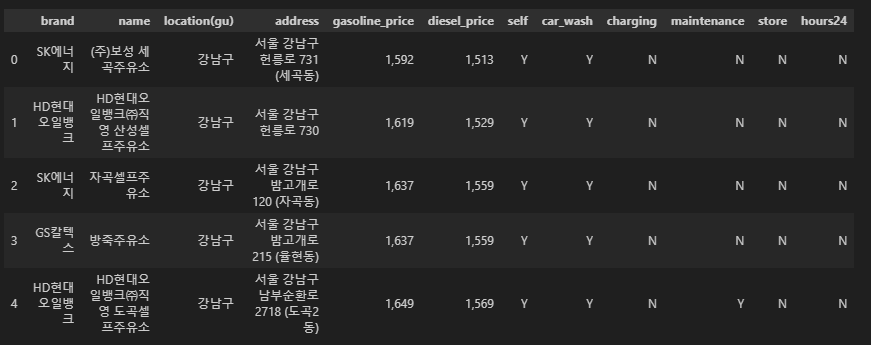
📌 위도/경도 추가
latList = []
lngList = []

for idx, row in df.iterrows():
    address = row["address"]
    gmaps_output = gmaps.geocode(address)
    temp_lat = gmaps_output[0]["geometry"]["location"]["lat"]
    temp_lng = gmaps_output[0]["geometry"]["location"]["lng"]

    latList.append(temp_lat)
    lngList.append(temp_lng)

df["lat"] = latList
df["lng"] = lngList
df.head()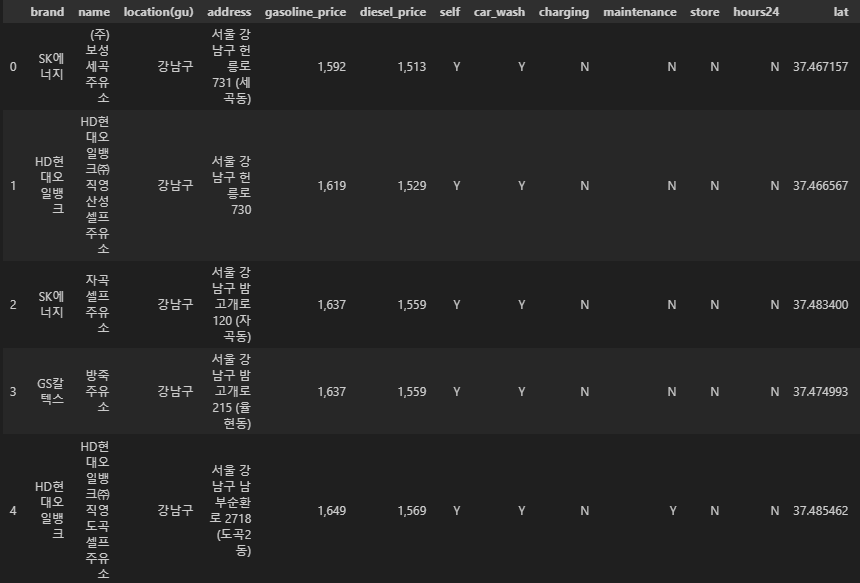
df.tail(2)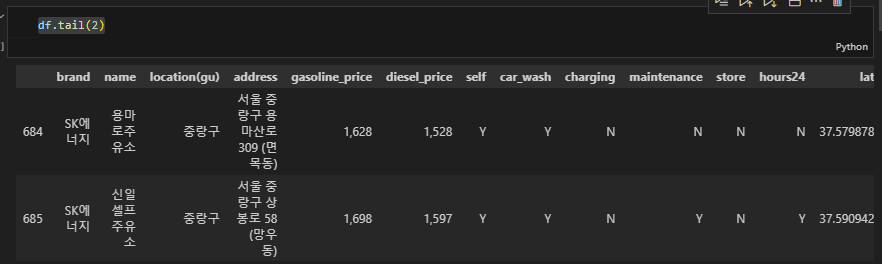
📌 가격 데이터 변환 object > float
df.info()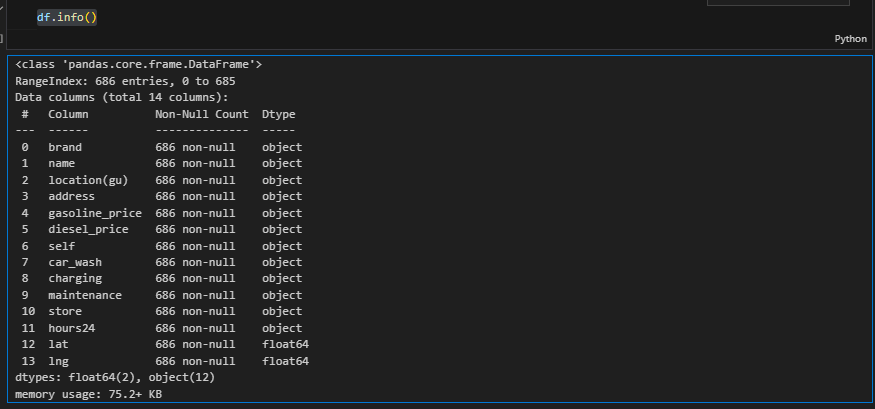
-
▼ 아래 코드 입력 시 'ValueError: could not convert string to float: '1,592'' 에러 발생
# 가격 정보가 없는 주유소
df[df['gasoline_price'] == '-']
df[df['diesel_price'] == '-']

# 가격표가 없는 것들은 사용하지 않는다
df = df[df['gasoline_price'] != '-']
df = df[df['diesel_price'] != '-']

df['gasoline_price'] = df['gasoline_price'].astype('float')
df['diesel_price'] = df['diesel_price'].astype('float')
-
▼ 따옴표 삭제 해봄 : 에러 발생 ''float' object has no attribute 'replace''
def price_float(price): price = price.replace(',') price = float(price) return price -
price = price.replace(',', '') | 로 변경
def price_float(price):
    price = price.replace(',', '')
    price = float(price)

    return price

df['gasoline_price'] = df['gasoline_price'].apply(price_float)
df['diesel_price'] = df['diesel_price'].apply(price_float)df.info()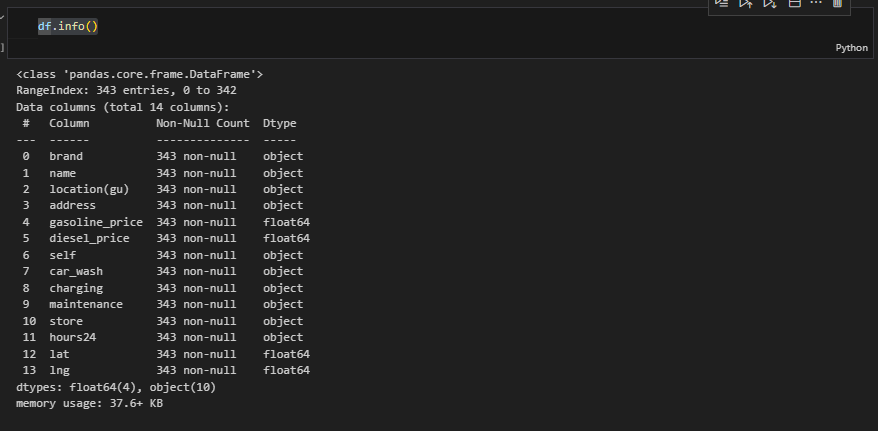
df.tail(2)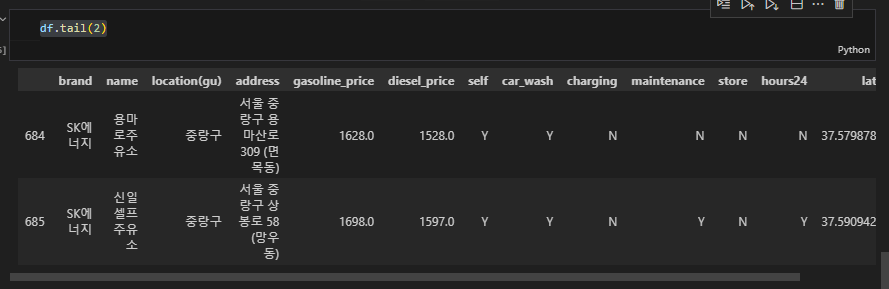
📌 인덱스 재정렬 & 컬럼 삭제
df.reset_index(inplace=True)
df.tail(1)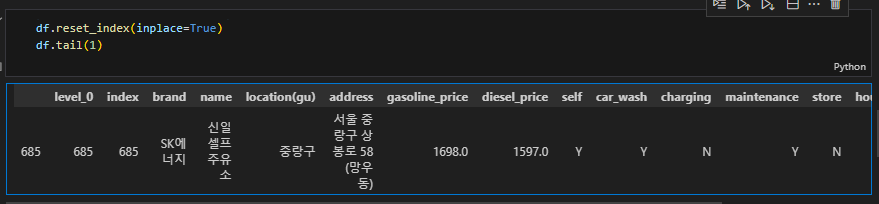
del df['index']
del df['level_0']
df.tail(1)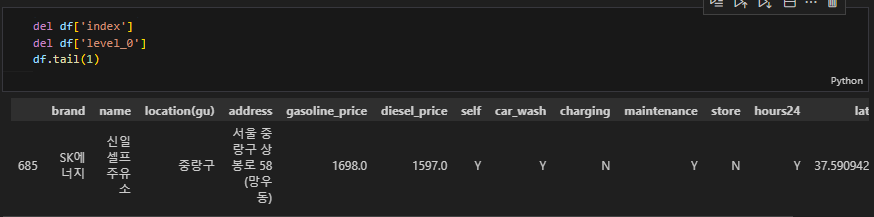
📌 데이터 저장
eda_task_2_raw_dataframe = pd.DataFrame(df)
eda_task_2_raw_dataframe.to_csv('[DS]eda2_eda_task_2_raw_dataframe.csv', index = False, encoding='utf-8')
📌드라이브 종료
driver.quit()2번 문제
- 그리고 다시 한 번, 휘발유와 경유 가격이 셀프 주유소에서 정말 저렴한지 여러분의 분석 결과를 작성해주세요.
- 분석한 결과를 여러분의 jupyter notebook에 markdown 으로 설명해주시면 됩니다.
- 컬럼 이름은, 영문으로 저장해주세요 (-> DataFrame column 명명 다시..)
import matplotlib.pyplot as plt
import seaborn as sns
import platform
from matplotlib import font_manager, rc

get_ipython().run_line_magic("matplotlib", "inline")
%matplotlib inline

path = "C:/Windows/Fonts/malgun.ttf"

rc("font", family="Malgun Gothic")
📌 휘발유(gasoline_price) 가격 비교
- boxplot(_seaborn)
→ 셀프가 더 저렴한 것을 확인할 수 있음
plt.figure(figsize=(4,4))
sns.boxplot(x='self', y='gasoline_price', data=df, palette='Set3')
plt.grid(True)
plt.title("셀프 - 휘발유 가격 단순 비교")
plt.show()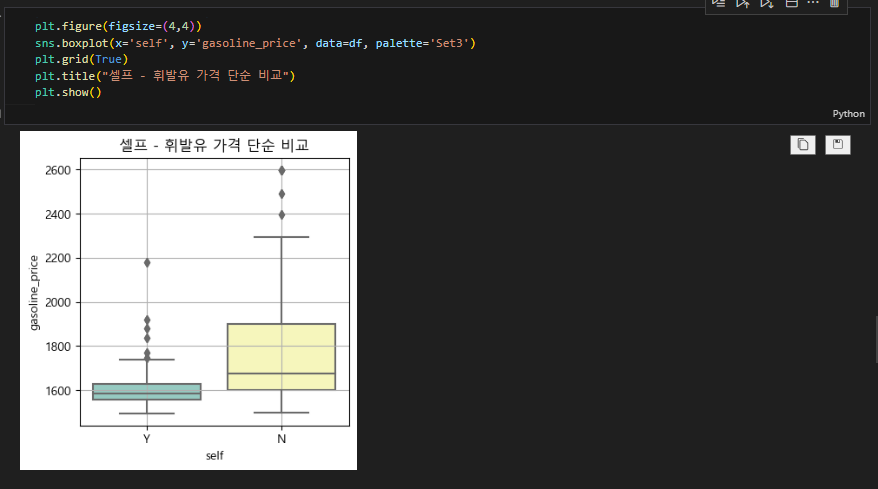
- 브랜드별 비교 (point : hue='self')
→ 모든 브랜드에서 셀프가 더 저렴한 것을 확인할 수 있음
plt.figure(figsize=(7,4))
sns.boxplot(x='brand', y='gasoline_price',  hue='self',data=df, palette='Set3')
plt.grid(True)
plt.title("셀프 여부에 따른 브랜드별 휘발유 가격")
plt.show()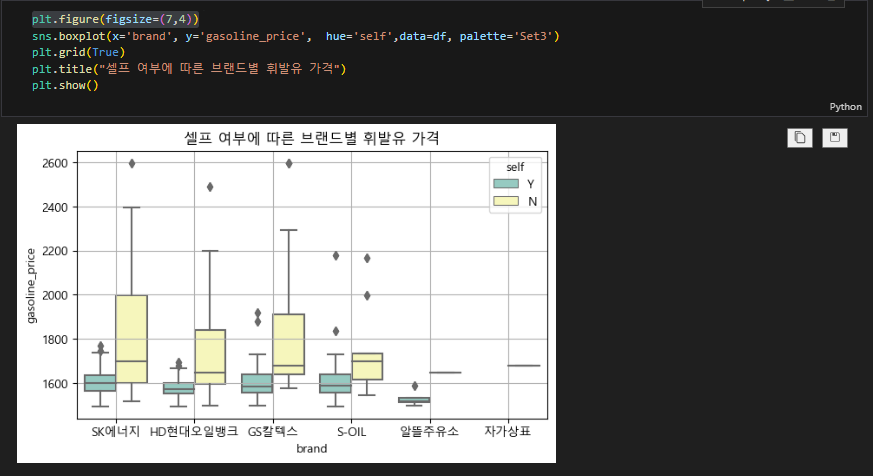
- 지역별 비교
→ 특정 지역(은평구, 양천구, 송파구, 서초구, 금천구)를 제외하면 셀프가 더 저렴한 것을 확인할 수 있음
plt.figure(figsize=(12,4))
sns.boxplot(x='location(gu)', y='gasoline_price',  hue='self',data=df, palette='Set3')
plt.grid(True)
plt.title("셀프 여부에 따른 지역(구)별 휘발유 가격")
plt.xticks(rotation=90) # 이름이 겹치지 않고 세로로 세워지게 하는 기능
plt.show()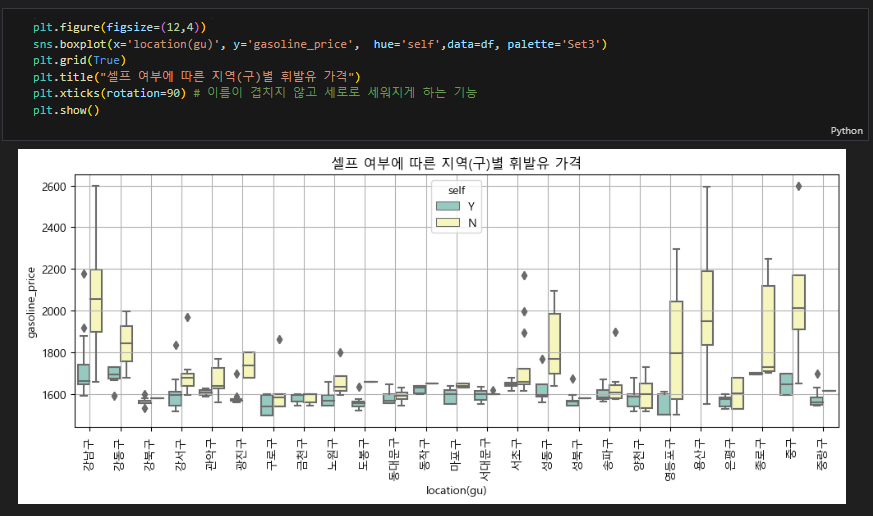
📌 경유(diesel_price) 가격 비교
- boxplot(_seaborn)
→ 셀프가 더 저렴한 것을 확인할 수 있음
plt.figure(figsize=(4,4))
sns.boxplot(x='self', y='diesel_price', data=df, palette='Set1')
plt.grid(True)
plt.title("셀프 - 경유 가격 단순 비교")
plt.show()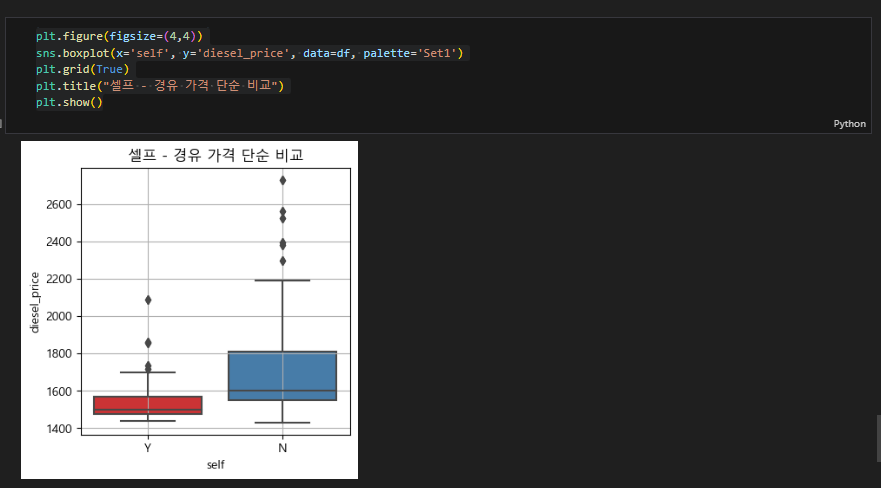
- 브랜드별 비교 (point : hue='self')
→ 모든 브랜드에서 셀프가 더 저렴한 것을 확인할 수 있음
plt.figure(figsize=(7,4))
sns.boxplot(x='brand', y='diesel_price',  hue='self',data=df, palette='Set1')
plt.grid(True)
plt.title("셀프 여부에 따른 브랜드별 경유 가격")
plt.show()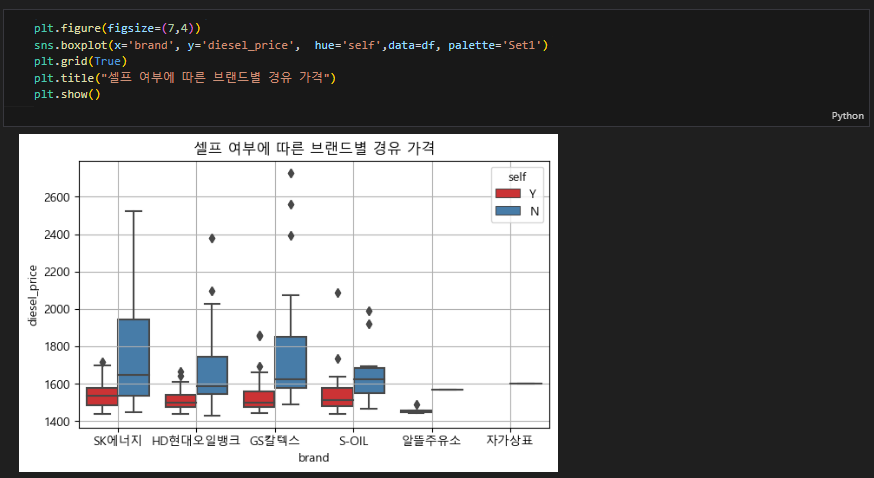
- 지역별 비교
→ 특정 지역(양청구, 동대문구, 금천구)을 제외하면 셀프가 더 저렴한 것을 확인할 수 있음
plt.figure(figsize=(12,4))
sns.boxplot(x='location(gu)', y='diesel_price',  hue='self',data=df, palette='Set1')
plt.grid(True)
plt.title("셀프 여부에 따른 지역(구)별 경유 가격")
plt.xticks(rotation=90) # 이름이 겹치지 않고 세로로 세워지게 하는 기능
plt.show()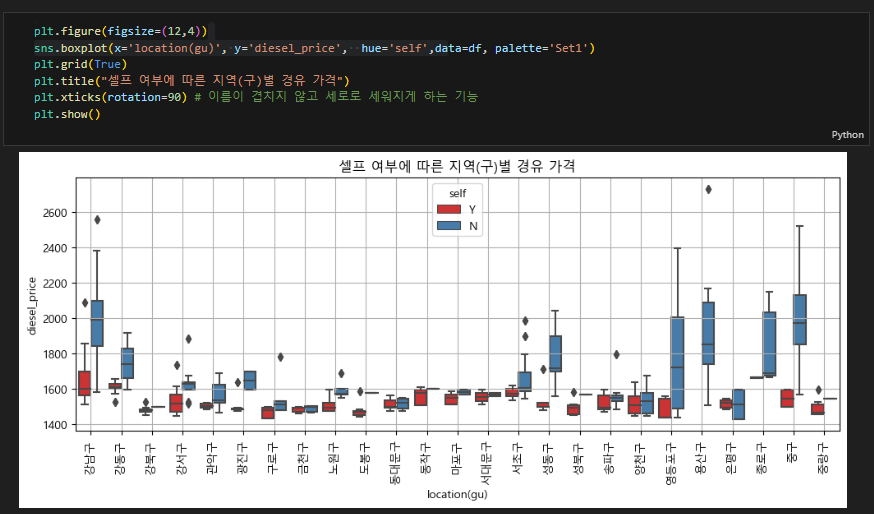
📌 지역(구)별 평균 self 주유(휘발유 & 경유)
import json
import folium
import numpy as np- 셀프 주유 평균 가격 단순 비교
→ 평균 가격도 셀프가 더 저렴한 것을 확인할 수 있음
df['gu_oil_self_avg'] = (df['gasoline_price'] + df['diesel_price']) / 2sns.boxplot(x='self', y='gu_oil_self_avg', data=df, palette='Set2')
plt.grid(True)
plt.show()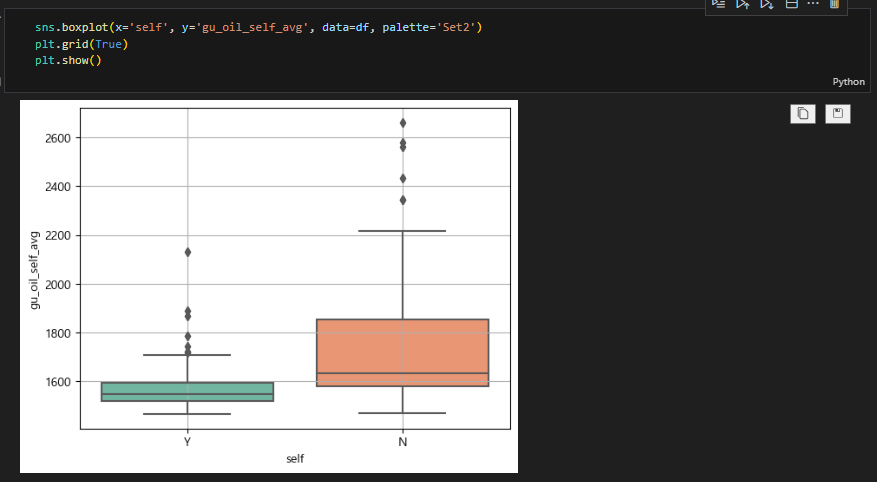
- 셀프 주유 매장수 단순 비교
→ 셀프주유소 매장수(red)가 비교적 많은 것을 확인할 수 있음
geo_path = '../data/02. skorea_municipalities_geo_simple.json'
geo_str = json.load(open(geo_path, encoding='utf-8'))

my_map = folium.Map(location=[37.5502, 126.982], zoom_start=12, tiles='CartoDB positron')

for idx, rows in df.sort_values(by='gu_oil_self_avg', ascending=False).iterrows():
    if rows['self'] == 'Y':
        osColor = 'red'

    elif rows['self'] == 'N':
        osColor = 'black'

    folium.Circle(
        location = [rows['lat'], rows['lng']],
        radius=1,
        color=osColor,
    ).add_to(my_map)

my_map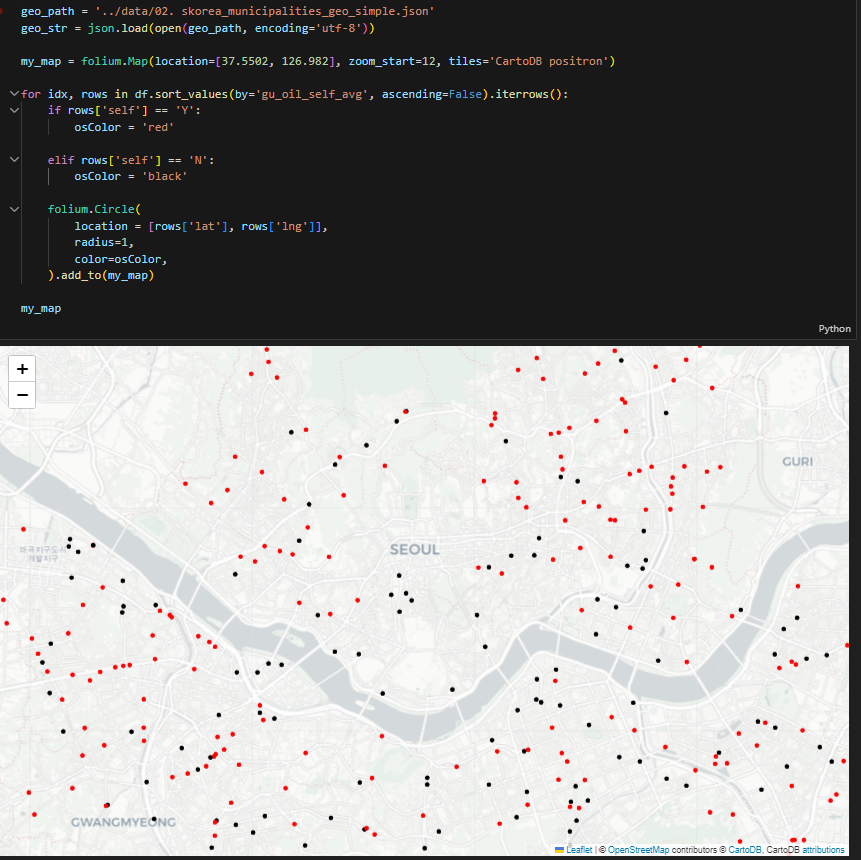

비전공자의 데이터 공부법