🌐 개요
- 은행 마케팅 데이터 분석 및 정기 예금 가입 가능성 예측
- 결정트리와 앙상블 기법을 사용하여 분류 모델을 구축하고, 마케팅 캠페인의 효율성을 높이는 전략을 모색한다.
- 2008년부터 2010년까지의 은행 마케팅 캠페인 데이터를 포함하고 있다.이 데이터를 통해 고객이 정기예금을 가입할 가능성을 예측하고, 이를 통해 마케팅 캠페인의 효율성을 높이는 것이 목표이다. 어떤 상황에서 어떤 고객들이 정기 예금을 가입할까?
- 분류 모델을 개발하여 고객이 정기 예금을 가입할지 여부를 예측하고, 그 모델을 도출한 인사이트를 바탕으로 비즈니스 전략 제시
📊 사용 데이터 셋
- bank_additional_full.csv
- 해당 데이터는 UC Irvine Machine Learning Repository에서 제공하는 Bank Marketing(링크) 데이터이다. 여러 데이터 중 2014년 아래 논문에서 사용된 데이터를 선택하였다.
- 데이터 출처
Moro, S., Cortez, P., & Rita, P. (2014). A Data-Driven Approach to Predict the Success of Bank Telemarketing. Decision Support Systems, In press, http://dx.doi.org/10.1016/j.dss.2014.03.001
| 컬럼명 | 설명 |
|---|---|
| age | 나이 (숫자) |
| job | 직업 (범주형) |
| marital | 결혼 여부 (범주형) |
| education | 교육 수준 (범주형) |
| default | 신용 불량 여부 (범주형) |
| housing | 주택 대출 여부 (범주형) |
| loan | 개인 대출 여부 (범주형) |
| contact | 연락 유형 (범주형) |
| month | 마지막 연락 월 (범주형) |
| day_of_week | 마지막 연락 요일 (범주형) |
| duration | 마지막 연락 지속 시간, 초 단위 (숫자) |
| campaign | 캠페인 동안 연락 횟수 (숫자) |
| pdays | 이전 캠페인 후 지난 일수 (숫자) |
| previous | 이전 캠페인 동안 연락 횟수 (숫자) |
| poutcome | 이전 캠페인의 결과 (범주형) |
| emp.var.rate | 고용 변동률 (숫자) |
| cons.price.idx | 소비자 물가지수 (숫자) |
| cons.conf.idx | 소비자 신뢰지수 (숫자) |
| euribor3m | 3개월 유리보 금리 (숫자) |
| nr.employed | 고용자 수 (숫자) |
| y | 정기 예금 가입 여부 (이진: yes=1, no=0) |
🔍 데이터 셋 EDA
결측치 처리
def fill_unknown_values(df, target_column):
    # Create a copy of the DataFrame to avoid modifying the original
    df = df.copy()

    # Separate rows with and without 'unknown' in the target column
    known_rows = df[df[target_column] != 'unknown']
    unknown_rows = df[df[target_column] == 'unknown']

    # Encode categorical target column if it's categorical
    target_is_categorical = df[target_column].dtype == 'object' and target_column != 'unknown'
    if target_is_categorical:
        label_encoder = LabelEncoder()
        known_rows[target_column] = label_encoder.fit_transform(known_rows[target_column])

    # Prepare training features (X) and target (y)
    X = known_rows.drop(columns=[target_column])
    y = known_rows[target_column]

    # Prepare the features for unknown rows
    X_unknown = unknown_rows.drop(columns=[target_column])

    # Handle categorical features
    X = pd.get_dummies(X)
    X_unknown = pd.get_dummies(X_unknown)

    # Align columns in case dummy variables are mismatched
    X, X_unknown = X.align(X_unknown, join='left', axis=1)
    X_unknown = X_unknown.fillna(0)  # Fill missing dummies with 0

    # Train the model
    if target_is_categorical:
        model = RandomForestClassifier(random_state=42)
    else:
        model = RandomForestRegressor(random_state=42)

    model.fit(X, y)

    # Predict the 'unknown' values
    predictions = model.predict(X_unknown)

    # Convert predictions back to original labels if target was categorical
    if target_is_categorical:
        predictions = label_encoder.inverse_transform(predictions.astype(int))

    # Replace 'unknown' values in the original DataFrame
    df.loc[df[target_column] == 'unknown', target_column] = predictions

    return df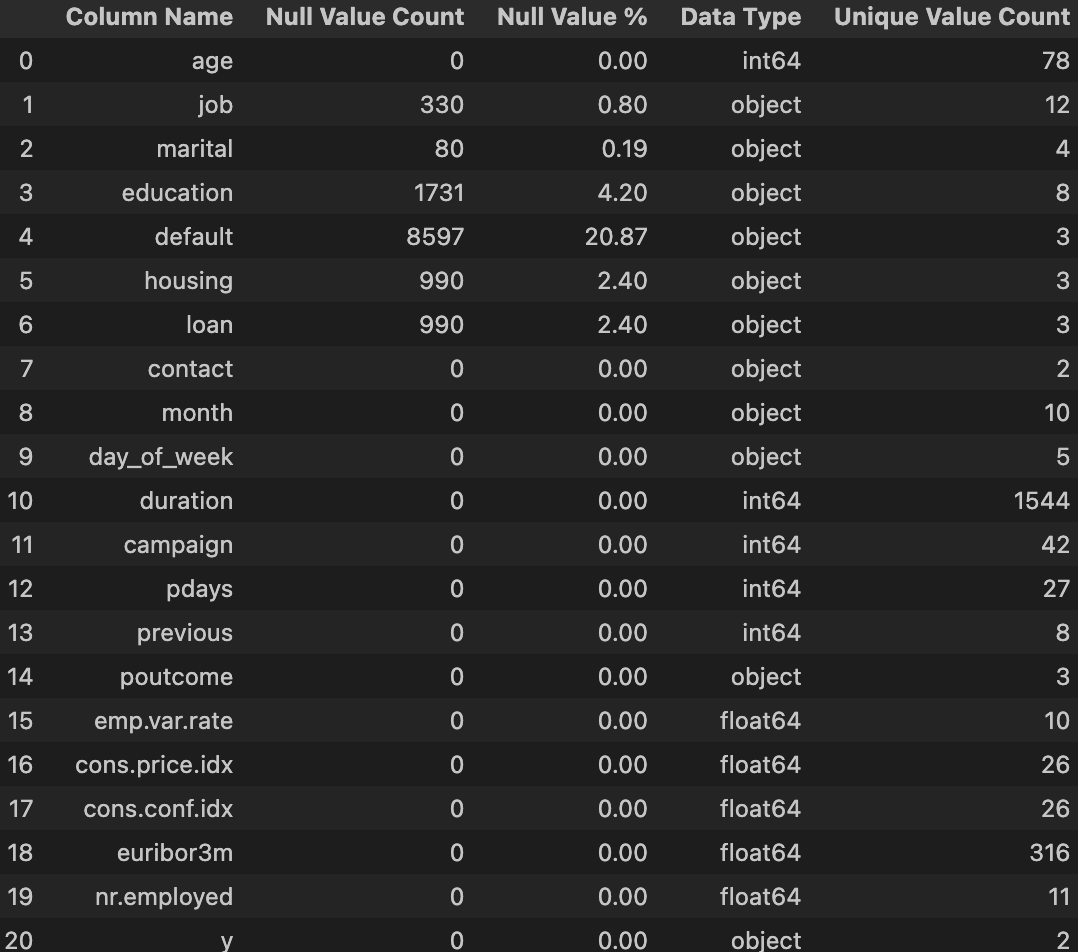
- unknown 값을 포함하고 있는 로우는 총 6개(job, marital, education, default, housing, loan)
- 개인정보이기 때문에 답변을 꺼리는 사람들이 있을거라고 판단하고 모델링을 돌려 비어있지 않은 로우들을 학습시켜 비어있는 값들을 채움.
def fill_unknown_values(df, target_column):
    # Create a copy of the DataFrame to avoid modifying the original
    df = df.copy()

    # Separate rows with and without 'unknown' in the target column
    known_rows = df[df[target_column] != 'unknown']
    unknown_rows = df[df[target_column] == 'unknown']

    # Encode categorical target column if it's categorical
    target_is_categorical = df[target_column].dtype == 'object' and target_column != 'unknown'
    if target_is_categorical:
        label_encoder = LabelEncoder()
        known_rows[target_column] = label_encoder.fit_transform(known_rows[target_column])

    # Prepare training features (X) and target (y)
    X = known_rows.drop(columns=[target_column])
    y = known_rows[target_column]

    # Prepare the features for unknown rows
    X_unknown = unknown_rows.drop(columns=[target_column])

    # Handle categorical features
    X = pd.get_dummies(X)
    X_unknown = pd.get_dummies(X_unknown)

    # Align columns in case dummy variables are mismatched
    X, X_unknown = X.align(X_unknown, join='left', axis=1)
    X_unknown = X_unknown.fillna(0)  # Fill missing dummies with 0

    # Train the model
    if target_is_categorical:
        model = RandomForestClassifier(random_state=42)
    else:
        model = RandomForestRegressor(random_state=42)

    model.fit(X, y)

    # Predict the 'unknown' values
    predictions = model.predict(X_unknown)

    # Convert predictions back to original labels if target was categorical
    if target_is_categorical:
        predictions = label_encoder.inverse_transform(predictions.astype(int))

    # Replace 'unknown' values in the original DataFrame
    df.loc[df[target_column] == 'unknown', target_column] = predictions

    return df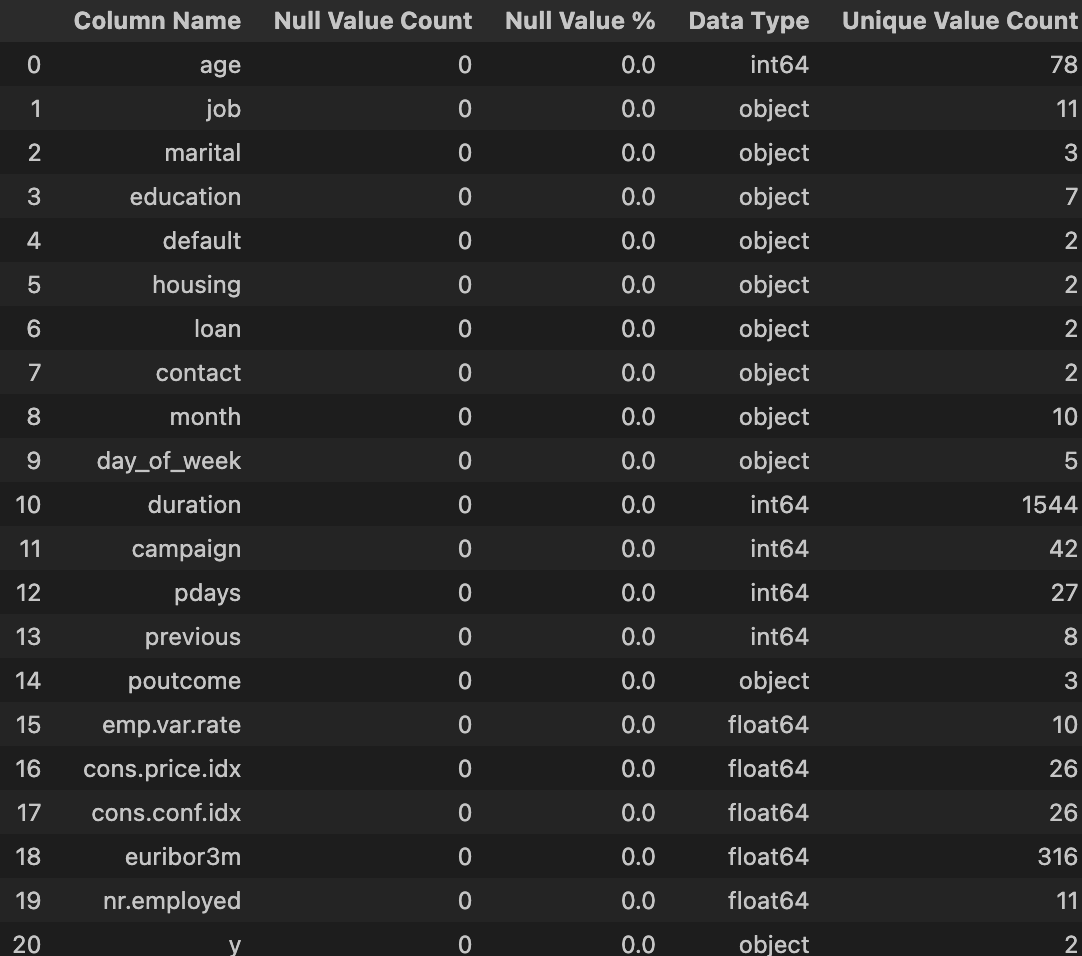
코드설명
1. unknown 값이 있는 행과 없는 행 분리
- kwnon_rows : target_column 에 unknown 이 아닌 값을 가진 행
- unknown_rows : target_column 에 unknown 값을 가진 행
- 대상 열이 범주형인지 확인
- target_is_categorical : 대상 열(target_column)이 범주형(string) 인지 확인
- 범주형인 경우, LabelEncoder를 사용해 문자열 값을 숫자로 변환한다. 이는 머신러닝 모델이 숫자 데이터를 더 잘 처리하기 때문이다.
- 학습용 데이터 타켓 데이터 준비
- X : 대상 열을 제외한 모든 열(독립변수)
- y : 대상 열 (종속변수)
- 예측용 데이터 준비
- X_unknown : 대상 열을 제외한 unknown 행의 모든 열
- 범주형 열 처리
- pd.get_dummies : 범주형 데이터를 원-핫 인코딩하여 숫자형 데이터로 변환
- 열 정렬 : 원-핫 인코딩 후 X와 X_unknown 의 열 구성을 일치 시킨다. 만약 X_unknown에 없는 열이 있다면 0으로 채운다.
- 모델학습
- RandomForestClassifier : 대상 열이 범주형일 때 사용
- RandomForestRegressor : 대상 열이 숫자형일 때 사용
- X와 y를 사용하여 모델을 학습시킨다.
- unknown 값 예측
- 학습된 모델을 사용해 target_column에 unknown 값을 가진 행을 예측한다.
- 예측값을 원래 레이블로 변환
- 대상 열이 범주형이라면, 예측된 숫자값에 원래 레이블(문자열)로 변환
- unknown 값 대체
- 원본 데이터프레임에서 target_column의 unknown 값을 예측된 값으로 교체.
- 결측치를 다 채우고 나면 NULL Value Count에 값이 남지 않는다.
데이터 분포 시각화
- 정기예금 가입 나잇대 분포도
labels=df['y'].value_counts().index
values=df['y'].value_counts().values

plt.figure(figsize = (8, 6))
ax = sns.barplot(x=labels, y=values)
for i, p in enumerate(ax.patches):
    height = p.get_height()
    ax.text(p.get_x()+p.get_width()/2., height + 0.1, values[i],ha="center")

plt.xlabel('')
plt.title('Has The Client Subscribed a Term Deposit?')
plt.tight_layout()
plt.show()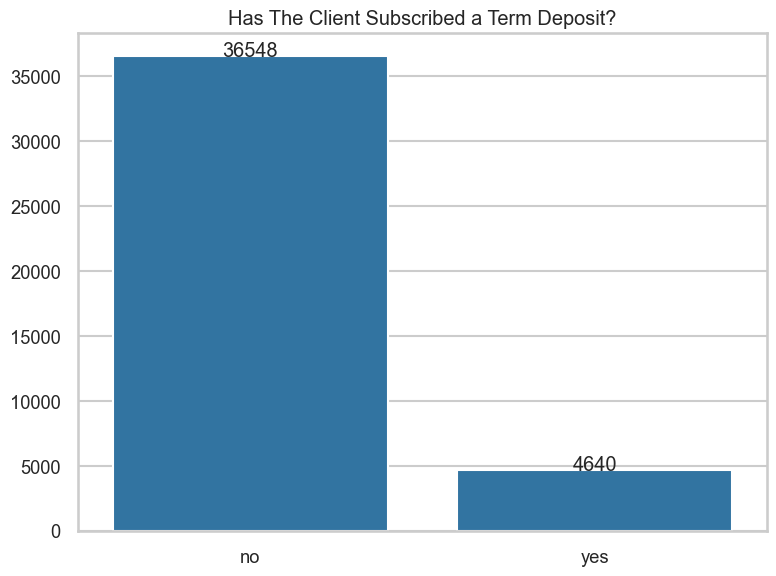
plt.figure(figsize = (10, 12))
plt.style.use('default')
g = sns.displot(data=df, x='age', hue='y', bins=30, kde = False, legend=False)

plt.title('Age Distribution')
plt.xlabel('Age')

plt.legend(title='Subscribed Term', loc='upper right', labels=['yes', 'no'])
plt.show()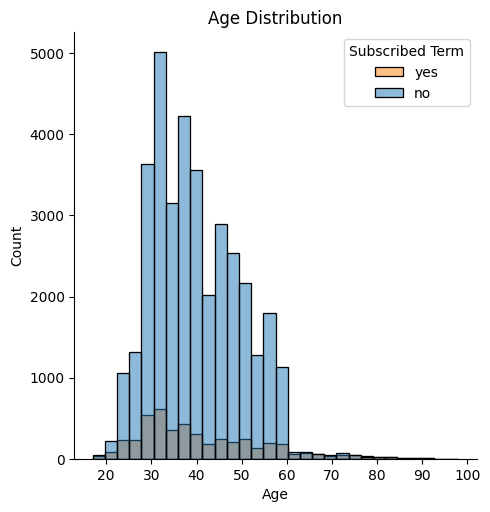
fig, axes = plt.subplots(1, 2)
plt.style.use('default')

#define figure size
sns.set(rc={"figure.figsize":(8, 4)})

sns.histplot(df.loc[df['y']=='yes']['age'], bins=30, kde = True,color='#ffa54c' , ax=axes[0])
axes[0].set_xlabel("Age", fontsize = 10)
axes[0].set_title('Age Distribution (Yes)')

sns.histplot(df.loc[df['y']=='no']['age'], bins=30, kde = True, color='#539100', ax=axes[1])
axes[1].set_xlabel("Age", fontsize = 10)
axes[1].set_ylabel('')
axes[1].set_title('Age Distribution (No)')

plt.show()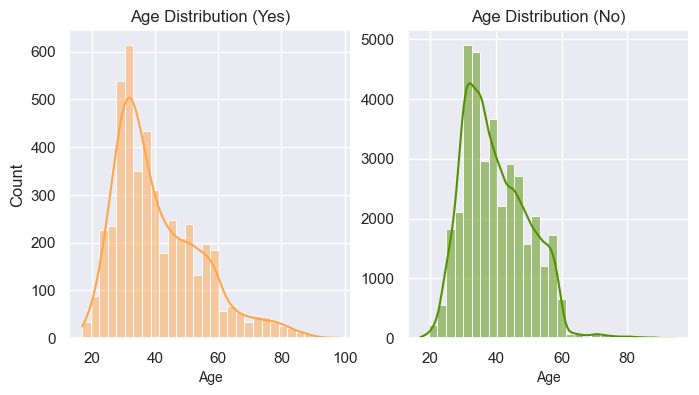
yes_data = df.loc[df['y']=='yes']

sns.set_style('darkgrid')
g = sns.boxplot(data=yes_data,y='y',x='age',orient = 'h', color = '#bb1587')
g.set_title('Age Distribution (Yes)')

plt.show(g)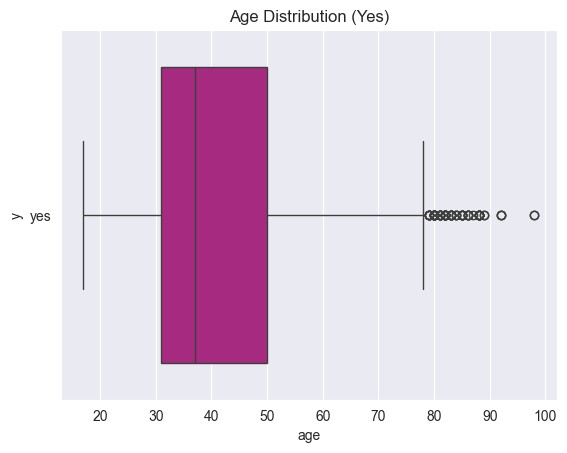
- 정기예금에 가입한 인원들의 평균 나이는 30에서 50대에 분포한다. 이것은 실제로 경제활동을 하는 나잇대에 해당된다.
grid_layout = sns.FacetGrid(df, col = 'job', hue='y', col_wrap = 3)
grid_layout.map(plt.hist, 'age')
plt.title('Job Distribution')
plt.show()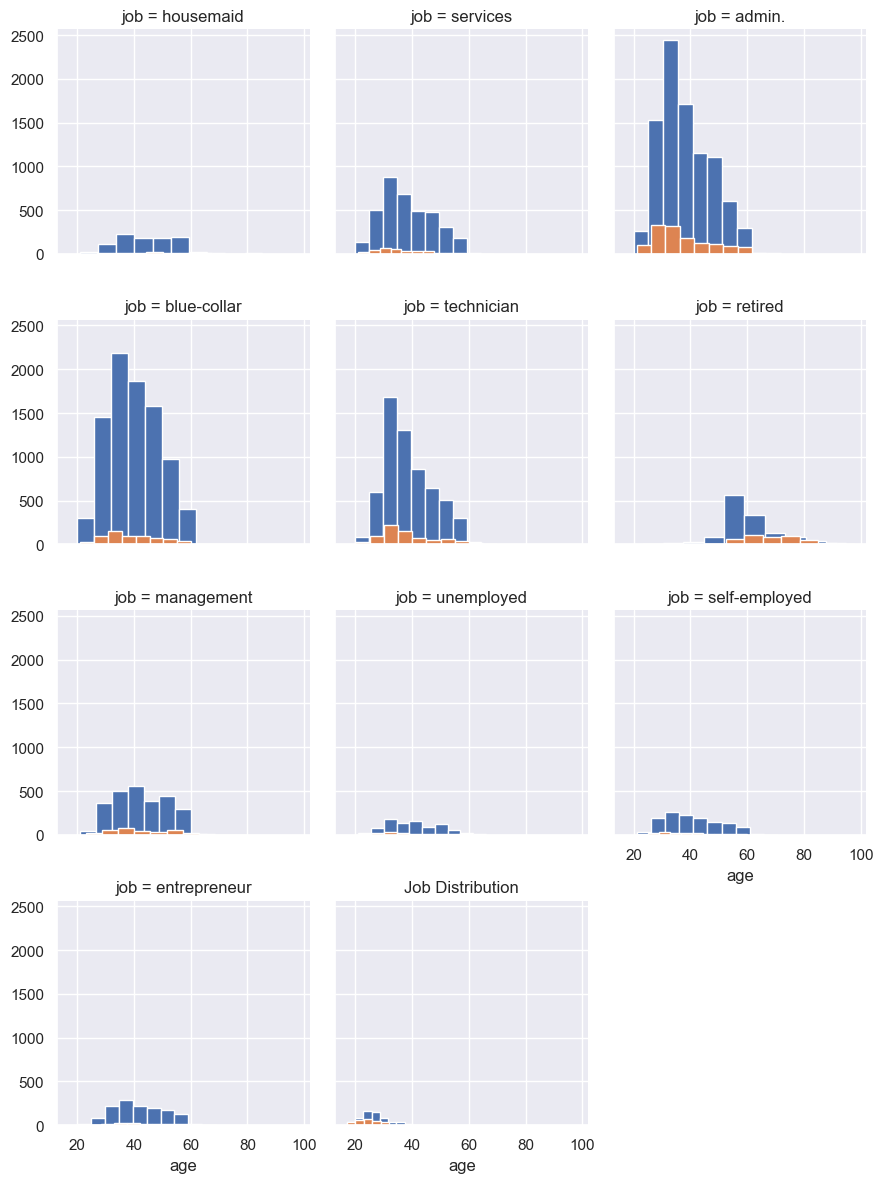
grid_layout = sns.FacetGrid(df, col = 'education', hue='y', col_wrap = 4)
grid_layout.map(plt.hist, 'age');
grid_layout = sns.FacetGrid(df, col = 'marital', hue='y', col_wrap = 4)
grid_layout.map(plt.hist, 'age');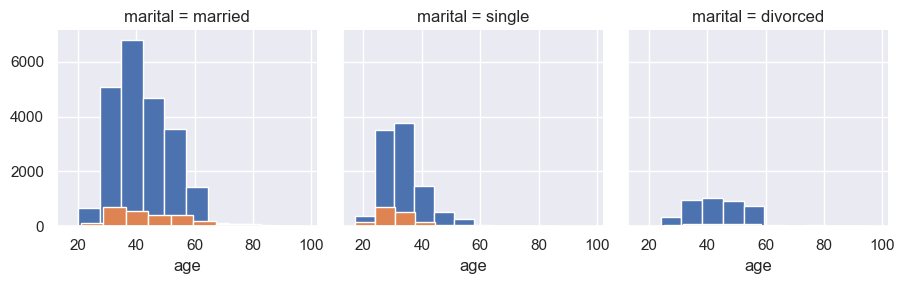
- 결혼한 사람들은 정기 예금 가입률이 높다.
palette = sns.color_palette("tab10", n_colors=df['education'].nunique())

# Countplot with the generated palette
sns.countplot(data=df, y='education', order=df['education'].value_counts().index, palette=palette)
plt.ylabel('Education')
plt.title('Education Level')
plt.show()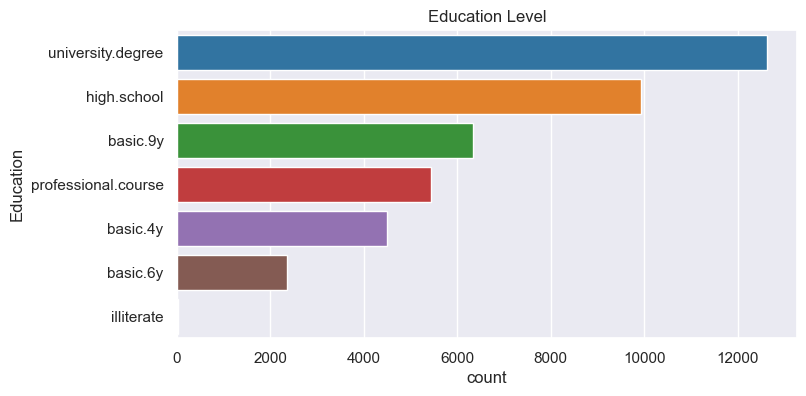
sns.set_style('darkgrid')

# Use a palette to assign different colors to each education level
palette = sns.color_palette("husl", n_colors=yes_data['education'].nunique())

g = sns.boxplot(data=yes_data, y='education', x='age', orient='h', palette=palette)

g.set_xlabel('Age')
g.set_ylabel('Education Level')
g.set_title('Age Distribution of Education of those Subscribed Loan Deposit')

plt.show()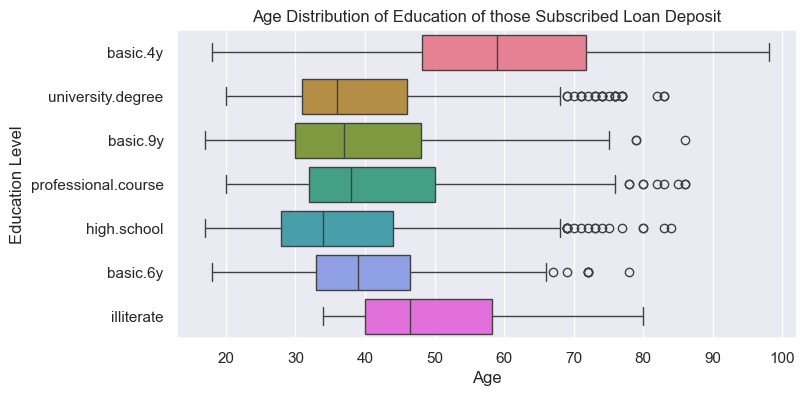
- 직업 및 연령 상관 관계
- 젊은 개인은 '학생' 및 '서비스'와 같은 직업에서 우세한 반면, 노년 개인은 '은퇴' 및 '지영업'에서 두드러짐. 이는 연령별 선호도와 재정적 필요성 시사
- 타겟 전략
- '관리' 와 '기술자'와 같은 직업은 상당한 가입자 수와 재정적 안정성으로 마케팅 캠페인의 주요 타겟이 될 수 잇음.
- '실업자'와 '가정부'와 같은 대표성이 낮은 범주의 경우 교육 캠페인 및 소액 금융 옵션이 참여를 개선할 수 있따.
- 잠재적 가능성
- 맞춤형 금융 상품을 제공하여 대표성이 낮은 직업의 참여를 장려
- 은퇴 또는 장기 금융 계획 서비스를 통해 신체적으로 힘든 직업(블루칼라,가정부)에 종사하는 노년 개인과 같은 이상치 해결
- 상관관계 히트맵
- emp.var.rate, euribor3m, nr.employed와 같은 경제 지표는 높은 상관관계를 가지고 있으며 모델링의 핵심 변수가 될 수 있다.
- 구독 상태별 통화 시간
- 통화 시간이 길수록 구독 성공률이 높다.
- 마케팅 팀이 구독 사능성을 극대화하기 위해 통화 품질과 고객 참여에 집중해야 한다.
- 통화기간(구독vs비구독)
- 두 그룹간의 통화 기간이 상당히 다르므로 예측 기능으로서의 중요성을 강조한다.
- 모델 성능의 왜곡을 방지하기 위해 전처리 중에 이상치를 신중하게 고려해야한다.
소비자 물가지수와 고용 변동률간의 상관계수는 여전히 높아 모델링시 유의해야한다.
- 모델은 다수 'no'클래스를 크게 선호하고 소수 'yes'클래스에서는 성과가 좋지 않음
- 계층 불균형은 심각한 문제이며 리샘플링, 계층 가중치 또는 고급 모델링 기술을 사용하여 해결해야 한다.
- 소수 계층(yes)에 대한 정밀도, 재현율, f1 점수는 모델을 더 잘 평가하기 위해 정확도보다 우선시 해야한다.