Human Protein Atlas Image Classification
human-protein-atlas-image-classification
- Multi-class classificationi (image)
- 현미경 이미지에서 혼합된 단백질 패턴 분류
- 목표 : 단백질 소기관 위치 label(28개) 분류
📌 데이터 탐색 -> 모델 구성 -> 모델 훈련 -> 평가 -> 예측
1. 데이터 탐색
데이터
필요한 것들 import
import numpy as np # linear algebra
import pandas as pd # data processing, CSV file I/O (e.g. pd.read_csv)
from PIL import Image
import matplotlib.pyplot as plt
import os
import keras
from sklearn.model_selection import train_test_split
import tensorflow as tf
import cv2
from keras import applications
from keras.layers import Conv2D, MaxPooling2D, Flatten, Dense, Dropout, Input
from keras.models import Model
from keras.optimizers import Adam
train.csv를 불러와서 5줄만 확인해본다
dataframe = pd.read_csv('/kaggle/input/human-protein-atlas-image-classification/train.csv')
dataframe.head(5)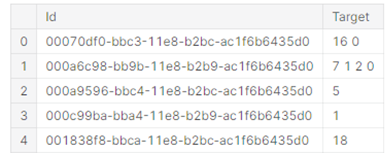
train에는 각각의 id와 target (단백질 기관)을 확인할 수 있다.
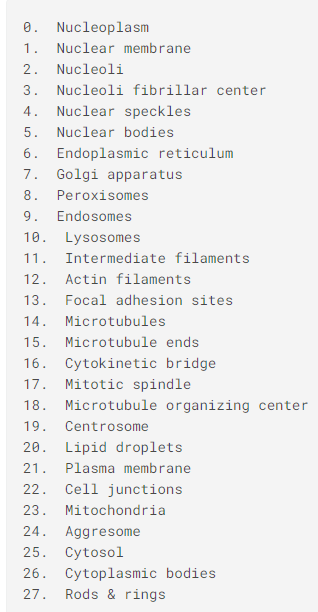
즉, index 2번의 경우 target이 5이므로 Nuclear bodies 인 것을 알 수 있다.
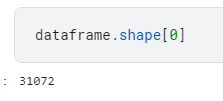
또한 31072개의 데이터가 있다는 것을 확인할 수 있다.
INPUT_SHAPE = (512, 512, 3)
BATCH_SIZE = 16
path_to_train = '/kaggle/input/human-protein-atlas-image-classification/train/'
dataframe의 complete_path를 위에서 설정한 path_to_train (경로) + id를 붙여준다.
dataframe["complete_path"] = path_to_train + dataframe["Id"]
dataframe.head(5)
path_id_train 경로에 있던 것들이 complete_path에 잘 들어간 것을 확인할 수 있다.
실제 경로에 있는 것과 비교하면 왜 complete_path를 저렇게 하는지 알 수 있다.
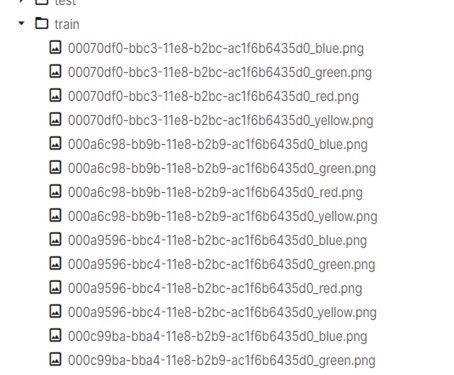
데이터 확인
import random
fig, axes = plt.subplots(3, 4, figsize=(10, 10))
for i in range(3):
    for j in range(4):
        idx = random.randint(0, dataframe.shape[0])
        row = dataframe.iloc[idx,:]
        path = row.complete_path
        red = np.array(Image.open(path + '_red.png'))
        green = np.array(Image.open(path + '_green.png'))
        blue = np.array(Image.open(path + '_blue.png'))
        im = np.stack((
                red,
                green,
                blue),-1)
        axes[i][j].imshow(im)
        axes[i][j].set_title(row.Target)
        axes[i][j].set_xticks([])
        axes[i][j].set_yticks([])
fig.tight_layout()
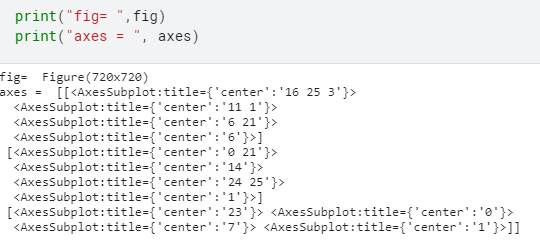
fig.show(5)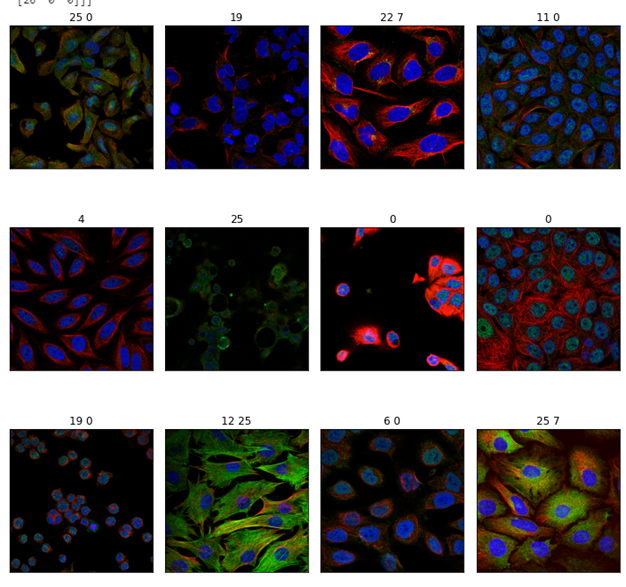
💡 subplots
: 한번에 여러 그래프를 보여주기 위해 사용되는 코드
- 3X4개의 그래프를 각 사이즈 10X10로 해서 보여준다.
- fig(figure) : 전체 subplot (subplot 안에 몇 개의 그래프가 있든지 상관없이 그것을 담는 전체 사이즈)
- axes : 전체 중 하나하나 (서브플롯 안에 2개 (a1, a2)그래프가 있으면 a1, a2를 말한다)
전처리
train, test를 나누어주는 train_test_split을 통해 train과 validation을 나누어 준다.
train, val = train_test_split(dataframe, test_size=0.2, random_state=42)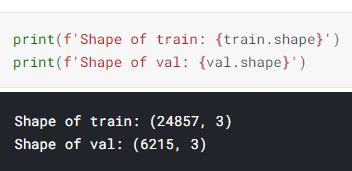
이 부분은 확실히 이해를 못했는데 아마 one-hot encoding 부분인 것 같다
해당하는 부분만 1로 바꾸어 주는듯
def get_clean_data(df):
    targets = []
    paths = []
    for _, row in df.iterrows():
        target_np = np.zeros((28))
        t = [int(t) for t in row.Target.split()]
        target_np[t] = 1
        targets.append(target_np)
        paths.append(row.complete_path)
    return np.array(paths), np.array(targets)
함수 실행
train_path, train_target = get_clean_data(train)
val_path, val_target = get_clean_data(val)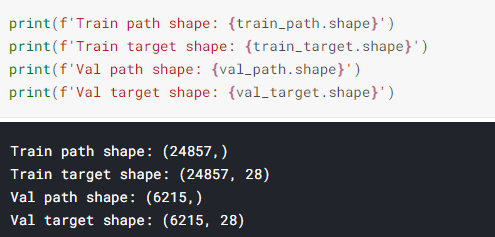
train_data랑 val_data에 정리해주기
train_data = tf.data.Dataset.from_tensor_slices((train_path, train_target))
val_data = tf.data.Dataset.from_tensor_slices((val_path, val_target))
💡 tf.data.API
: 더 이상 개선의 여지가 없을 때 학습을 종료시키는 콜백함수
- 복잡한 input pipeline을 단순하게 만들어 사용할 수 있게 한다.
ex) 분산 파일 시스템에서 데이터 통합, 각 이미지에 랜덤 변화 주기, 학습에서 랜덤하게 선택한 이미지 병합하여 사용- 대용량 데이터를 다룰 수 있게 도와주고 서로 다른 데이터 포맷을 읽을 수 있으며 복잡한 변환 작업 수행
💡 tf.data.Dataset.from_tensor_slices()
: 메모리에 존재하는 데이터로 Dataset 구성하는 경우 사용
- tensor를 사용해 dataset 초기화
파일을 읽어와서 png 파일을 디코딩
def load_data(path, target):
    red = tf.squeeze(tf.image.decode_png(tf.io.read_file(path+'_red.png'), channels=1), [2])
    blue = tf.squeeze(tf.image.decode_png(tf.io.read_file(path+'_blue.png'), channels=1), [2])
    green = tf.squeeze(tf.image.decode_png(tf.io.read_file(path+'_green.png'), channels=1), [2])
    #yellow=tf.squeeze(tf.image.decode_png(tf.io.read_file(path+'_yellow.png'), channels=1), [2])
    img = tf.stack((
                red,
                green,
                blue), axis=2)
    return img, target

AUTOTUNE = tf.data.experimental.AUTOTUNE

train_data = train_data.map(load_data, num_parallel_calls=AUTOTUNE)
val_data = val_data.map(load_data, num_parallel_calls=AUTOTUNE)
💡 tf.squeeze()
: 텐서에서 크기 1인 차원 제거
- t = [1, 2, 1, 3, 1, 1]
shape(squeeze(t)) ==> [2, 3]- t = [1, 2, 1, 3, 1, 1]
shape(squeeze(t, [2, 4])) ==> [1, 2, 3, 1]
💡 tf.data.experimental.AUTOTUNE
: tf.data 런타임이 실행시에 동적으로 값을 조정 (파이프라인 성능 최적화)
- data 가져올 때 가져올 요소 수는 하나의 훈련 스텝에서 배치 수와 같거나 커야 해서 이것을 조정해야 하는데 이걸 동적으로 값 조정
def image_augment(img, target):
	# 이미지 대비 조정
    img = tf.image.random_contrast(img, lower=0.3, upper=2.0)
    # 이미지를 수직으로 뒤집음
    img = tf.image.random_flip_up_down(img)
    # 이미지 밝기 조정
    img = tf.image.random_brightness(img, max_delta=0.1)
    return img, target

# num_parallel_calls => 병렬로 빠르게
train_data = train_data.map(image_augment, num_parallel_calls=AUTOTUNE)
train_data_batches = train_data.batch(BATCH_SIZE).prefetch(buffer_size=AUTOTUNE)
val_data_batches = val_data.batch(BATCH_SIZE).prefetch(buffer_size=AUTOTUNE)💡 prefetch()
: 모델이 학습하는 동안 데이터 집합이 백그라운드에서 배치를 가져올 수 있다.
- keras.preprocessing 보다 매우 빠름
2. 모델 구성
from keras.layers import Conv2D, MaxPooling2D, Dense, Input, Flatten, Activation
resnet_model = applications.ResNet50(include_top=False, weights='imagenet')
# ResNet50을 이용해 가져다 쓴다

resnet_model.trainable = True

input_layer = Input(shape=INPUT_SHAPE)
x = resnet_model(input_layer)
x = Flatten()(x)
x = Dropout(0.5)(x)
x = Dense(512, activation='relu')(x)
x = Dropout(0.5)(x)
output = Dense(28, activation='sigmoid')(x)
model = Model(input_layer, output)

model.summary()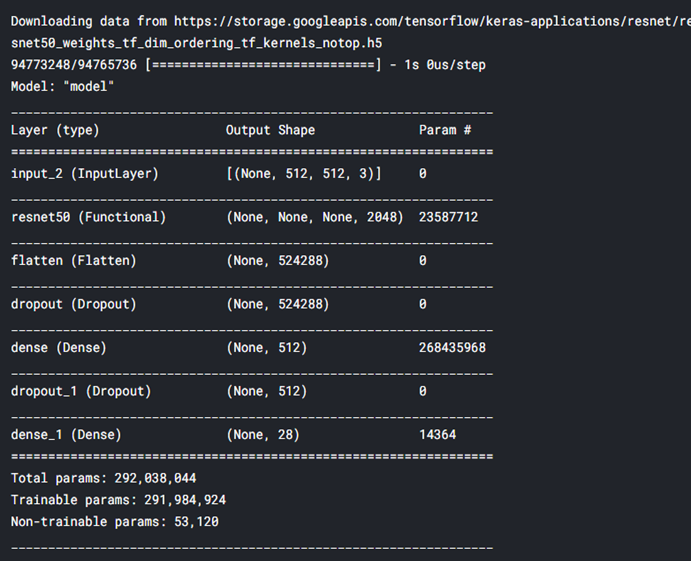
model.compile(optimizer=Adam(1e-3), loss='binary_crossentropy', metrics=['binary_accuracy'])3. 모델 훈련
history = model.fit(train_data_batches, steps_per_epoch = 150, validation_data = val_data_batches, epochs=10)4. 평가
plt로 accuracy 그래프 그리기
binary_accuracy=history.history['binary_accuracy']
val_binary_accuracy=history.history['val_binary_accuracy']
epochs=range(1,len(binary_accuracy)+1)
plt.plot(epochs,binary_accuracy,'b',label='Training accuracy')
plt.plot(epochs,val_binary_accuracy,'r',label='Validation accuracy')
plt.title('Training and Validation accuracy')
plt.legend()
plt.figure()
plt.show()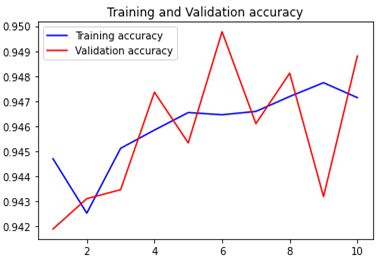
plt로 loss 그래프 그리기
loss=history.history['loss']
val_loss=history.history['val_loss']

epochs=range(1,len(binary_accuracy)+1)
plt.plot(epochs,loss,'b',label='Training loss')
plt.plot(epochs,val_loss,'r',label='Validation loss')
plt.title('Training and Validation loss')
plt.legend()
plt.figure()
plt.show()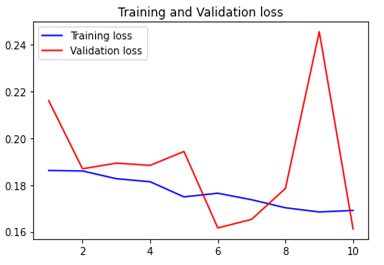
fit 변경
step_per_epoch = 25, epochs =5 로 변경
history = model.fit(train_data_batches, steps_per_epoch = 25, validation_data = val_data_batches, epochs=5)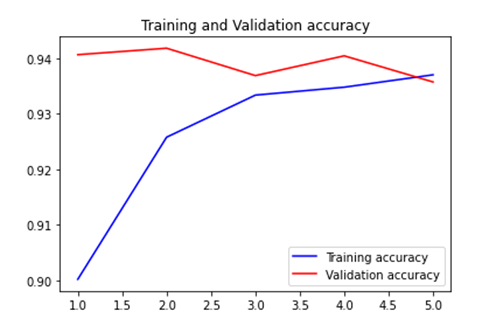
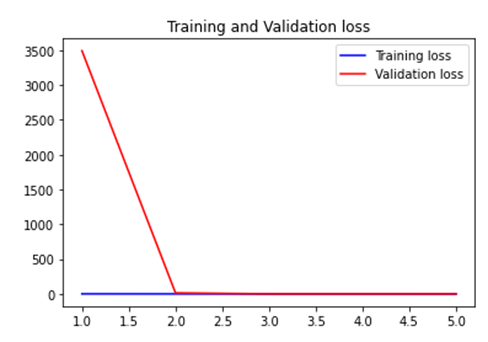
매우 빠르게 overfitting
모델 레이어 수 변경
from keras.layers import Conv2D, MaxPooling2D, Dense, Input, Flatten, Activation
resnet_model = applications.ResNet50(include_top=False, weights='imagenet')

resnet_model.trainable = True

input_layer = Input(shape=INPUT_SHAPE)
x = resnet_model(input_layer)
x = Conv2D(64, (3,3), activation='relu')(x)
x = Conv2D(64, (3,3), activation='relu')(x)
x = MaxPooling2D((2,2))(x)
x = Dropout(0.5)(x)

x = Conv2D(128, (3,3), activation='relu')(x)
x = Conv2D(128, (3,3), activation='relu')(x)
x = MaxPooling2D((2,2))(x)
x = Dropout(0.5)(x)


x = Flatten()(x)
x = Dropout(0.5)(x)
x = Dense(512, activation='relu')(x)
x = Dropout(0.5)(x)
output = Dense(28, activation='sigmoid')(x)
model = Model(input_layer, output)

model.summary()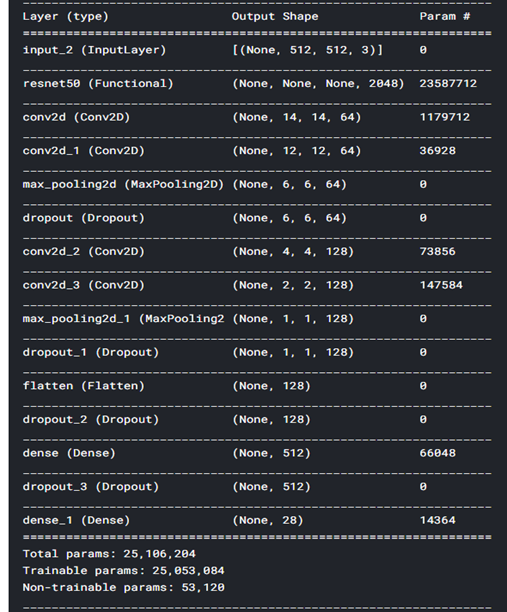
history = model.fit(train_data_batches, steps_per_epoch = 25, validation_data = val_data_batches, epochs=5)** fit 은 kaggle에서 진행했더니 많이하면 세션이 종료되어 조금만 했다.
==> 어떻게 해결하지??
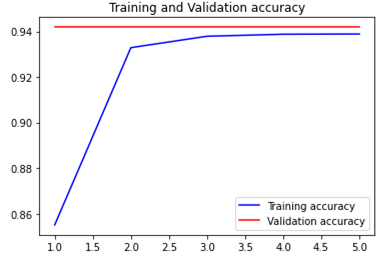
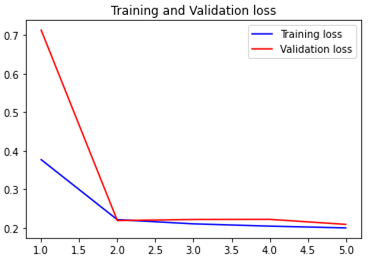
model 레이어 수를 늘리니 더 심하게 overfitting 되었다.
모델 뉴런 수 변경
바로 위 상황에서 64-> 32, 128 -> 64로 변경하였다.
resnet_model = applications.ResNet50(include_top=False, weights='imagenet')

resnet_model.trainable = True

input_layer = Input(shape=INPUT_SHAPE)
x = resnet_model(input_layer)
x = Conv2D(32, (3,3), activation='relu')(x)
x = Conv2D(32, (3,3), activation='relu')(x)
x = MaxPooling2D((2,2))(x)
x = Dropout(0.5)(x)

x = Conv2D(64, (3,3), activation='relu')(x)
x = Conv2D(64, (3,3), activation='relu')(x)
x = MaxPooling2D((2,2))(x)
x = Dropout(0.5)(x)


x = Flatten()(x)
x = Dropout(0.5)(x)
x = Dense(512, activation='relu')(x)
x = Dropout(0.5)(x)
output = Dense(28, activation='sigmoid')(x)
model = Model(input_layer, output)

model.summary()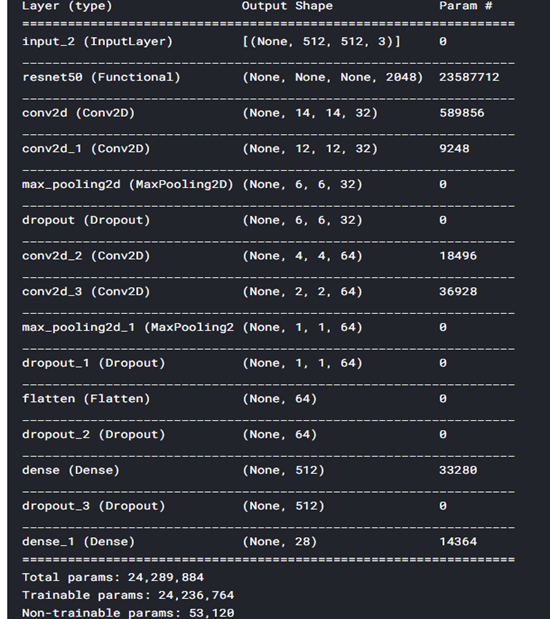
history = model.fit(train_data_batches, steps_per_epoch = 25, validation_data = val_data_batches, epochs=5)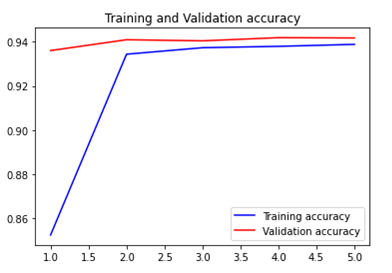
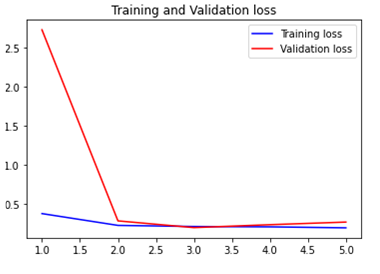
overfitting
==> ResNet50만 사용하기!
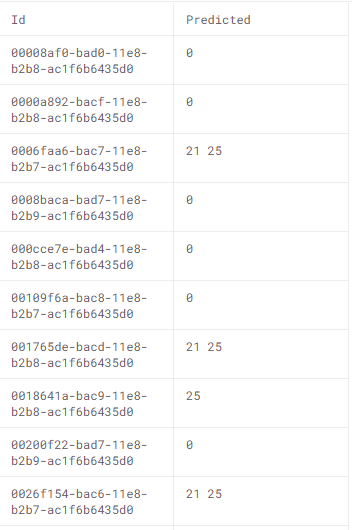
5. 예측
다음에 알고싶은 부분
- fit 에 epoch를 늘리고 싶은데 어떻게 하면 세션이 종료 안될지
- def get_clean_data(df) 부분 완벽히 이해하기
- 모델을 어떻게 하면 잘 만들까
새로 알게 된 부분
- tf.data API
- prefetch
- tf.squeeze
