
오토 인코더에 대한 자세한 설명은 여기를 참고해주세요!
▶사용할 데이터 집합
이전에 사용하였던 Fashion MNIST 데이터 집합을 사용하겠습니다.
▶라이브러리 임포트
사용할 라이브러리는 아래와 같습니다.
import torch
import torchvision
import torch.nn.functional as F
from torch import nn, optim
from torchvision import transforms, datasets
import matplotlib.pyplot as plt
from mpl_toolkits.mplot3d import Axes3D
from matplotlib import cm
import numpy as np
from torch.utils import data
▶GPU, Parameter 설정
epoch = 100
batch_size = 64
USE_CUDA = torch.cuda.is_available()
DEVICE = torch.device("cuda" if USE_CUDA else "cpu")
▶데이터셋 준비
이는 위의 데이터 시각화 앞부분과 동일합니다.
trainset = datasets.FashionMNIST(root = './.data/', train = True, download = True, transform = transform)
testset= datasets.FashionMNIST(root = './.data/', train = False, download = True, transform = transform)

train_loader = data.DataLoader(dataset = trainset, batch_size = batch_size)
test_loader = data.DataLoader(dataset = testset, batch_size = batch_size)
▶모델 설계
autoencoder 내에 encdoer와 decoder를 각각 정의해 줍니다.
class AutoEncoder(nn.Module):
    def __init__(self):
        super(AutoEncoder, self).__init__()

        self.encoder = nn.Sequential(
            nn.Linear(28*28, 128),
            nn.ReLU(),
            nn.Linear(128, 64),
            nn.ReLU(),
            nn.Linear(64, 12),
            nn.ReLU(),
            nn.Linear(12, 3),
        )

        self.decoder = nn.Sequential(
            nn.Linear(3, 12),
            nn.ReLU(),
            nn.Linear(12, 64),
            nn.ReLU(),
            nn.Linear(64, 128),
            nn.ReLU(),
            nn.Linear(128, 28*28),
            nn.Sigmoid(),
        )

    def forward(self, x):
        encode_data = self.encoder(x)
        decode_data = self.decoder(encode_data)
        return encode_data, decode_data
먼저 autoencoder는 encoder와 decoder로 이루어져 있기 때문에, nn.Sequential을 이용하여 각 층을 쌓아줍니다. 입력 데이터의 크기는 2828이고, encoder에서는 2828 →128→64→12→3순으로 차원을 줄여줍니다. 최종 크기를 3으로 줄인 것은, 뒤쪽에서 3차원 시각화를 하기 위해서 입니다. decoder에서는 반대로 이미지 복원을 위해 3→12→64→128→28*28순으로 차원을 늘려줍니다. 또한 마지막에 값을 픽셀 당 0과 1사이로 값을 출력하기 위해 Sigmoid를 사용하였습니다.
▶학습 및 평가
학습 및 평가는 아래와 같습니다.
autoencoder = AutoEncoder().to(DEVICE)
optimizer = torch.optim.Adam(autoencoder.parameters(), lr=0.005)
criterion = nn.MSELoss()
view_data = trainset.data[:5].view(-1, 28*28)
view_data = view_data.type(torch.FloatTensor)/255.
def train(autoencoder, train_loader):
autoencoder.train()
for step, (x, label) in enumerate(train_loader):
x = x.view(-1, 28*28).to(DEVICE)
y = x.view(-1, 28*28).to(DEVICE)
label = label.to(DEVICE)
encode_data, decode_data = autoencoder(x)
loss = criterion(decode_data, y)
optimizer.zero_grad()
loss.backward()
optimizer.step()
for e in range(1, epoch+1):
train(autoencoder, train_loader)
test_x = view_data.to(DEVICE)
_, decode_data = autoencoder(test_x)
f, a = plt.subplots(2, 5, figsize=(5,2))
print("[EPOCH {}]".format(e))
for i in range(5):
img = np.reshape(view_data.data.numpy()[i],(28,28))
a[0][i].imshow(img, cmap='gray')
for i in range(5):
img = np.reshape(view_data.to("cpu").data.numpy()[i],(28,28))
a[1][i].imshow(img, cmap='gray')
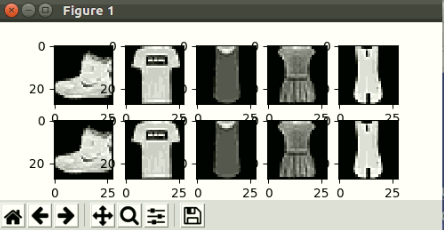
plt.show()이때 결과물을 확인해 보면 아래와 같습니다.
[epoch 1일때의 결과물]

[epoch 10일때의 결과물]
▶잠재 변수 시각화
잠재 변수는 encoder를 거쳐 나온 값을 뜻합니다. 즉, 이미지 복원 직전의 벡터들입니다.
view_data = trainset.data[:100].view(-1, 28*28)
view_data = view_data.type(torch.FloatTensor)/255.
test_x = view_data.to(DEVICE)
encode_data, _ = autoencoder(test_x)
encode_data = encode_data.to("cpu")
CLASS_LABEL = {0:"T-shirt/top", 1:"Trouser", 2:"Pullover", 3:"Dress", 4:"Coat", 5:"Sandal", 6:"Shirt", 7:"Sneaker", 8:"Bag", 9:"Ankle boot"}

fig = plt.figure(figsize=(10,8))
ax = Axes3D(fig)
X = encode_data.data[:,0].numpy()
Y = encode_data.data[:,1].numpy()
Z = encode_data.data[:,2].numpy()

label = trainset.targets[:100].numpy()

for x, y, z, s in zip(X, Y, Z, label):
    name = CLASS_LABEL[s]
    color = cm.rainbow(int(255*s/9))
    ax.text(x, y, z, name, backgroundcolor=color)

ax.set_xlim(X.min(), X.max())
ax.set_ylim(Y.min(), Y.max())
ax.set_zlim(Z.min(), Z.max())
plt.show()
시각화를 위해 데이터 셋에서 100개의 데이터를 추출합니다. 그리고 autoencoder의 encoder를 거친 데이터를 가져오고, Axes3D()함수를 이용하여, 잠재 변수의 X, Y, Z차원을 추출한 뒤 numpy()로 변환하여 라벨과 함께 입력해 줍니다.
결과는 아래와 같습니다.


벨로그에서는 인공지능 관련 포스팅만 합니다! 더 많은 정보는 소개를 참고해주세요!
안녕하세요 :) 글 잘 읽었습니다.
혹시 학습 및 평가에서 아래의 코드가 하는 역할을 여쭤봐도 될까요 ?
view_data = trainset.data[:5].view(-1, 28*28)
view_data = view_data.type(torch.FloatTensor)/255.
Test Set과 같은 역할을 하는 것 같은데, 이미 위에서 test_loader를 정의해주셨는데 해당 객체는 사용되지 않고 있어서요 !