막대형 차트 시각화 살펴보기 (vega-lite)
개요
막대형 차트에는 어떤 종류가 있고, 어떨 때 어떤 막대를 쓰는 게 맞을까?
Vega-lite 차트를 기준으로 알아보자.
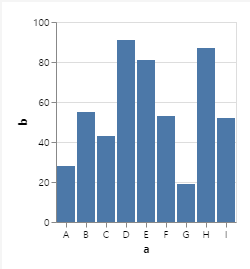
기본 수직 막대형 차트 (Simple bar chart)
vega-lite에서 제공하는 기본 차트는 아래와 같은 형태의 차트다.
{
"$schema": "https://vega.github.io/schema/vega-lite/v4.json",
"description": "A simple bar chart with embedded data.",
"data": {
"values": [
{"a": "A", "b": 28}, {"a": "B", "b": 55}, {"a": "C", "b": 43},
{"a": "D", "b": 91}, {"a": "E", "b": 81}, {"a": "F", "b": 53},
{"a": "G", "b": 19}, {"a": "H", "b": 87}, {"a": "I", "b": 52}
]
},
"mark": "bar",
"encoding": {
"x": {"field": "a", "type": "ordinal", "axis": {"labelAngle": 0}},
"y": {"field": "b", "type": "quantitative"}
}
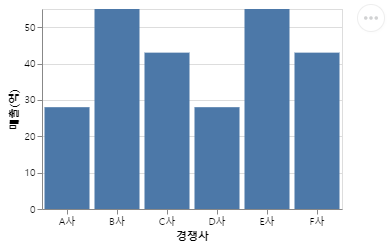
}이 차트는 일반적으로 x축에 시간이 오는 시계열 데이터보다는 x축에 독립된 개체가 오는 데이터를 비교 분석할 때 적합하다고 생각한다.
이를테면, 아래와 같은 느낌이다.
{
$schema: 'https://vega.github.io/schema/vega-lite/v4.json',
description: 'A simple bar chart with embedded data.',
width: 300,
data: {
values: [
{a: 'A사', b: 28},
{a: 'B사', b: 55},
{a: 'C사', b: 43},
{a: 'D사', b: 28},
{a: 'E사', b: 55},
{a: 'F사', b: 43},
],
},
mark: 'bar',
// encoding은 데이터의 이름이 어떻게 표기될지 정의합니다.
// title을 입력하지 않으면 field의 내용이 들어갑니다.
encoding: {
x: {field: 'a', type: 'ordinal', axis: {labelAngle: 0}, title: '경쟁사'},
y: {field: 'b', type: 'quantitative', axis: {labelAngle: 0}, title: '매출(억)'},
},
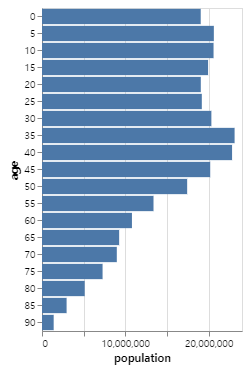
}총합 막대 차트 (Aggregation bar chart)
아래와 같은 차트이다. 차트를 눈으로 보면 '이게 왜 총합차트지?' 하겠지만 내부적으로 데이터를 더하고 있다.
아래의 데이터부를 보면, 연도, 나이, 성별, 인원 수가 있는데 transform이라는 옵션으로 데이터를 필터링하고, encoding에서 aggregate 옵션을 추가하여 합한다.
총합차트인만큼, 하나의 데이터소스에서 다른 기준으로 여러가지 정보를 얻고 싶을 때 사용하면 용이할 것이다. 아래의 데이터는 연도별 인구수로, 년도도 가지고 있지만, 성별이나 나이도 가지고 있다.
{
    $schema: 'https://vega.github.io/schema/vega-lite/v4.json',
    description: 'A bar chart showing the US population distribution of age groups in 2000.',
    height: {step: 17},
    data: {
      values: [
        {year: 1850, age: 0, sex: 1, people: 1483789},
        {year: 1850, age: 0, sex: 2, people: 1450376},
        {year: 1850, age: 5, sex: 1, people: 1411067},
        {year: 1850, age: 5, sex: 2, people: 1359668},
        {year: 1850, age: 10, sex: 1, people: 1260099},
        {year: 1850, age: 10, sex: 2, people: 1216114},
        {year: 1850, age: 15, sex: 1, people: 1077133},
        {year: 1850, age: 15, sex: 2, people: 1110619},
        {year: 1850, age: 20, sex: 1, people: 1017281},
        {year: 1850, age: 20, sex: 2, people: 1003841},
        {year: 2000, age: 0, sex: 1, people: 9735380},
        {year: 2000, age: 0, sex: 2, people: 9310714},
        {year: 2000, age: 5, sex: 1, people: 10552146},
        {year: 2000, age: 5, sex: 2, people: 10069564},
        {year: 2000, age: 10, sex: 1, people: 10563233},
        {year: 2000, age: 10, sex: 2, people: 10022524},
        {year: 2000, age: 15, sex: 1, people: 10237419},
        {year: 2000, age: 15, sex: 2, people: 9692669},
        {year: 2000, age: 20, sex: 1, people: 9731315},
        {year: 2000, age: 20, sex: 2, people: 9324244},
      ],
    },
    // 여기서 데이터를 필터링함
    transform: [{filter: 'datum.year == 2000'}],
    mark: 'bar',
    encoding: {
      y: {
        field: 'age',
        type: 'ordinal',
      },
      x: {
        aggregate: 'sum',
        field: 'people',
        type: 'quantitative',
        axis: {title: 'population'},
      },
    },
  }
정렬하기
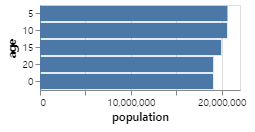
위와 같이 어떤 값을 기준으로 정렬해주려면, encoding 필드 부분을 손보면 된다. 소스코드는 아래에 있다.
{
$schema: 'https://vega.github.io/schema/vega-lite/v4.json',
description: 'A bar chart showing the US population distribution of age groups in 2000.',
height: {step: 17},
data: {
values: [
{year: 1850, age: 0, sex: 1, people: 1483789},
{year: 1850, age: 0, sex: 2, people: 1450376},
{year: 1850, age: 5, sex: 1, people: 1411067},
{year: 1850, age: 5, sex: 2, people: 1359668},
{year: 1850, age: 10, sex: 1, people: 1260099},
{year: 1850, age: 10, sex: 2, people: 1216114},
{year: 1850, age: 15, sex: 1, people: 1077133},
{year: 1850, age: 15, sex: 2, people: 1110619},
{year: 1850, age: 20, sex: 1, people: 1017281},
{year: 1850, age: 20, sex: 2, people: 1003841},
{year: 2000, age: 0, sex: 1, people: 9735380},
{year: 2000, age: 0, sex: 2, people: 9310714},
{year: 2000, age: 5, sex: 1, people: 10552146},
{year: 2000, age: 5, sex: 2, people: 10069564},
{year: 2000, age: 10, sex: 1, people: 10563233},
{year: 2000, age: 10, sex: 2, people: 10022524},
{year: 2000, age: 15, sex: 1, people: 10237419},
{year: 2000, age: 15, sex: 2, people: 9692669},
{year: 2000, age: 20, sex: 1, people: 9731315},
{year: 2000, age: 20, sex: 2, people: 9324244},
],
},
// 여기서 데이터를 필터링함
transform: [{filter: 'datum.year == 2000'}],
mark: 'bar',
encoding: {
y: {
field: 'age',
type: 'ordinal',
// 여기서 데이터를 정렬하는 옵션 넣어주면 됨
sort: {encoding: 'x', order: 'descending'},
},
x: {
aggregate: 'sum',
field: 'people',
type: 'quantitative',
axis: {title: 'population'},
},
},
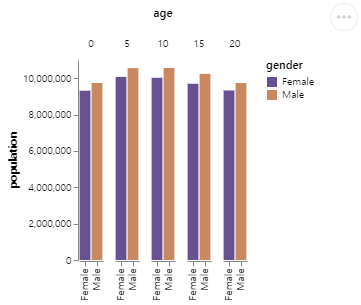
}그룹형 막대 차트 (Grouped bar chart)
그룹형 막대 차트는 위의 인구수와 같은 데이터에서 어떤 비교그룹이 존재할 때, 매우 용이하다. 아래는 남성과 여성의 인구수를 비교하는 그룹형 막대 차트이다.
{
$schema: 'https://vega.github.io/schema/vega-lite/v4.json',
description: 'A bar chart showing the US population distribution of age groups in 2000.',
height: {step: 17},
data: {
values: [
{year: 1850, age: 0, sex: 1, people: 1483789},
{year: 1850, age: 0, sex: 2, people: 1450376},
{year: 1850, age: 5, sex: 1, people: 1411067},
{year: 1850, age: 5, sex: 2, people: 1359668},
{year: 1850, age: 10, sex: 1, people: 1260099},
{year: 1850, age: 10, sex: 2, people: 1216114},
{year: 1850, age: 15, sex: 1, people: 1077133},
{year: 1850, age: 15, sex: 2, people: 1110619},
{year: 1850, age: 20, sex: 1, people: 1017281},
{year: 1850, age: 20, sex: 2, people: 1003841},
{year: 2000, age: 0, sex: 1, people: 9735380},
{year: 2000, age: 0, sex: 2, people: 9310714},
{year: 2000, age: 5, sex: 1, people: 10552146},
{year: 2000, age: 5, sex: 2, people: 10069564},
{year: 2000, age: 10, sex: 1, people: 10563233},
{year: 2000, age: 10, sex: 2, people: 10022524},
{year: 2000, age: 15, sex: 1, people: 10237419},
{year: 2000, age: 15, sex: 2, people: 9692669},
{year: 2000, age: 20, sex: 1, people: 9731315},
{year: 2000, age: 20, sex: 2, people: 9324244},
],
},
// 여기서 데이터를 필터링함
transform: [
{filter: 'datum.year == 2000'},
{calculate: "datum.sex == 2 ? 'Female' : 'Male'", as: 'gender'},
],
width: {step: 12},
mark: 'bar',
encoding: {
column: {
field: 'age',
type: 'ordinal',
// age 필드로 나누었을 때, 각 그룹의 간격을 조정하는 옵션
spacing: 10,
},
y: {
// year를 무시하고, age를 기준으로 남,여 성별의 인구수를 각각의 그룹으로 합침
aggregate: 'sum',
field: 'people',
type: 'quantitative',
axis: {title: 'population', grid: false},
},
x: {
field: 'gender',
type: 'nominal',
axis: {title: ''},
},
color: {
field: 'gender',
type: 'nominal',
// 각 막대의 색깔을 설정함
scale: {range: ['#FF0000', '#0000FF']},
},
},
config: {
// 그룹 별로 묶는 테두리 선을 투명하게 만듦
view: {stroke: 'transparent'},
axis: {domainWidth: 1},
},
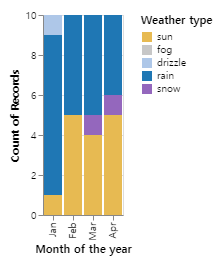
}누적형 막대 차트 (Stacked bar chart)
누적형 막대 차트는 한 막대에서 각각이 차지하는 퍼센티지를 볼 때 좋다.
아래는 월별 날씨의 비중을 나타내는 차트이다.
{
    $schema: 'https://vega.github.io/schema/vega-lite/v4.json',
    data: {
      values: [
        {
          date: '2012-01-01',
          precipitation: 0,
          temp_max: 12.8,
          temp_min: 5,
          wind: 4.7,
          weather: 'drizzle',
        },
        {
          date: '2012-01-02',
          precipitation: 10.9,
          temp_max: 10.6,
          temp_min: 2.8,
          wind: 4.5,
          weather: 'rain',
        },
        {
          date: '2012-01-03',
          precipitation: 0.8,
          temp_max: 11.7,
          temp_min: 7.2,
          wind: 2.3,
          weather: 'rain',
        },
        {
          date: '2012-01-04',
          precipitation: 20.3,
          temp_max: 12.2,
          temp_min: 5.6,
          wind: 4.7,
          weather: 'rain',
        },
        {
          date: '2012-01-05',
          precipitation: 1.3,
          temp_max: 8.9,
          temp_min: 2.8,
          wind: 6.1,
          weather: 'rain',
        },
        {
          date: '2012-01-06',
          precipitation: 2.5,
          temp_max: 4.4,
          temp_min: 2.2,
          wind: 2.2,
          weather: 'rain',
        },
        {
          date: '2012-01-07',
          precipitation: 0,
          temp_max: 7.2,
          temp_min: 2.8,
          wind: 2.3,
          weather: 'rain',
        },
        {
          date: '2012-01-08',
          precipitation: 0,
          temp_max: 10,
          temp_min: 2.8,
          wind: 2,
          weather: 'sun',
        },
        {
          date: '2012-01-09',
          precipitation: 4.3,
          temp_max: 9.4,
          temp_min: 5,
          wind: 3.4,
          weather: 'rain',
        },
        {
          date: '2012-01-10',
          precipitation: 1,
          temp_max: 6.1,
          temp_min: 0.6,
          wind: 3.4,
          weather: 'rain',
        },
        {
          date: '2012-02-01',
          precipitation: 13.5,
          temp_max: 8.9,
          temp_min: 3.3,
          wind: 2.7,
          weather: 'rain',
        },
        {
          date: '2012-02-02',
          precipitation: 0,
          temp_max: 8.3,
          temp_min: 1.7,
          wind: 2.6,
          weather: 'sun',
        },
        {
          date: '2012-02-03',
          precipitation: 0,
          temp_max: 14.4,
          temp_min: 2.2,
          wind: 5.3,
          weather: 'sun',
        },
        {
          date: '2012-02-04',
          precipitation: 0,
          temp_max: 15.6,
          temp_min: 5,
          wind: 4.3,
          weather: 'sun',
        },
        {
          date: '2012-02-05',
          precipitation: 0,
          temp_max: 13.9,
          temp_min: 1.7,
          wind: 2.9,
          weather: 'sun',
        },
        {
          date: '2012-02-06',
          precipitation: 0,
          temp_max: 16.1,
          temp_min: 1.7,
          wind: 5,
          weather: 'sun',
        },
        {
          date: '2012-02-07',
          precipitation: 0.3,
          temp_max: 15.6,
          temp_min: 7.8,
          wind: 5.3,
          weather: 'rain',
        },
        {
          date: '2012-02-08',
          precipitation: 2.8,
          temp_max: 10,
          temp_min: 5,
          wind: 2.7,
          weather: 'rain',
        },
        {
          date: '2012-02-09',
          precipitation: 2.5,
          temp_max: 11.1,
          temp_min: 7.8,
          wind: 2.4,
          weather: 'rain',
        },
        {
          date: '2012-02-10',
          precipitation: 2.5,
          temp_max: 12.8,
          temp_min: 6.7,
          wind: 3,
          weather: 'rain',
        },
        {
          date: '2012-03-01',
          precipitation: 0,
          temp_max: 6.1,
          temp_min: 1.1,
          wind: 3.1,
          weather: 'sun',
        },
        {
          date: '2012-03-02',
          precipitation: 2,
          temp_max: 6.7,
          temp_min: 3.9,
          wind: 5.1,
          weather: 'rain',
        },
        {
          date: '2012-03-03',
          precipitation: 0,
          temp_max: 12.2,
          temp_min: 6.7,
          wind: 7,
          weather: 'sun',
        },
        {
          date: '2012-03-04',
          precipitation: 0,
          temp_max: 10.6,
          temp_min: 6.7,
          wind: 5.6,
          weather: 'rain',
        },
        {
          date: '2012-03-05',
          precipitation: 6.9,
          temp_max: 7.8,
          temp_min: 1.1,
          wind: 6.2,
          weather: 'rain',
        },
        {
          date: '2012-03-06',
          precipitation: 0.5,
          temp_max: 6.7,
          temp_min: 0,
          wind: 2.7,
          weather: 'snow',
        },
        {
          date: '2012-03-07',
          precipitation: 0,
          temp_max: 8.9,
          temp_min: -1.7,
          wind: 2.7,
          weather: 'sun',
        },
        {
          date: '2012-03-08',
          precipitation: 0,
          temp_max: 15.6,
          temp_min: 0.6,
          wind: 2.5,
          weather: 'sun',
        },
        {
          date: '2012-03-09',
          precipitation: 3.6,
          temp_max: 9.4,
          temp_min: 5,
          wind: 2.8,
          weather: 'rain',
        },
        {
          date: '2012-03-10',
          precipitation: 10.4,
          temp_max: 7.2,
          temp_min: 6.1,
          wind: 3.4,
          weather: 'rain',
        },
        {
          date: '2012-04-01',
          precipitation: 1.5,
          temp_max: 8.9,
          temp_min: 4.4,
          wind: 6.8,
          weather: 'rain',
        },
        {
          date: '2012-04-02',
          precipitation: 0,
          temp_max: 16.7,
          temp_min: 4.4,
          wind: 3.1,
          weather: 'sun',
        },
        {
          date: '2012-04-03',
          precipitation: 1.5,
          temp_max: 11.7,
          temp_min: 3.3,
          wind: 3.1,
          weather: 'rain',
        },
        {
          date: '2012-04-04',
          precipitation: 0,
          temp_max: 10.6,
          temp_min: 2.8,
          wind: 2.1,
          weather: 'sun',
        },
        {
          date: '2012-04-05',
          precipitation: 4.6,
          temp_max: 9.4,
          temp_min: 2.8,
          wind: 1.8,
          weather: 'snow',
        },
        {
          date: '2012-04-06',
          precipitation: 0.3,
          temp_max: 11.1,
          temp_min: 3.3,
          wind: 2.6,
          weather: 'rain',
        },
        {
          date: '2012-04-07',
          precipitation: 0,
          temp_max: 16.1,
          temp_min: 1.7,
          wind: 4.3,
          weather: 'sun',
        },
        {
          date: '2012-04-08',
          precipitation: 0,
          temp_max: 21.1,
          temp_min: 7.2,
          wind: 4.1,
          weather: 'sun',
        },
        {
          date: '2012-04-09',
          precipitation: 0,
          temp_max: 20,
          temp_min: 6.1,
          wind: 2.1,
          weather: 'sun',
        },
        {
          date: '2012-04-10',
          precipitation: 0,
          temp_max: 17.8,
          temp_min: 8.9,
          wind: 3.2,
          weather: 'rain',
        },
      ],
    },
    mark: 'bar',
    encoding: {
      x: {
        // yyyy-mm-dd로 된 데이터를 timeUnit이라는 값 설정을 통해 년,월 등의 단위로 묶을 수 있음
        timeUnit: 'month',
        field: 'date',
        type: 'ordinal',
        axis: {title: 'Month of the year'},
      },
      y: {
        aggregate: 'count',
        type: 'quantitative',
      },
      // 각 도메인을 다른 색으로 칠해야 하기 때문에 color 설정
      color: {
        field: 'weather',
        type: 'nominal',
        scale: {
          // 도메인에 포함되지 않은 값은 데이터에서 가져오지 않음
          // 비율에 포함시킬 것만 도메인에 지정
          domain: ['sun', 'fog', 'drizzle', 'rain', 'snow'],
          // 색상의 범위를 나타냄
          range: ['#e7ba52', '#c7c7c7', '#aec7e8', '#1f77b4', '#9467bd'],
        },
        // 범례의 이름
        legend: {title: 'Weather type'},
      },
    },
  }
풀스택 웹개발자로 일하고 있는 Jake Seo입니다. 주로 Jake Seo라는 닉네임을 많이 씁니다. 프론트엔드: Javascript, React 백엔드: Spring Framework에 관심이 있습니다.