작성자 : 투빅스 13기 이재빈
Contents
- Intro
- Shapley Value
- Additive Feature Attribution Method
- SHAP
- Code
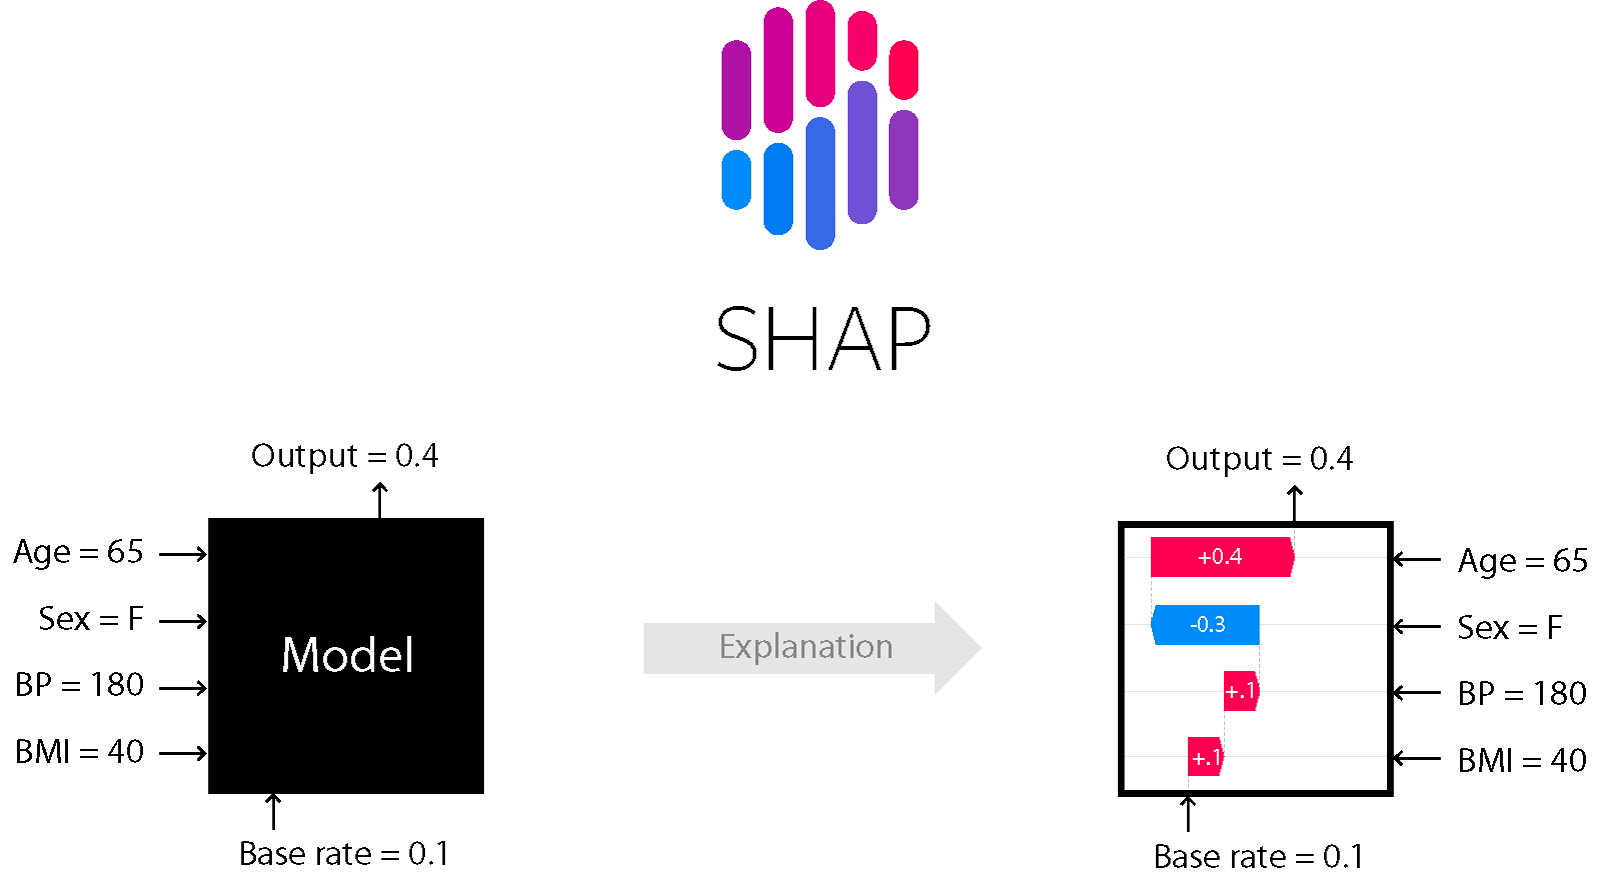
Summary : SHAP 을 통해 Feature Attribution 을 파악할 수 있습니다.
0. Intro
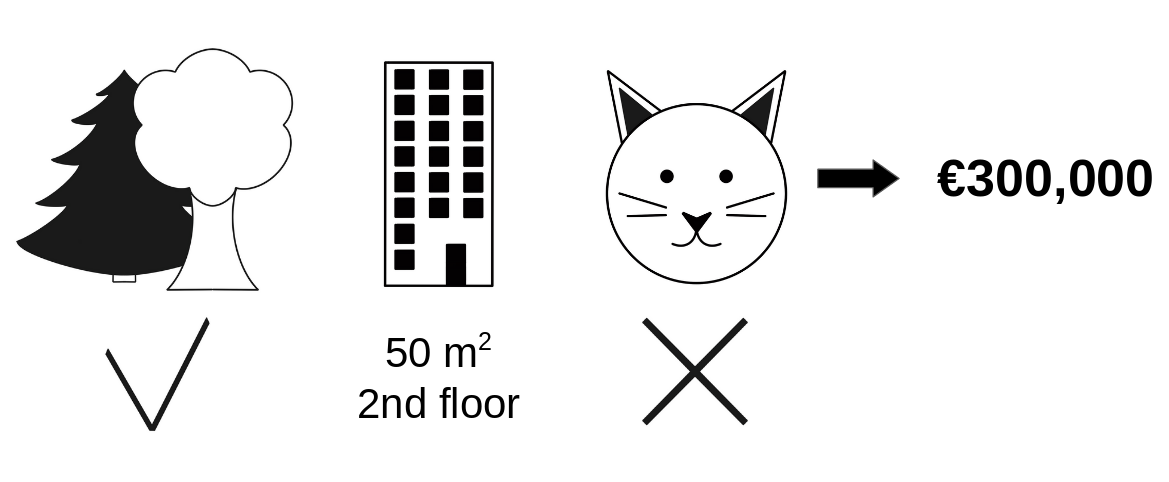
좋은 집을 찾고 있는 두빅스씨 ...
어떤 집 하나가 유난히 가격이 낮은데, 그 집이 숲 속에 있기 때문인지, 평수가 작기 때문인지, 혹은 평수가 작아 고양이를 기를 수 없어서 그렇기 때문인지 정확한 이유를 알 수 없습니다.
결과만 보고 해석하지 않고, 각 요소들이 결과값에 얼마나 영향을 미치는 지에 대해 파악하고자 합니다.
Limitations
기존의 Feature Attribution 파악 방법론에는 한계가 존재합니다.
1. Feature Importance
- Random Permutation 에 대해 Importance 를 측정하기 때문에, Inconsistent 합니다.
- Feature 간의 의존성 을 간과합니다.
설명변수 간 다중공선성이 존재하는 경우, 결과가 왜곡될 수 있습니다. - 음의 영향력 (-) 을 계산하지 않습니다.
모델이 negative feature 에 대한 학습을 의도적으로 무시하기 때문에, 에러가 높아지는 변인은 결과에 포함하지 않습니다.
2. PDP Plot
- 최대 3차원 까지만 표현 가능합니다.
비교하고자 하는 Feature 가 많아지면 시각화 할 수 없고, Feature 영향력이 과대 평가될 위험이 있습니다.
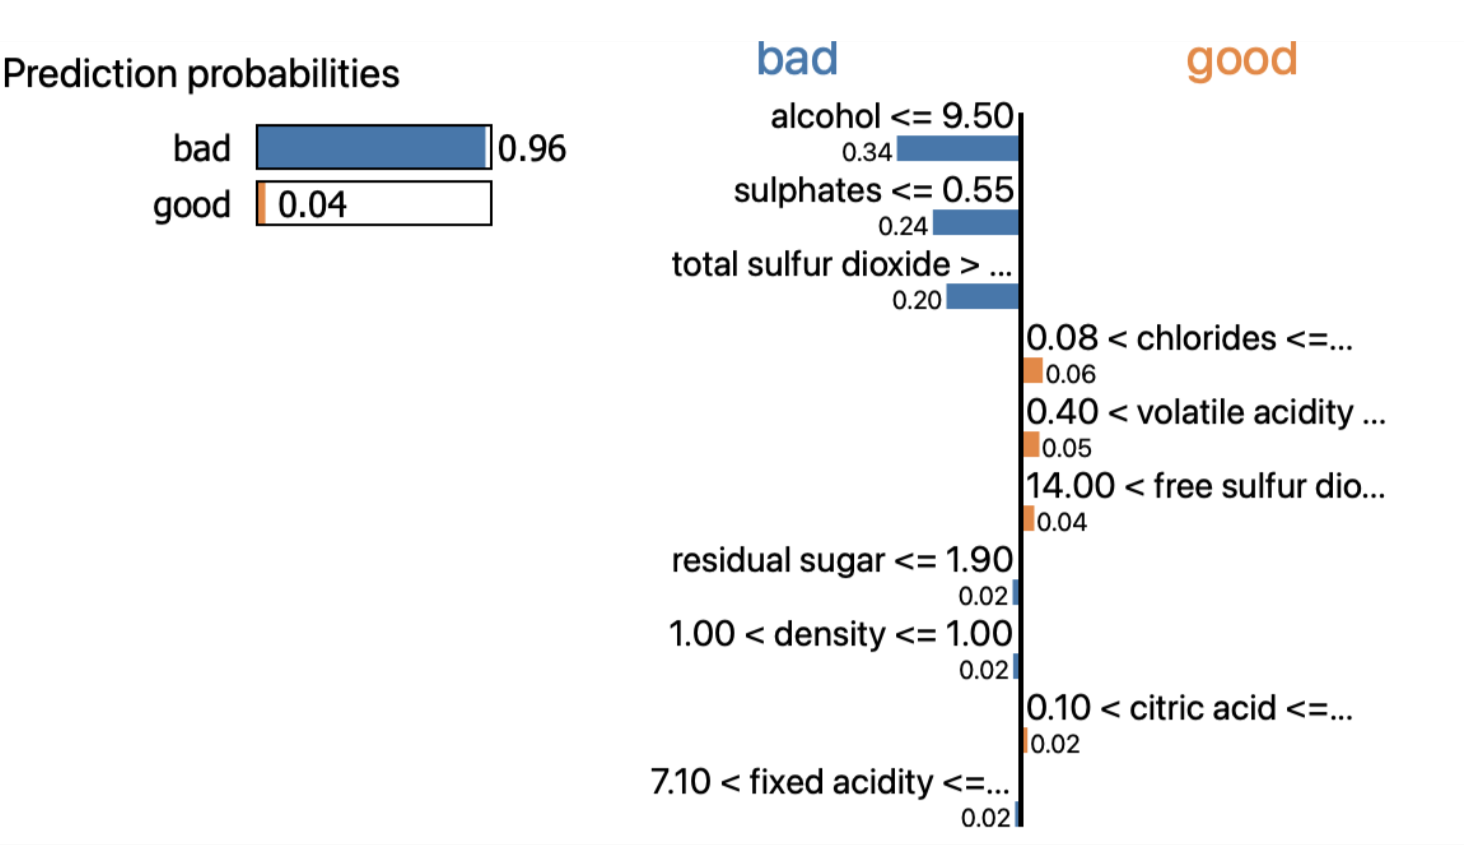
3. LIME
Global vs Local 대리 분석
- Global Surrogate Analysis
학습 데이터(일부 또는 전체)를 사용해 대리 분석 모델을 구축하는 것- Local Surrogate Analysis
학습 데이터 하나를 해석하는 과정
- Local Interpretable Model-agnostic Explanation
single prediction explanation 에 적합합니다. - Visualization 을 통한 결과 해석이 어렵습니다.
1. Shapley Value
Shapley Value 는 게임이론을 바탕으로, Game 에서 각 Player 의 기여분을 계산하는 방법입니다.
✔︎ Game Theory
개인 또는 기업이 어떠한 행위를 했을 때, 그 결과가 게임에서와 같이 자신뿐만 아니라 다른 참가자의 행동에 의해서도 결정되는 상황에서, 자신의 최대 이익에 부합하는 행동을 추구한다는 수학적 이론✔︎ 협력적 게임 이론 (Cooperative Game Theory)
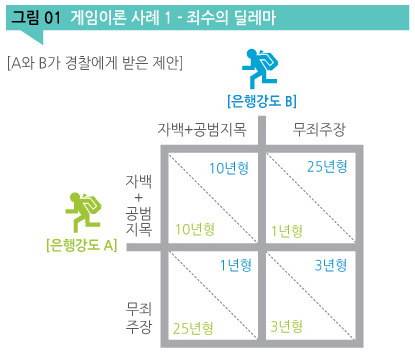
비협력적으로 게임을 했을 때 각 개인이 취하는 이득보다, 협력적으로 게임을 했을 때의 각 개인이 취하는 이득이 더 크다면, 긍정적인 협동이 가장 최선의 선택지대표적인 예시 : 죄수의 딜레마
하나의 특성에 대한 중요도를 알기 위해 → 여러 특성들의 조합을 구성하고 → 해당 특성의 유무에 따른 평균적인 변화를 통해 값을 계산합니다.

- : 데이터에 대한 Shapley Value
- : 전체 집합
- : 전체 집합에서, 번째 데이터가 빠진 나머지의, 모든 부분 집합
- : 번째 데이터를 포함한 (=전체) 기여도
- : 번째 데이터가 빠진, 나머지 부분 집합의 기여도
Example
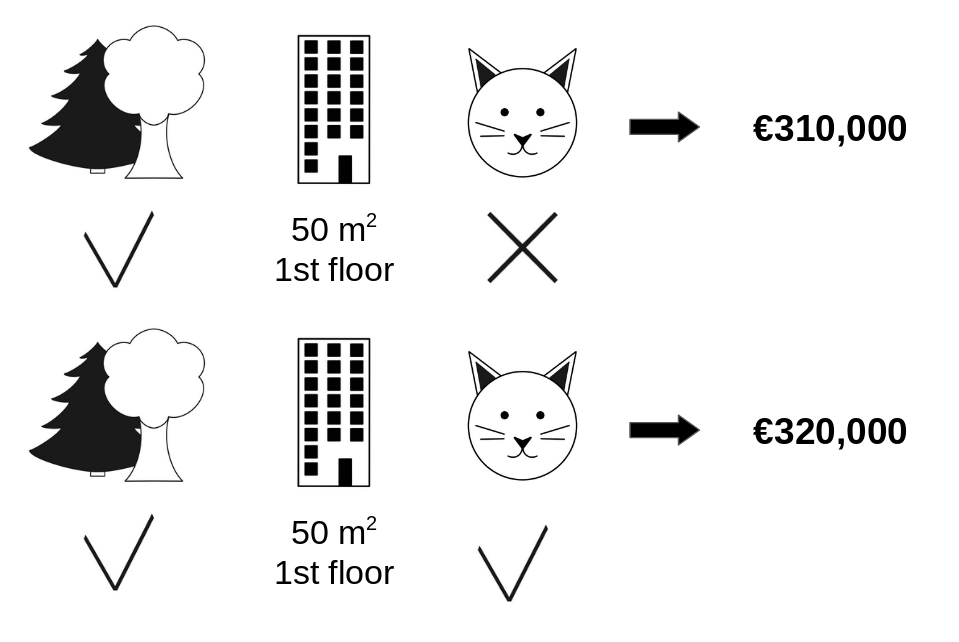
집값을 결정짓는 요인으로, [숲세권, 면적, 층, 고양이 양육 가능 여부] 등의 Feature 가 존재합니다.
'고양이 양육 가능 여부' 의 집값에 대한 기여분은, 그 외 모든 Feature 가 동일하다는 가정 하에,
310,000 (고양이 함께 살기 불가능) - 320,000 (고양이 함께 사는 것 가능) = -10,000 으로 계산됩니다.
이러한 과정을 모든 가능한 조합에 대해 반복합니다.
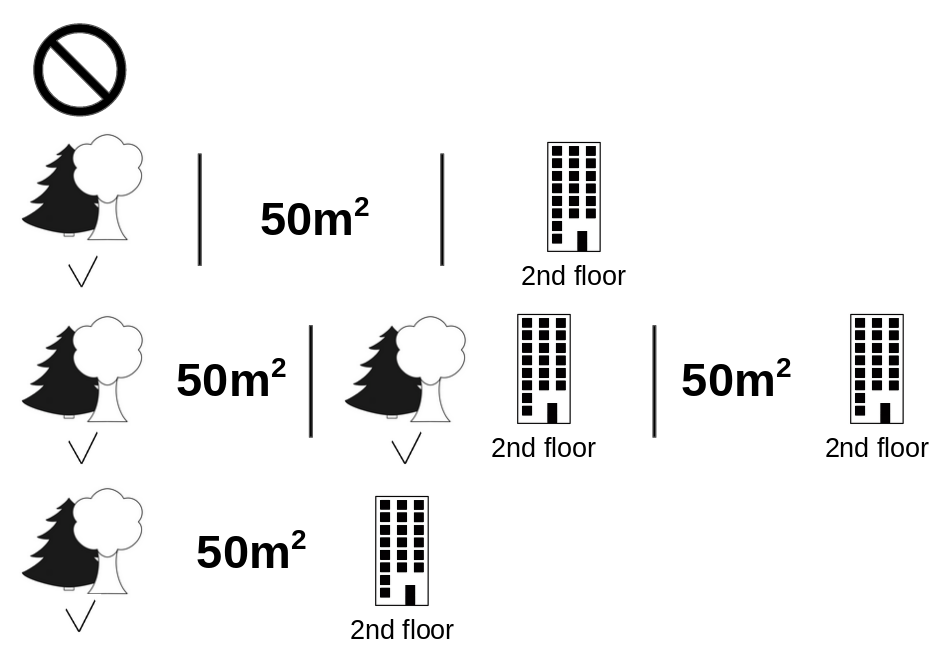
[숲세권, 면적, 층, 고양이 양육 가능 여부] : 4개
= 8 개의 조합이 존재하며, 8개의 조합에 각각에 대해
{f(조합1 😺) - f(조합1)} + ... + {f(조합8 😺) - f(조합8)} 값을 산출하고, 이를 가중평균 하여 (😺) 를 구합니다.
Classic Shapley Value Estimation
- consistency : 매 회 계산할 때 마다 같은 결과를 출력합니다.
- multicollinearity : 서로 영향을 미칠 가능성을 고려합니다.
- Feature Importance 가 고려하지 못하는, 음의 영향력을 고려할 수 있습니다.
2. Additive Feature Attribution Method
Definition
Additive Feature Attribution Methods have an explanation model that is a linear function of binary variables :

- : explanation model ,
- : original prediction model
- : simplified input ,
- : mapping function ,
- : attribution value
ex. LIME, DeepLIFT, Layer-Wise Relevance Propagation, Shapley Value
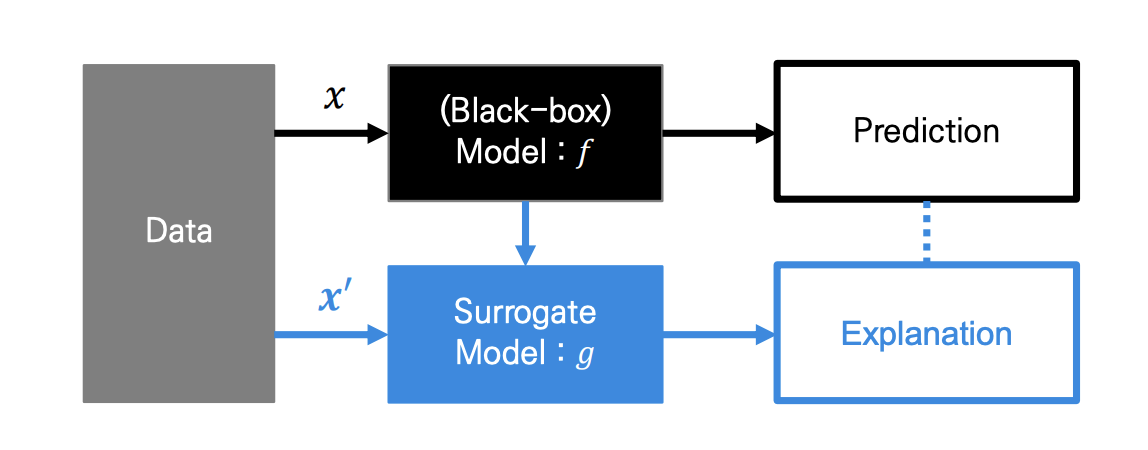
복잡한 모델 대신, 해석이 간단한 모델 로 해석하고자 합니다.
는 복잡한 모델에 특화되어 있는, 복잡한 데이터입니다.
따라서 의 해석 용이성을 위해 간단화 된 변수 를 사용하고자 하며,
Simplified input 는 라는 mapping function 으로 정의됩니다.
라는 가정을 통해, 으로 표현되며,
(1 : input is included in the model / 0 : excluded)
가 되도록 Surrogate Model 은 학습됩니다.
✔︎ Additive Feature Attrbution
원래의 input 가 아닌, Simplified input 를 통해,
를 만족하는 Explanation Model 를 만드는 방법입니다.
Properties
✔︎ Desirable Properties
Feature Attribution 은 1. Local Accuracy, 2. Missingness, 3. Consistency 특성 모두를 만족하기를 원합니다.
1. Local Accuracy

simplified input 를 explanation model 에 넣었을 때의 output 는, original input 에 대한 와 match 가 잘 되어야 합니다.
✓ (Efficiency) 각 팀원 점수를 합치면, 전체 점수가 되어야 합니다.
2. Missingness

Feature 값이 없다면, Attribution 값도 0이 되어야 합니다.
✓ 팀플에 참여하지 않았다면, 개인 점수는 0점이 되어야 합니다.
3. Consistency

모델이 변경되어 Feature 의 Marginal Contribution 이 (다른 특성에 관계없이) 증가하거나 동일하게 된다면, Attribution 도 증가하거나 동일하게 유지되어야 하며, 감소할 수 없습니다.
✓ 매번 똑같은 방식으로 play 했다면, 결과 점수가 똑같아야 합니다.
Theorem

Additive Feature Attribution 의 정의와 3가지 Desired Properties 를 만족하는 유일한 방법은, Theorem1 수식입니다.
SHAP = Shapley Value 를 사용하여, Additive Method 를 만족시키는 Explanation Model
3. SHAP
SHAP : Shapley Value 의 Conditional Expectation
Simplified Input을 정의하기 위해 정확한 값이 아닌, 의 Conditional Expectation을 계산합니다.

오른쪽 화살표 () 는 원점으로부터 가 높은 예측 결과를 낼 수 있게 도움을 주는 요소이고, 왼쪽 화살표 () 는 예측에 방해가 되는 요소입니다.
- SHAP은 Shapley Value (Local Explanation) 기반으로 하여, 데이터 셋의 전체적인 영역을 해석이 가능합니다. (Global Surrogate)
- 모델 의 특징에 따라, 계산법을 달리하여 빠르게 처리합니다.
- Kernel SHAP : Linear LIME + Shapley Value
- Tree SHAP : Tree based Model
- Deep SHAP : DeepLearning based Model
Kernel SHAP
instance 에 대한 explanation 을 구합니다.

- Feature value 에서, 조합을 생성합니다.
단, 를 그대로 사용하지 않고, 로 사용하는, Random Feature Coalition 을 생성합니다. - 인 경우 actual feature value 에 mapping 되고,
인 경우 random sample value 로 mapping 됩니다.
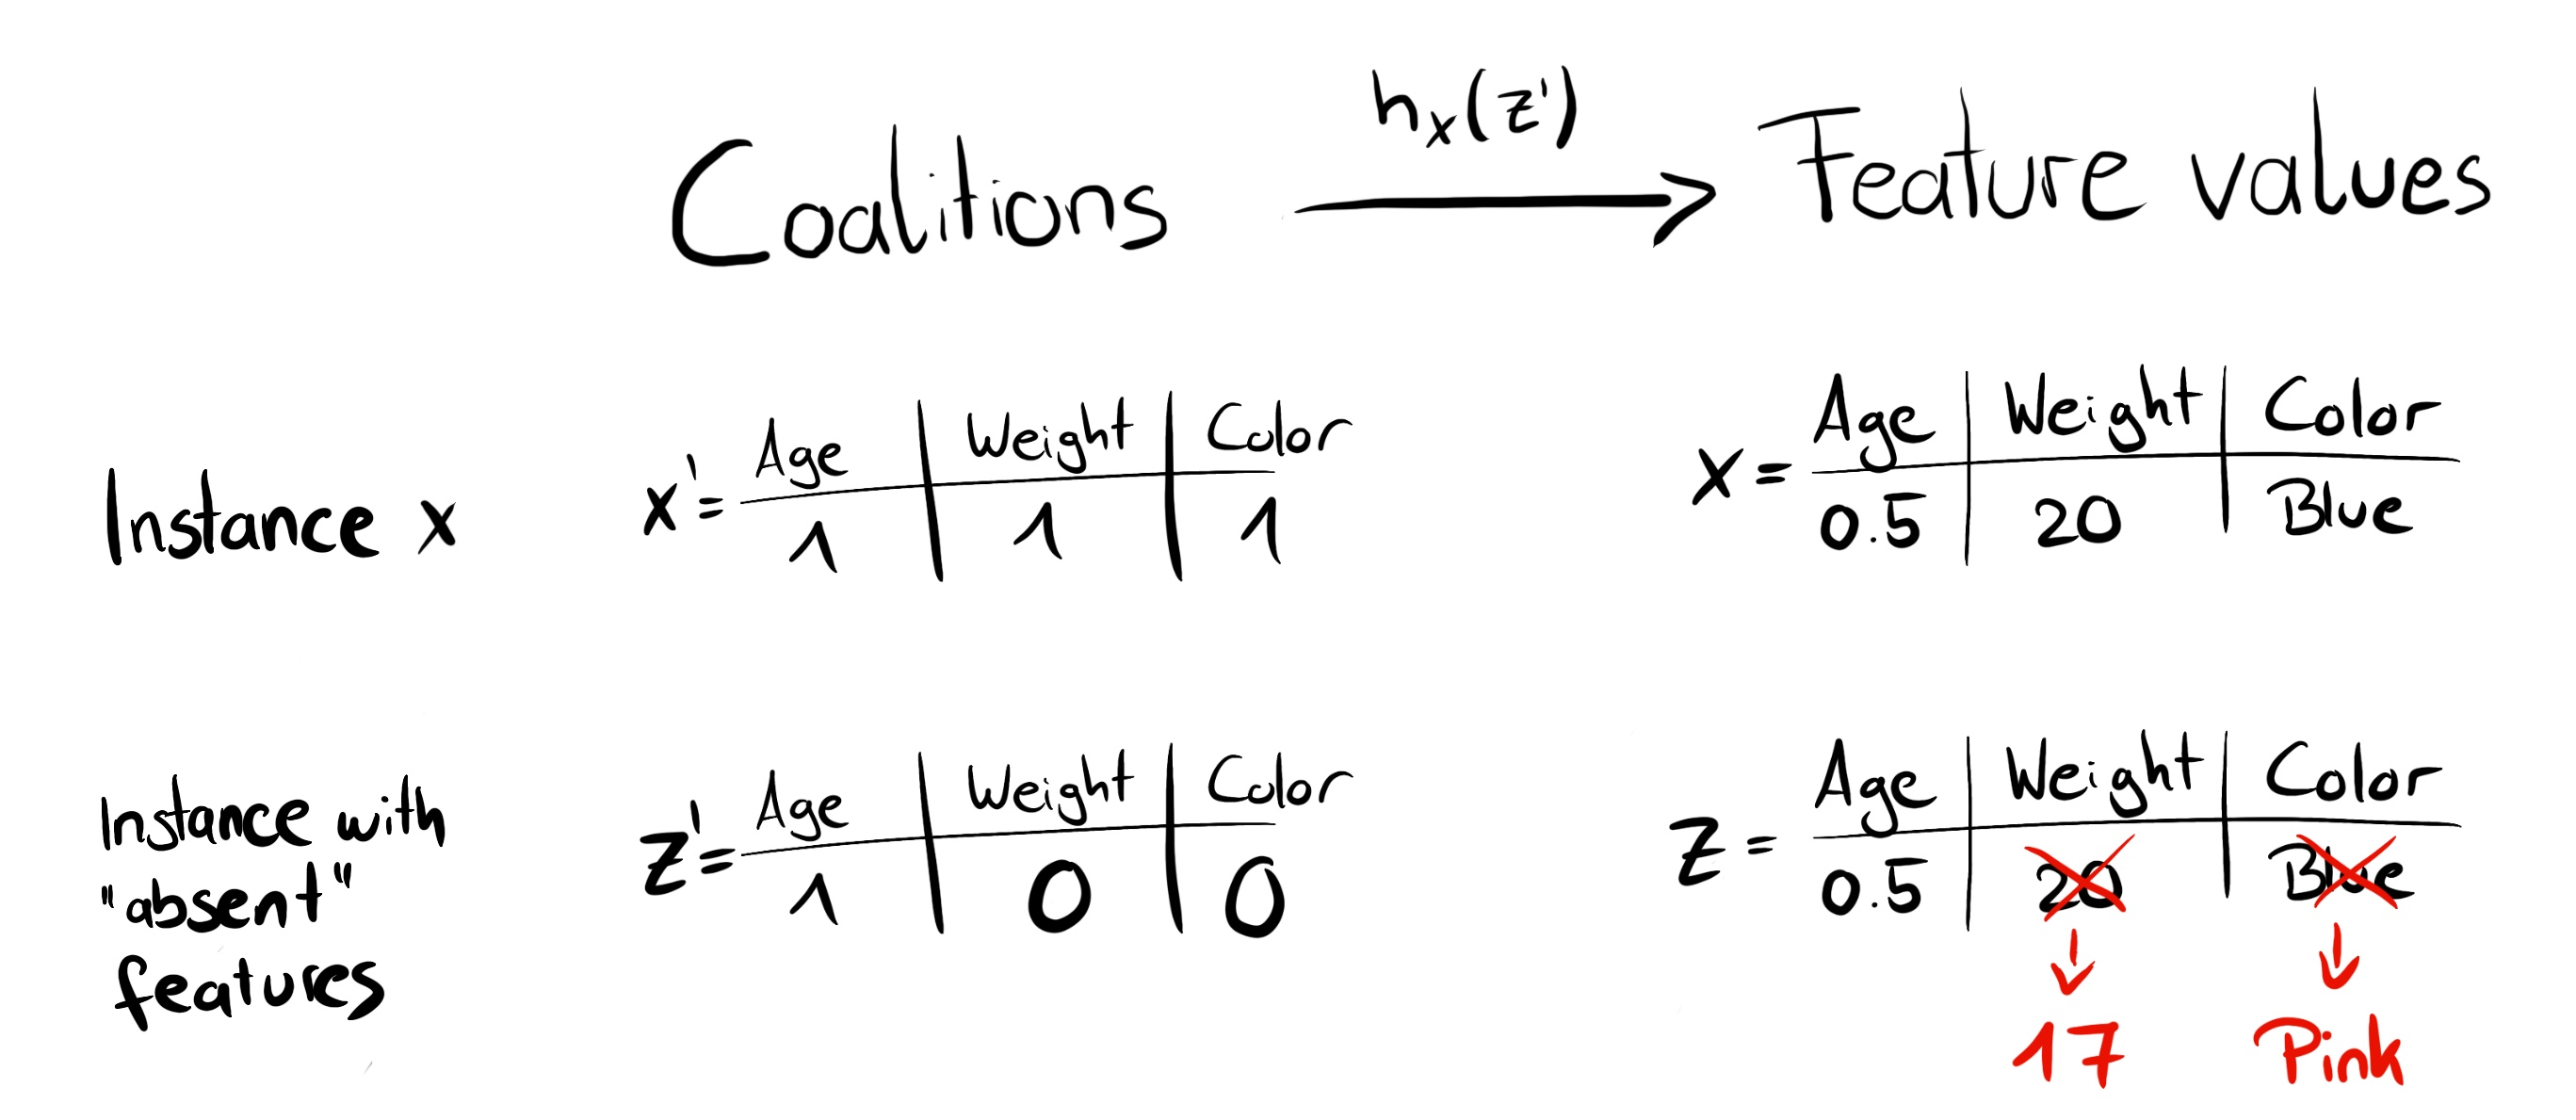
- 를 본래의 feature space 로 mapping 시킨 다음, 모델 에 적용함으로써, 예측값을 얻습니다.
즉, Local Surrogate Model 에 대한 설명변수는 0과 1로 이루어진 값이 되며, 반응변수는 이에 대한 예측값이 됩니다. - 각 Feature 조합마다 SHAP Kernel 을 적용하여, Weight 를 계산해 Linear Model 를 적합시킵니다.
- Linear Model 로 부터 계수값인 = Shapley Value 를 반환합니다.
Tree SHAP
Tree Ensemble Model 의 Feature Importance 는 모델(or 트리)마다 산출값이 달라지기 때문에, Inconsistent 하다는 한계점이 존재합니다.
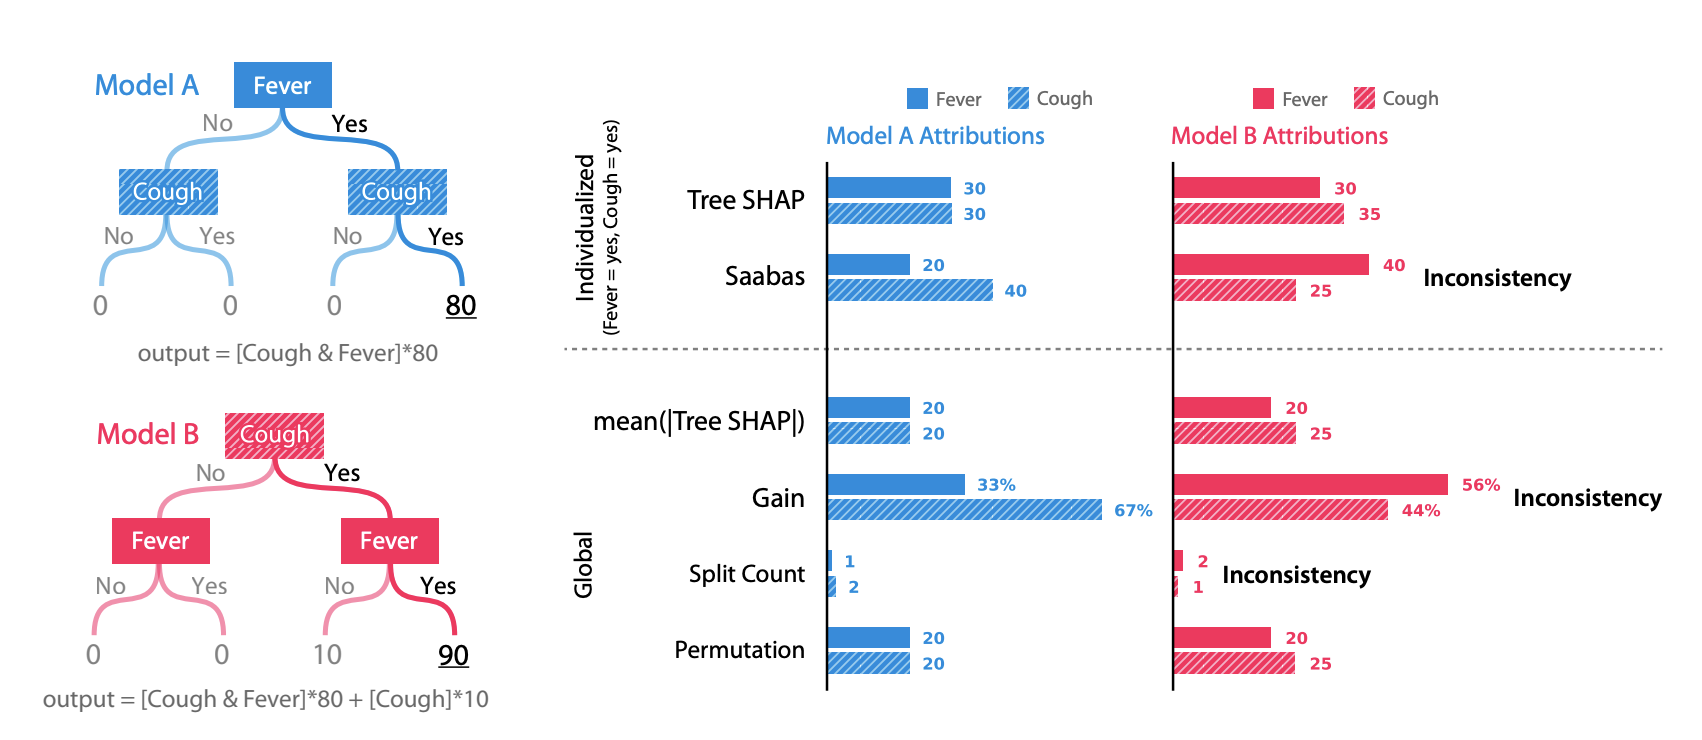
Tree Model A 와 B 의 Feature 는 Fever, Cough 로 동일하지만, split 순서가 다릅니다. Split 순서에 기반하여 계산되는 Gain, Split Count 등의 산출값이 달라지는 것을 확인할 수 있습니다.
즉, 같은 데이터로부터 학습이 된 모델이지만, 모델마다 Feature Importance 가 달라지게 됩니다.
SHAP 은 Split 순서와 무관하게, Consistent 한 Feature Importance 를 계산할 수 있습니다.
= 가 속하는 Leaf node의 score 값 해당 node에 속하는 Training 데이터의 비중
각 Tree 마다 Conditional Expectation 를 구해, 다 더하여 최종 값을 산출합니다.
시간복잡도 :
T : 트리의 개수, L : 모든 트리의 최대 leaf 수, D : 모든 트리의 최대 깊이
Kernel SHAP 에 비해 속도가 빠릅니다.
4. Code
1. Tree SHAP
# import packages
import pandas as pd
import numpy as np

from xgboost import XGBRegressor, plot_importance
from sklearn.model_selection import train_test_split

import shap

# load data
X, y = shap.datasets.boston()
X_train, X_test, y_train, y_test = train_test_split(X, y, test_size=.2, random_state=1)

# modeling
model = XGBRegressor()
model.fit(X_train, y_train)
보스턴 주택 가격 데이터를 통해, 집값을 결정짓는 요인에 대해 알아봅니다.
XGBoost Regressor 로 집값을 예측하는 모델을 만들고, SHAP value 를 통해 Feature Attribution 을 파악합니다.
0. Load SHAP
# load js
shap.initjs()

'''
KernelExplainer() : KNN, SVM, RandomForest, GBM, H2O
TreeExplainer() : tree-based machine learning model (faster)
DeepExplainer() : deep learning model
'''

explainer = shap.TreeExplainer(model)
shap_values = explainer.shap_values(X_train)
1. force_plot
특정 데이터 하나 & 전체 데이터에 대해, Shapley Value 를 1차원 평면에 정렬해서 보여줍니다.
# 첫 번째 데이터에 대한 SHAP 시각화
shap.initjs()
shap.force_plot(explainer.expected_value, shap_values[0,:], X_train.iloc[0,:])
특정 데이터 (궁금한 어떤 주택)에 대한 Shapley value 를 분해하고 시각화합니다.
집값 상승에 긍정적인 영향을 준 요인은 LSTAT (동네의 하위 계층 비율) 이며, 부정적인 영향을 준 요인은 RM (방의 수) 입니다.
비슷한 조건의 다른 주택에 비해 방의 수 요인이 집값 형성에 부정적인 영향을 미쳤다고 해석할 수 있습니다.
# Outlier 에 대한 SHAP 시각화
shap.initjs()
shap.force_plot(explainer.expected_value, shap_values[259,:], X_train.iloc[259,:])
주요 업무지까지 거리가 가깝고 (DIS), 주변 지역에 하위 계층 사람들이 적게 살면서 (LSTAT), 범죄율이 극도로 낮으므로 (CRIM), 주택 자체의 상태보다 주변 환경에 의해 좋은 집값이 형성되었음을 알 수 있습니다.
# 전체 데이터에 대한 SHAP 시각화
shap.initjs()
shap.force_plot(explainer.expected_value, shap_values, X_train)
전체 데이터에 대해 Shapley Value를 누적하여 시각화 할 수 있으며, 이를 기반으로 Supervised Clustering 또한 진행할 수 있다고 합니다.
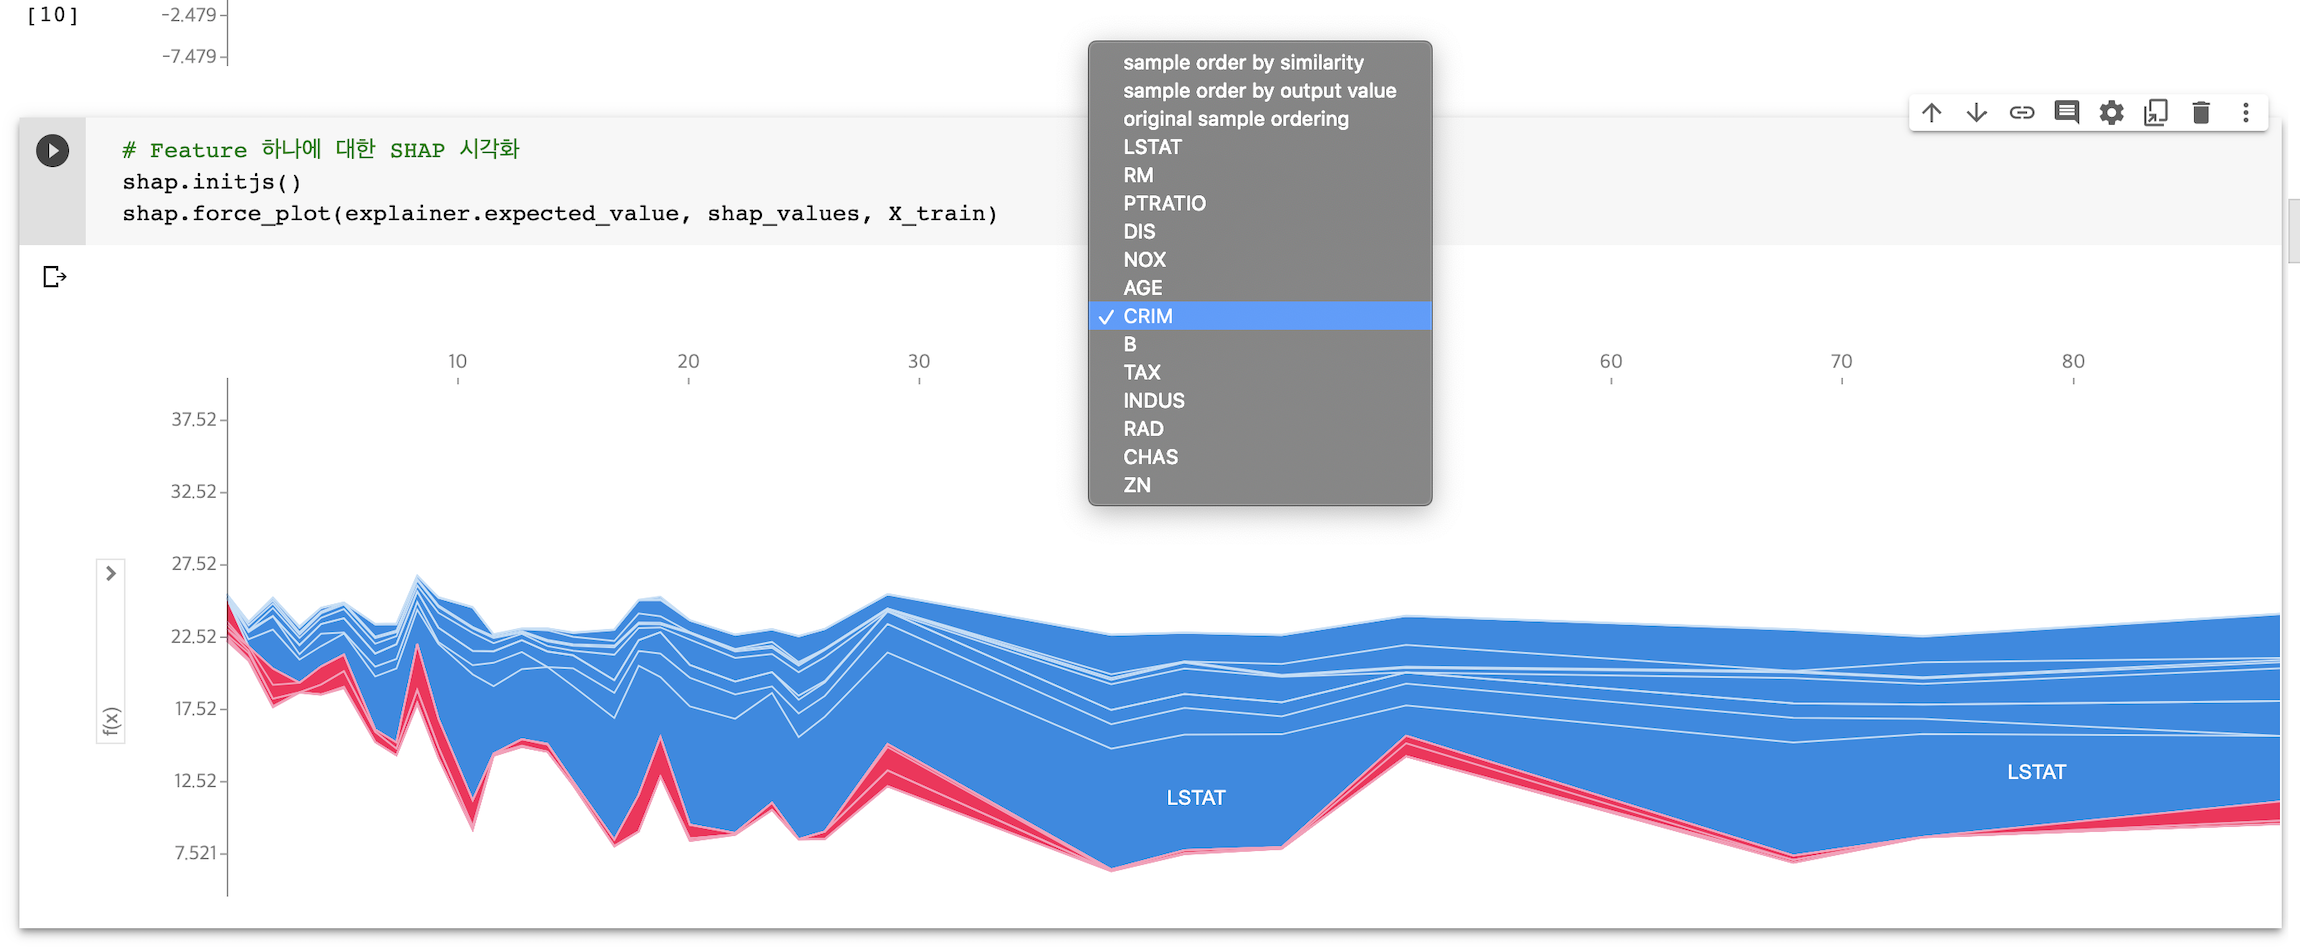
Feature 하나에 대한 전체 누적 Shapley Value 를 구할 수 있습니다.
2. dependence_plot
Feature 하나에 대한 SHAP 영향력을 보여줍니다.
shap.initjs()
top_inds = np.argsort(-np.sum(np.abs(shap_values), 0))  # (13, ) : 각각의 Feature 에 대해 shap value 다 더한 것

# make SHAP plots of the three most important features
for i in range(2):
    shap.dependence_plot(top_inds[i], shap_values, X_train)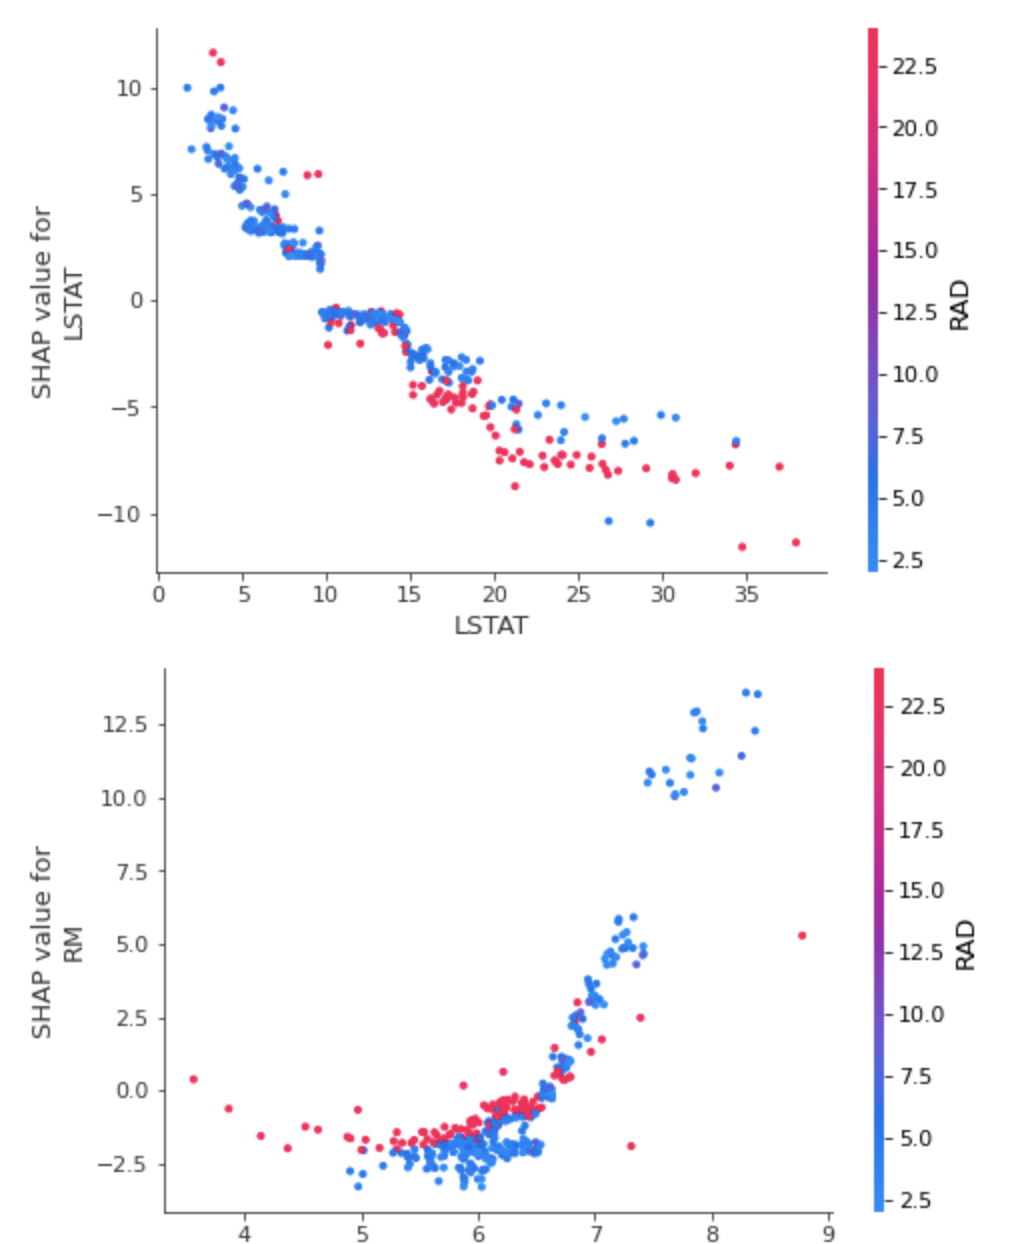
위의 코드는 영향력이 큰 변수들 순서대로 출력하는 방법이며, top_inds[i] 에 특정 Feature 를 넣어 영향력을 파악할 수 있습니다.
3. summary_plot
shap.summary_plot(shap_values, X_train)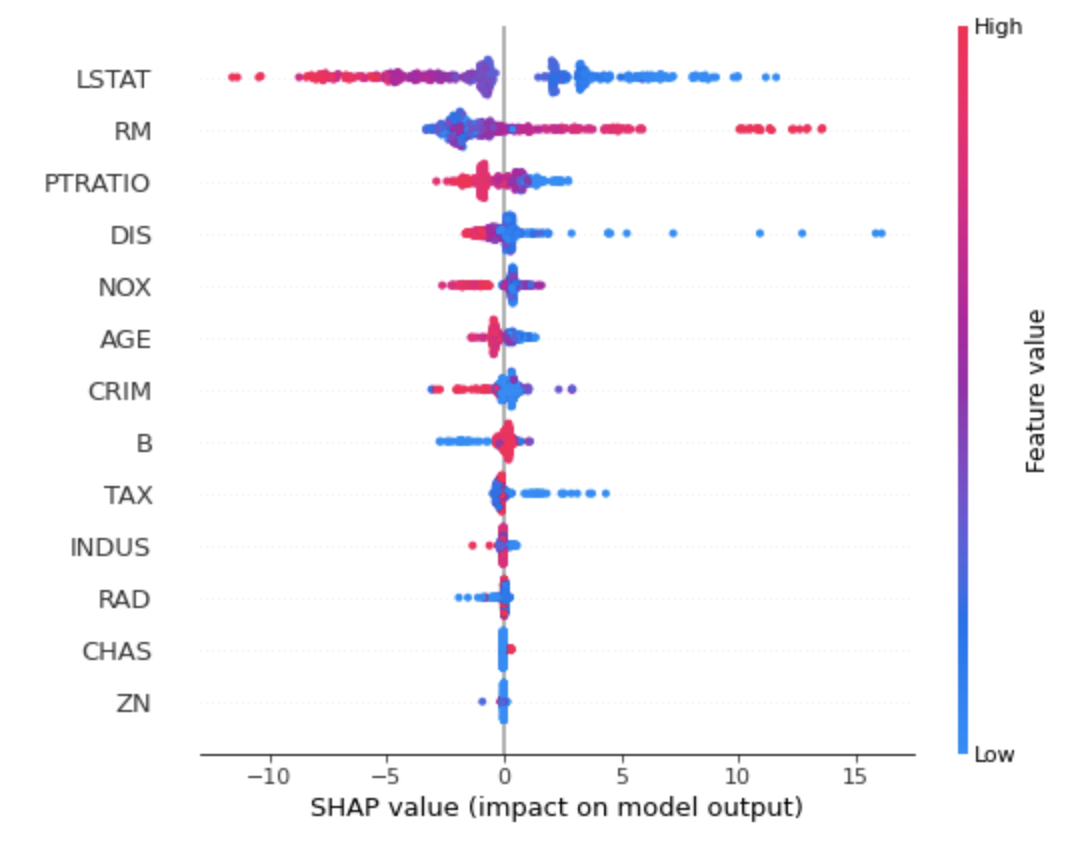
전체 Feature 들이 Shapley Value 분포에 어떤 영향을 미치는지 시각화 할 수 있습니다.
shap.summary_plot(shap_values, X_train, plot_type='bar')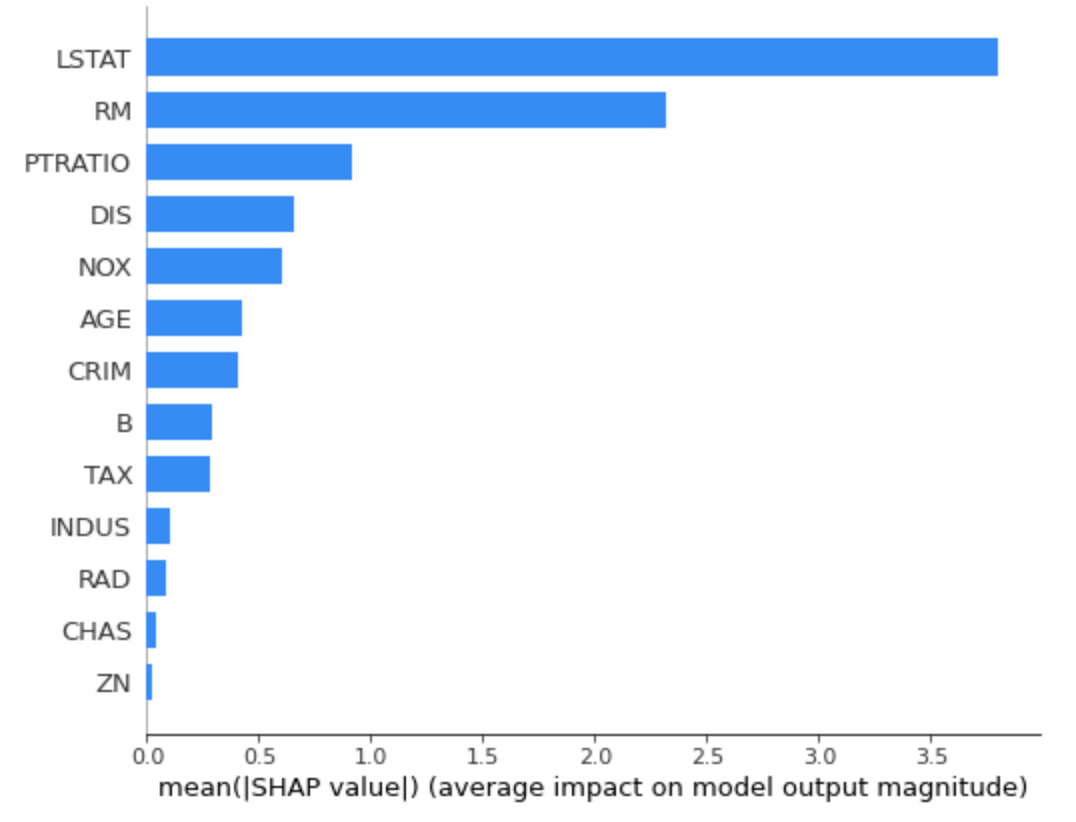
각 Feature 가 모델에 미치는 절대 영향도를 파악할 수 있습니다.
4. interaction plot
shap_interaction_values = shap.TreeExplainer(model).shap_interaction_values(X_train)

# main effect on the diagonal
# interact effect off the diagonal
shap.summary_plot(shap_interaction_values, X_train)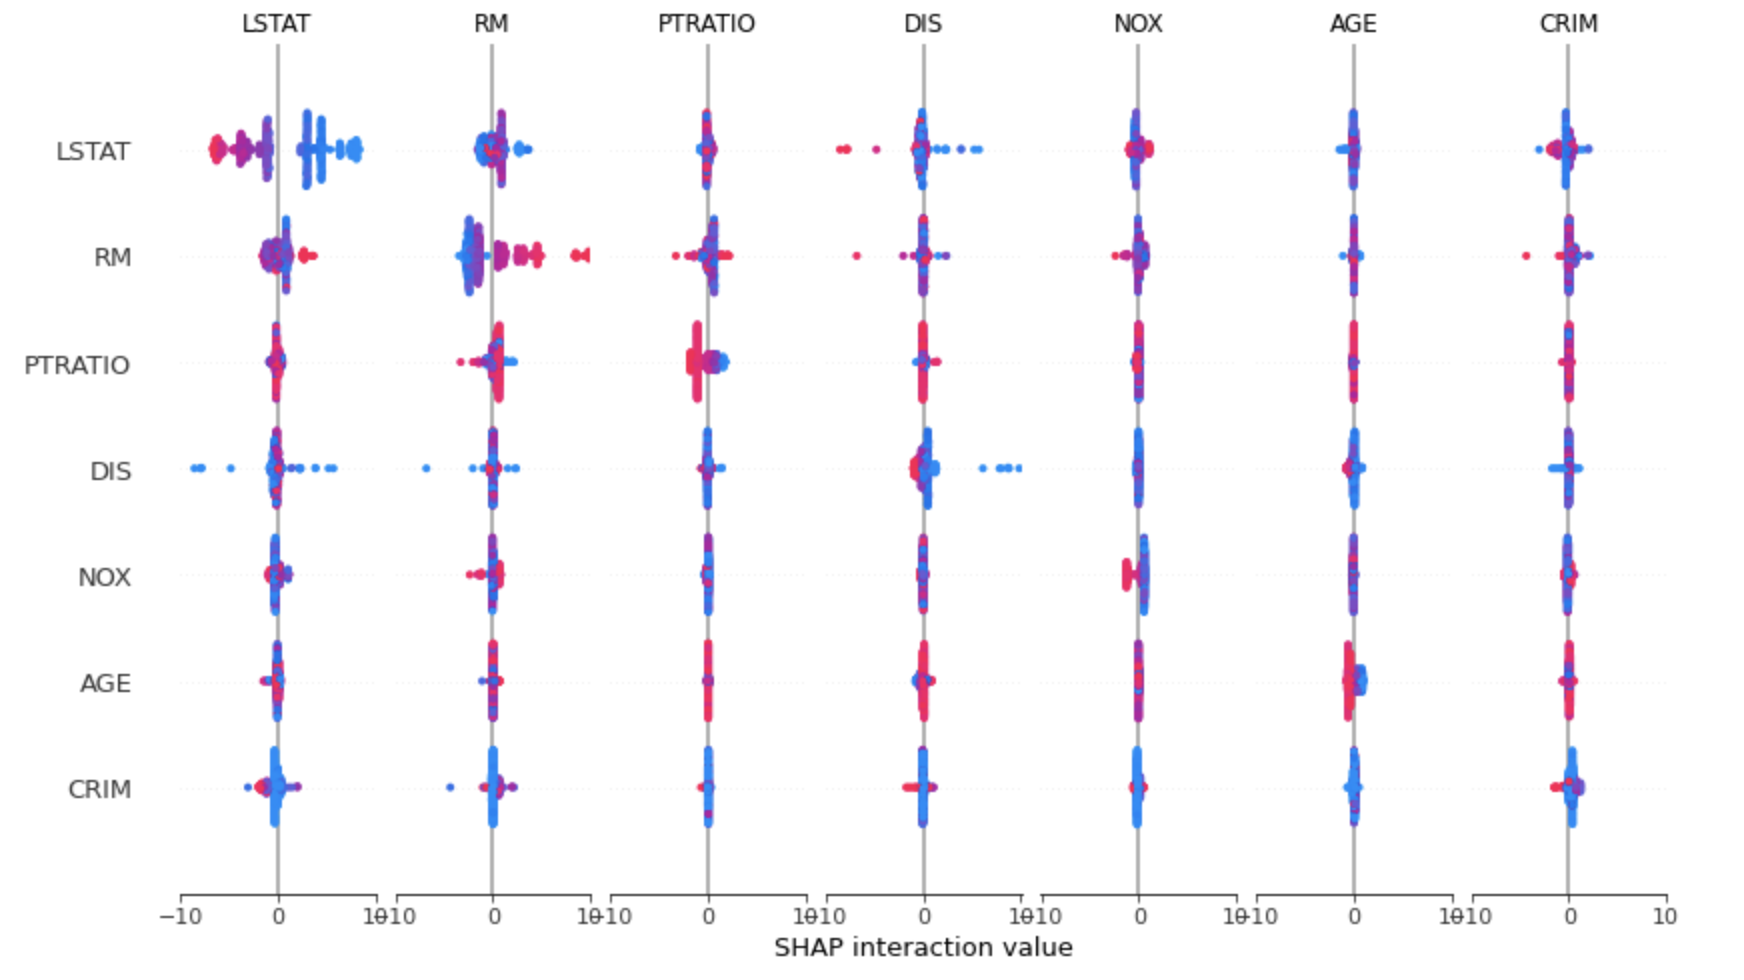
Feature 사이의 interaction 또한 파악할 수 있습니다.
shap.dependence_plot(
    ("RM", "LSTAT"),
    shap_interaction_values, X_train,
    display_features=X_train
)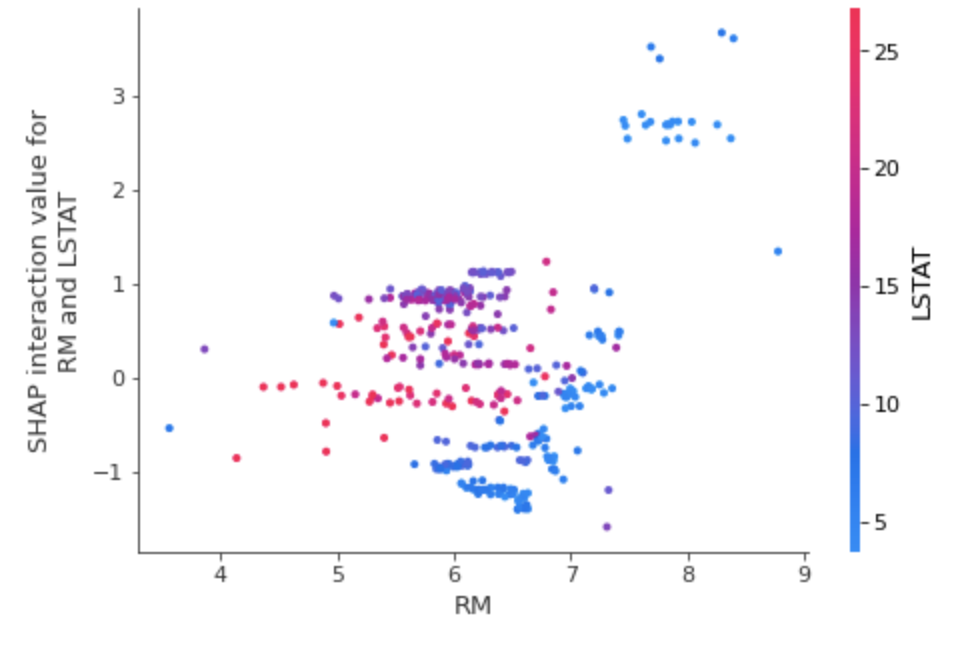
dependency_plot 을 통해 두 개 변수 사이의 영향력 시각화 가능합니다.

영향력 분해 또한 가능하다고 합니다.
(출처 : Explainable AI for Trees: From Local Explanations to Global Understanding)
2. Deep SHAP
1. NLP
import transformers
transformer = transformers.pipeline('sentiment-analysis', return_all_scores=True)

explainer2 = shap.Explainer(transformer)
shap_values2 = explainer2(["What a great movie! ...if you have no taste."])

shap.plots.text(shap_values2[0, :, "POSITIVE"]) 
2. DeepSHAP
import tensorflow as tf

# 1. dataset 불러오기
mnist = tf.keras.datasets.mnist
(x_train, y_train), (x_test, y_test) = mnist.load_data()
x_train, x_test = x_train / 255.0, x_test / 255.0  # image scaling : (0,1) 범위로 바꿔주기

# 2. model 구성하기
model = tf.keras.models.Sequential([
  tf.keras.layers.Flatten(input_shape=(28, 28)),
  tf.keras.layers.Dense(128, activation='relu'),
  tf.keras.layers.Dropout(0.2),
  tf.keras.layers.Dense(10, activation='softmax')
])

# 3. model 학습과정 설정하기
model.compile(optimizer='adam',
              loss='sparse_categorical_crossentropy',
              metrics=['accuracy'])

# 4. model 학습
model.fit(x_train, y_train, epochs=3)
# select a set of background examples to take an expectation over
background = x_train[np.random.choice(x_train.shape[0], 100, replace=False)]
# explain predictions of the model on four images
e = shap.DeepExplainer(model, background)
# ...or pass tensors directly
# e = shap.DeepExplainer((model.layers[0].input, model.layers[-1].output), background)
shap_values = e.shap_values(x_test[:5])
# plot the feature attributions
shap.image_plot(shap_values, -x_test[:5])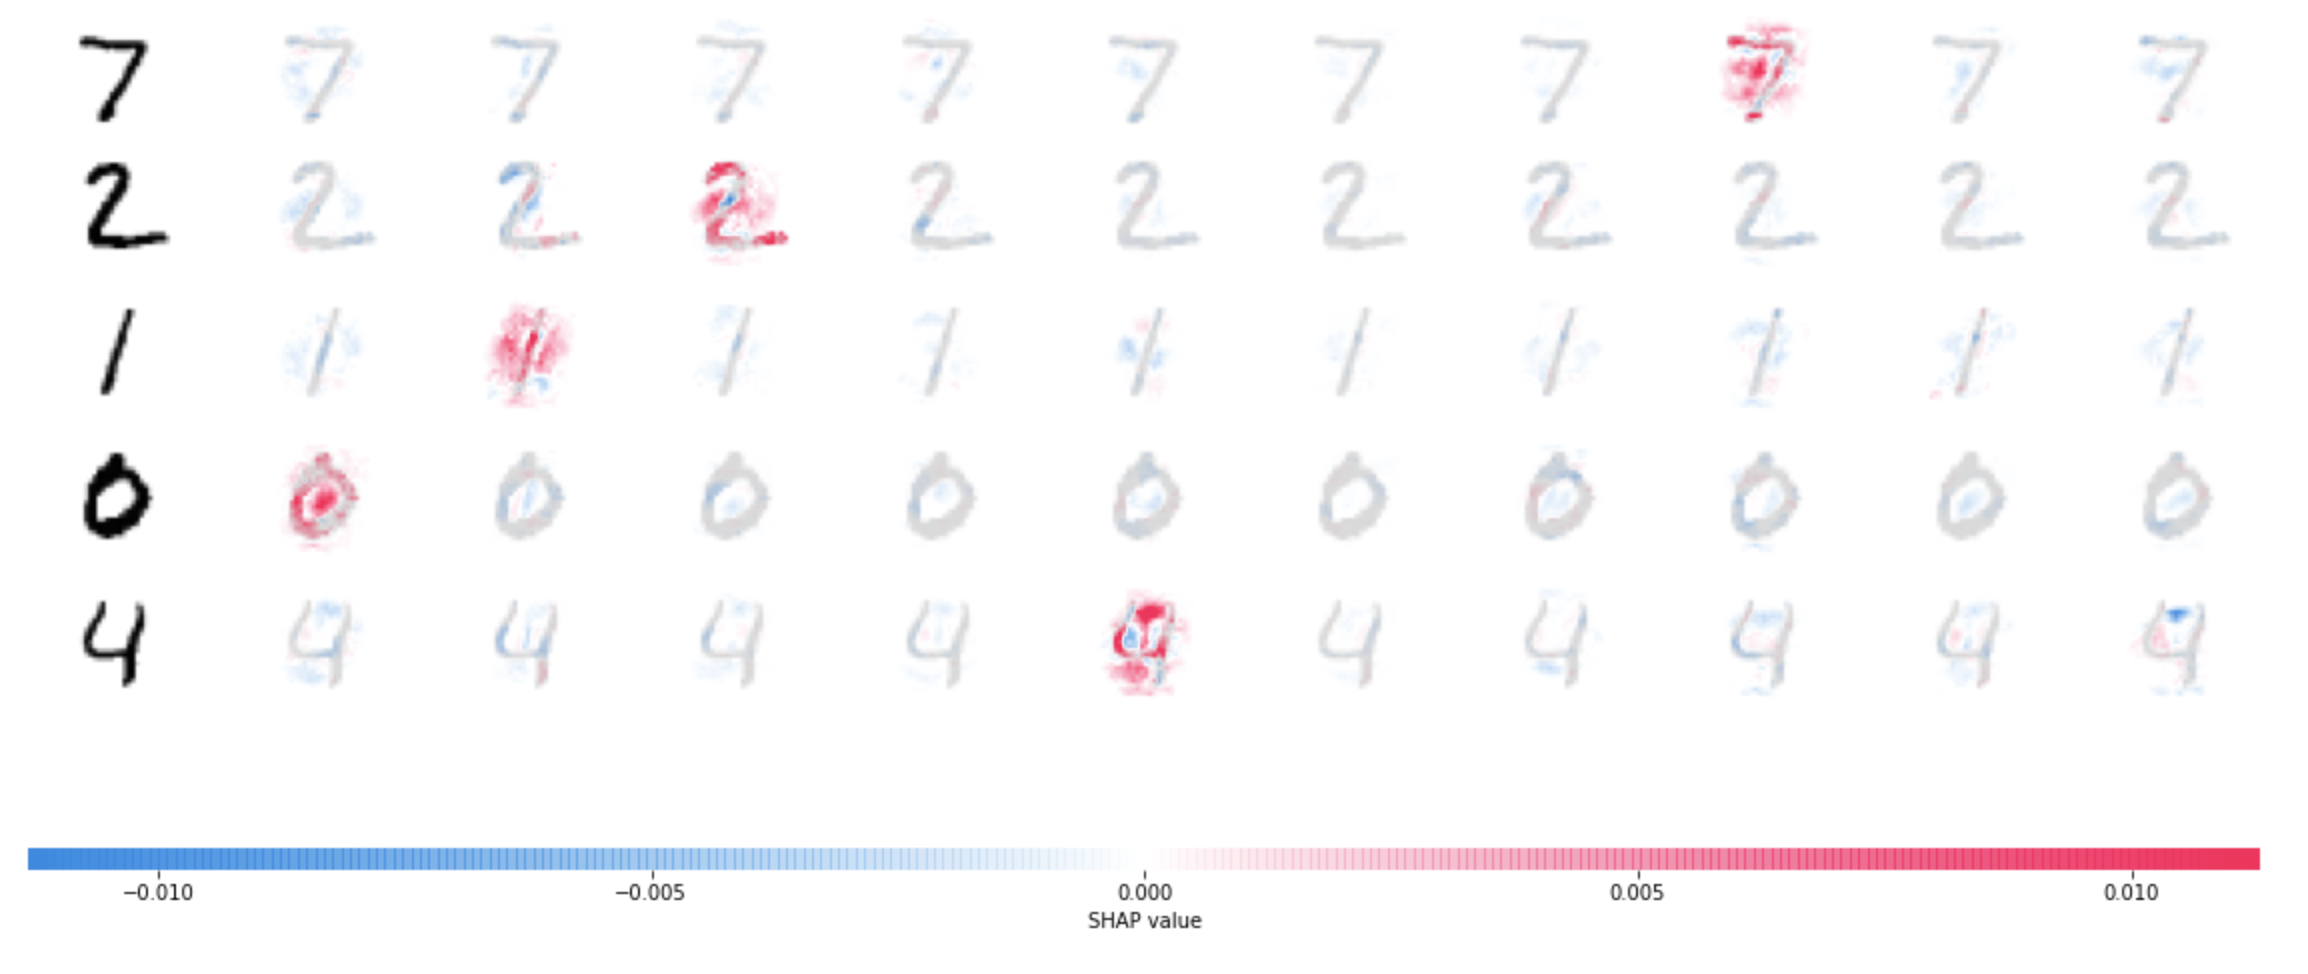
mnist classification 에 대한 SHAP 시각화 결과입니다.
4 와 9 를 예측함에 있어서 - 부분이 핵심적인 역할을 한다고 해석할 수 있습니다.
3. GradientExplainer
from keras.applications.vgg16 import VGG16
from keras.applications.vgg16 import preprocess_input
import tensorflow.python.keras.backend as K
import json

# load pre-trained model and choose two images to explain
model = VGG16(weights='imagenet', include_top=True)
X,y = shap.datasets.imagenet50()
to_explain = X[[39,41]]

# load the ImageNet class names
url = "https://s3.amazonaws.com/deep-learning-models/image-models/imagenet_class_index.json"
fname = shap.datasets.cache(url)
with open(fname) as f:
    class_names = json.load(f)

# explain how the input to the 7th layer of the model explains the top two classes
def map2layer(x, layer):
    feed_dict = dict(zip([model.layers[0].input], [preprocess_input(x.copy())]))
    return K.get_session().run(model.layers[layer].input, feed_dict)
e = shap.GradientExplainer(
    (model.layers[7].input, model.layers[-1].output),
    map2layer(X, 7),
    local_smoothing=0 # std dev of smoothing noise
)
shap_values,indexes = e.shap_values(map2layer(to_explain, 7), ranked_outputs=2)

# get the names for the classes
index_names = np.vectorize(lambda x: class_names[str(x)][1])(indexes)

# plot the explanations
shap.image_plot(shap_values, to_explain, index_names)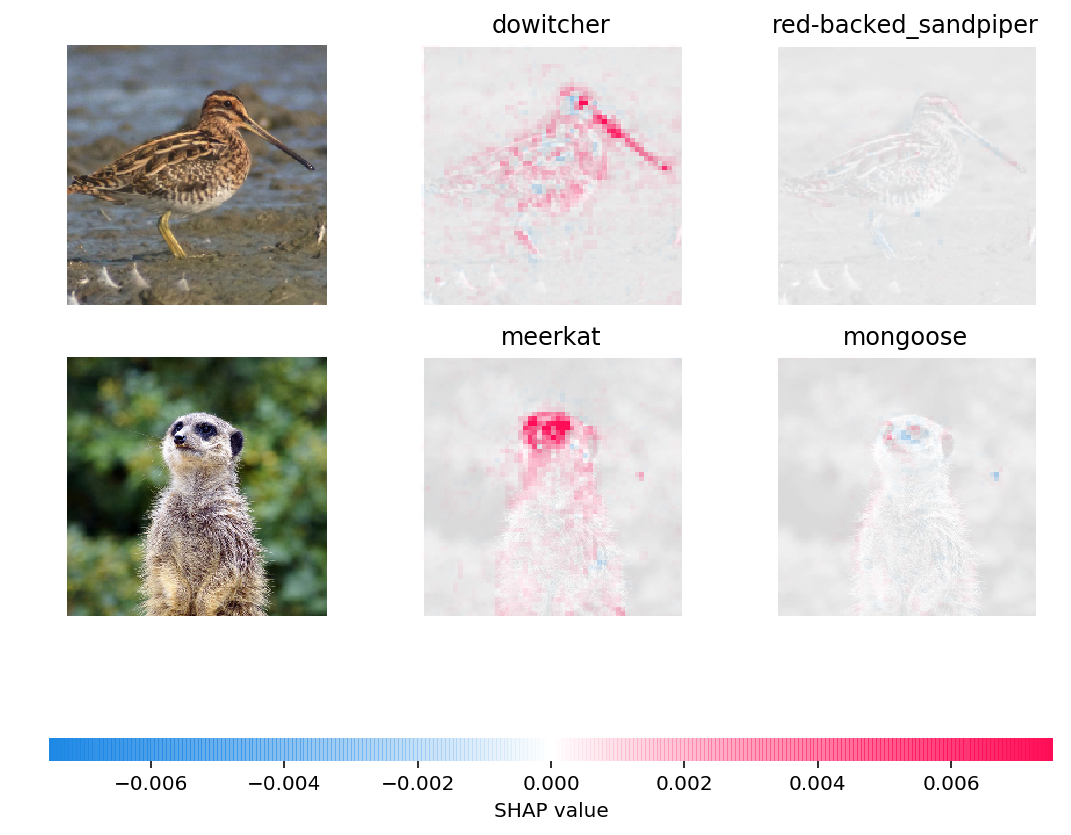
각 Class 를 예측함에 있어서, 어떤 부분이 중요한 역할을 했는지 볼 수 있습니다.
Reference
- XAI, 설명 가능한 인공지능, 인공지능을 해부하다 (안재현. 2020)
- 고려대학교 DMQA Seminar : An Overview of Model-Agnostic Interpretation Methods
- Interpretable Machine Learning : A Guide for Making Black Box Models Explainable (Christoph Molnar. 2021)
Code & Papers
SHAP: https://github.com/slundberg/shap- SHAP documentation : https://shap.readthedocs.io/en/latest/index.html
- Scott Lundberg et al. (2017). A Unified Approach to Interpreting Model Predictions
- Scott Lundberg et al. (2018). Consistent Individualized Feature Attribution for Tree Ensembles
- 허재혁님 Review : SHAP에 대한 모든 것
- daehani님 Review : Shapley value, SHAP, Tree SHAP
