Regression is one of the classic mathematical methods for data analysis, a staple in textbooks and much of the literature. Linear regression provides an optimal approximation to the given data. The value of the data can be thought of as the sum of the linear approximation and a statistically random number called noise.
Linear regression is used in many businesses and sciences. One of the reasons linear regression is so popular is for prediction. A prominent outlier can be seen as a singularity of sorts. And the simplicity of expressing the trend in terms of intercept and slope is also a plus. However, they can be inaccurate when there is a lot of noise. That's where Segmented Linear Regression comes in.
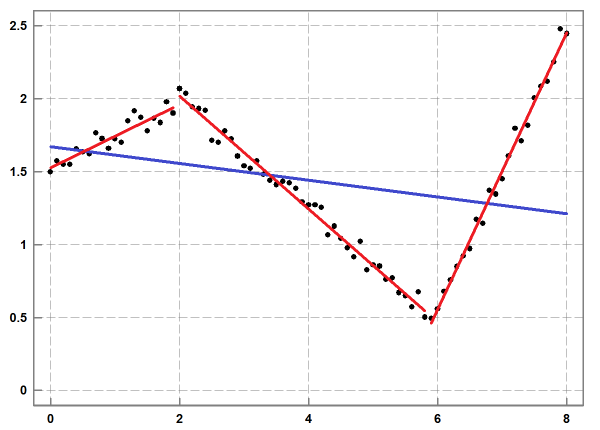
The following chart is a great illustration of what split linear regression is all about.
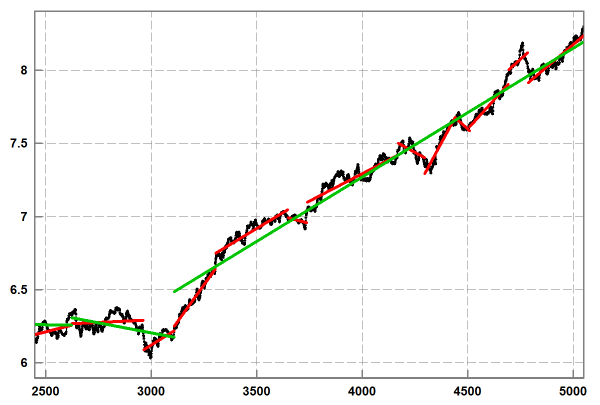
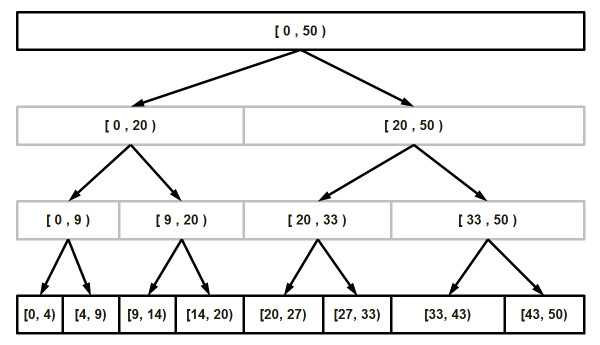
I wonder if this would be useful for stock investing, as it seems to be able to recognize trends. This post is based on Vadim Stadnik's Segmented Linear Regression post on CodeProject. I didn't read the whole thing because I don't like to study, but the algorithm creates bins, creates a median value in between, then takes the median and the surrounding values as a range, and finds the median again. You can imagine it like a cell dividing... The algorithm is pretty easy to understand if you look at the image below.
Here is an example using the sample data and source code provided in the post (I don't provide a separate usage example. I created a separate header file (SegmentedRegression.h))
#include <iostream>
#include <fstream>
#include <cstdlib> // for exit function
#include <vector>
#include "SegmentedRegression.h"
using namespace std;
int main(int argc, char** argv)
{
ifstream indata; // indata is like cin
double num1, num2; // variables for input value
// input dataset
std::vector<double> data_x_user ;
std::vector<double> data_y_user ;
// result of algorithm
std::vector<double> data_x_slr ;
std::vector<double> data_y_slr ;
// user specified approximation accuracy
const double devn_max = 0.5 ;
// half length of smoothing window ( h_len+1+h_len )
// for simple moving average
const int half_len = 10 ;
indata.open("sample_data\\real_data.txt"); // opens the file
if(!indata) { // file couldn't be opened
cerr << "Error: file could not be opened" << endl;
exit(1);
}
while ( !indata.eof() )
{
indata >> num1 >> num2;
data_x_user.emplace_back(num1);data_y_user.emplace_back(num2);
}
indata.close();
cout << "End-of-file reached.." << endl;
//// fast algorithm for segmented linear regression
if (SegmentedRegressionFast( data_x_user, data_y_user, devn_max, half_len, data_x_slr, data_y_slr))
{
ofstream myfile ("SegmentedFAST.csv");
if (myfile.is_open())
{
for(unsigned i = 0; i < data_x_slr.size(); ++i) {
myfile<< data_x_slr[i] << "," << data_y_slr[i] << "\n";
}
myfile.close();
cout << "just saved SegmentedFAST.csv for fast algorithm";
}
else cout << "Unable to open file for fast algorithm";
}
//// slow algorithm for segmented linear regression
if (SegmentedRegressionThorough( data_x_user, data_y_user, devn_max, data_x_slr, data_y_slr))
{
ofstream myfile ("SegmentedThorough.csv");
if (myfile.is_open())
{
for(unsigned i = 0; i < data_x_slr.size(); ++i) {
myfile<< data_x_slr[i] << "," << data_y_slr[i] << "\n";
}
myfile.close();
cout << "just saved SegmentedThorough.csv for slow algorithm";
}
else cout << "Unable to open file for slow algorithm";
}
return 0;
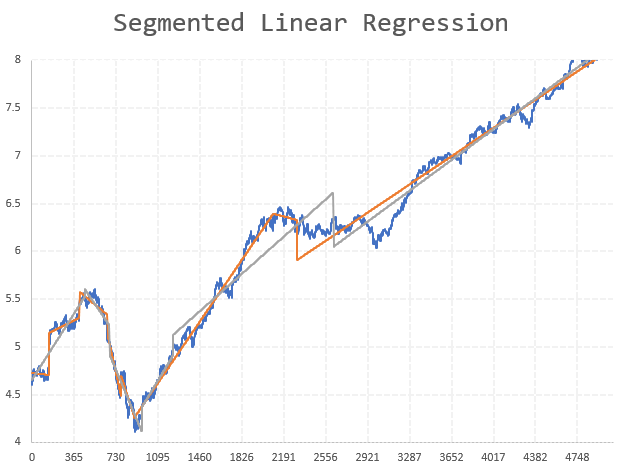
} I read the output into Excel and plotted the following chart.