1. library
library(readr)
library(dplyr)
library(tidyr)
library(stringr)
library(tidyverse)
2. 누적 데이터 기준
1) 경로 확인 및 데이터 호출
getwd()
setwd("C:/Rwork/csse_covid_19_daily_reports")
data2022 <- read.csv('07-31-2022.csv')
data2021 <- read.csv('07-31-2021.csv')
2) 결측치 확인
: 계산 전 결측치를 확인하여 에러 방지
summary(data2021$Confirmed)
summary(data2022$Confirmed)
summary(data2021$Deaths)
summary(data2022$Deaths)
# NA 없는 것 확인 완료
3) 국가별 확진자 및 사망자
(1) 국가 기준 총합
- select(): 필요한 컬럼만 선택
- group_by(): 기술 통계 전 국가 기준으로 묶어줌
- summarise(): 사용하여 확진자 및 사망자 sum
group1 <- data2022 %>% select(Country_Region, Confirmed, Deaths) %>% group_by(Country_Region) %>% summarise(sum(Confirmed), sum(Deaths))
group2 <- data2021 %>% select(Country_Region, Confirmed, Deaths) %>% group_by(Country_Region) %>% summarise(sum(Confirmed), sum(Deaths))
(2) 대상 기간의 (마지막날 - 시작날)
- merge(): 두 개의 데이터 프레임을 병합
# 두 개의 연도를 국가명 컬럼을 기준으로 merge
acc_result <- merge(group1, group2, by='Country_Region', all = T)

# 구하고자 하는 기간의 확진자, 사망자 각각의 총합 구하기
acc_result$total_con <- acc_result$`sum(Confirmed).x` - acc_result$`sum(Confirmed).y`
acc_result$total_dea <- acc_result$`sum(Deaths).x`- acc_result$`sum(Deaths).y`
(3) 최종 데이터 산출
- mutate(): 필요한 컬럼만 선택
- options(scipen=100): 지수표기를 일반표기로 변경
- View(): 새로운 창에서 표의 형태로 보여줌
# 새로운 변수에 필요한 컬럼만 select 후 담기
total_result <- select(acc_result, Country_Region, total_con, total_dea)

# 새 변수에 새로운 컬럼 추가 후 구하고자하는 값(평균) 담기 (in 새 변수)
acc_final <- total_result %>% mutate(dailyMeanCon = (total_con/365)) %>% mutate(dailyMeanDea = (total_dea/365))
options(scipen=100)
View(acc_final)
(4) 확인하기
- head() 사용: 상위 5개만, 정렬 기준 국가명 기준 오름차순
| Country_Region | total_con | total_dea | dailyMeanCon | dailyMeanDea | |
|---|---|---|---|---|---|
| 1 | Afghanistan | 38,595 | 1,040 | 106 | 3 |
| 2 | Albania | 179,016 | 1,088 | 490 | 3 |
| 3 | Algeria | 96062 | 2622 | 263 | 7 |
| 4 | Andorra | 30,830 | 25 | 84 | 0 |
| 5 | Angola | 59,524 | 901 | 163 | 2 |
3. 일별 데이터 기준
1) 경로 확인 및 데이터 호출
# 경로 확인 및 설정: 2108~2207 기간 내 모든 파일 ---------
getwd()
setwd("C:/Rwork/2108~2207")

# 01-01-2022 ~ 07-31-2022
temp2022 <-  list.files (pattern = '*2022.csv')

# 08-01-2021 ~ 12-31-2021
temp2021 <-  list.files (pattern = '*2021.csv')

# 08-01-2021 ~ 07-31-2022
temp <- c(temp2021, temp2022)

# 경로 확인 및 설정: 07-31-2021 ------------------------
getwd()
setwd("C:/Rwork/csse_covid_19_daily_reports")

# 07-31-2021
temp2 <- read.csv('07-31-2021.csv')
2) 국가별 확진자 및 사망자
(1) 대상 기간 시작 날짜 하루 전 날의 데이터 정제
: 일별 데이터를 추출 하고자 하는 날의 전 날 데이터를 정제
# 07-31-2021 파일에서 필요한 컬럼만 그룹화
daily_basic <- temp2 %>% group_by(Country_Region) %>% summarise(sum_confirmed = sum(Confirmed), sum_deaths = sum(Deaths))
(2) 반복문
: 2)-(1)의 정제과정을 365번 반복하기 위함
# 반복문에서 사용될 변수 (지역명 컬럼만 있음)
daily_basic_temp1 <- daily_basic[ ,-c(2,3)]
daily_basic_temp2 <- daily_basic[ ,-c(2,3)]

# '기준일의 일일수치 == (기준일 - 전일)' 확인을 위한 반복문
for(i in 1:365){
  sample <- read.csv(temp[i])
  sample2 <- sample %>% group_by(Country_Region) %>% summarise(sum_confirmed = sum(Confirmed), sum_deaths = sum(Deaths))
  hab <- merge(sample2, daily_basic, by="Country_Region", all=T)
  hab$daily <- hab$sum_confirmed.x-hab$sum_confirmed.y
  hab$daily2 <- hab$sum_deaths.x-hab$sum_deaths.y
  daily_basic_temp1 <- merge(daily_basic_temp1, hab[c(1,6)], by='Country_Region', all=T)
  daily_basic_temp2 <- merge(daily_basic_temp2, hab[c(1,7)], by='Country_Region', all=T)
  daily_basic <- sample2
}

# 최종변수 <- 지역명 컬럼
daily_basic_final <- daily_basic[ , -c(2, 3)]

# 변수 <- rowSums(지역명 컬럼 제외한 일일 수치) %>% data.frame 으로 만들기
a <- rowSums(daily_basic_temp1[ , -1]) %>% as.data.frame()
b <- rowSums(daily_basic_temp2[ , -1]) %>% as.data.frame()

# 새 컬럼 <- 지역별 총합
daily_basic_final$total_con2 <- a[ ,1]
daily_basic_final$total_dea2 <- b[ ,1]
(3) 누적 기준 데이터와 일별 기준 데이터 비교
# 새 컬럼 <- 1.1의 값과 1.2의 값 비교(차이)
daily_basic_final$compare_con <- daily_basic_final$total_con2 - acc_final$total_con
daily_basic_final$compare_dea <- daily_basic_final$total_dea2 - acc_final$total_dea
(4) 비교 결과
- head() 사용: 상위 5개만, 정렬 기준 국가명 기준 오름차순
| Country_Region | compare_con | compare_dea | |
|---|---|---|---|
| 1 | Afghanistan | 0 | 0 |
| 2 | Albania | 0 | 0 |
| 3 | Algeria | 0 | 0 |
| 4 | Andorra | 0 | 0 |
| 5 | Angola | 0 | 0 |
>> 두 값의 차이가 0으로 다른 방법으로 산출했지만 결과가 같은 것이 확인된다. 즉, 데이터의 이상이 없음을 알 수 있다.
4. 데이터 값 확인
# NA 없음
acc_final %>% subset(is.na(total_con) | is.na(total_dea)) %>% select(Country_Region)
	=console=> "<0 행> <또는 row.names의 길이가 0입니다>"

# 두 값 중 하나라도 0일 경우
acc_final %>% filter(total_con == 0 | total_dea == 0) %>% select(Country_Region)
	 =console=> 7개

# 두 값 모두 0인 경우
acc_final %>% filter(total_con == 0 & total_dea == 0) %>% select(Country_Region)
	 =console=> 2개

# NA 제외한 모든 국가 리스트
acc_final %>% filter(total_con >= 0 | total_dea >= 0) %>% select(Country_Region)
	 =console=> 199개

# 199개 중 5개만 확인
head(acc_final %>% filter(total_con >= 0 | total_dea >= 0) %>% select(Country_Region))
Country_Region 1 Afghanistan 2 Albania 3 Algeria 4 Andorra 5 Angola
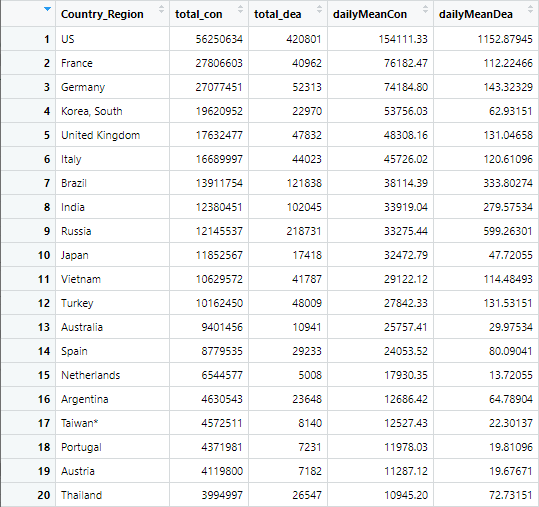
5. 정렬
: 최종적으로 산출된 데이터를 각 기준별로 내림차 순 정렬 (1~20행 만)
1) 총 확진자 기준
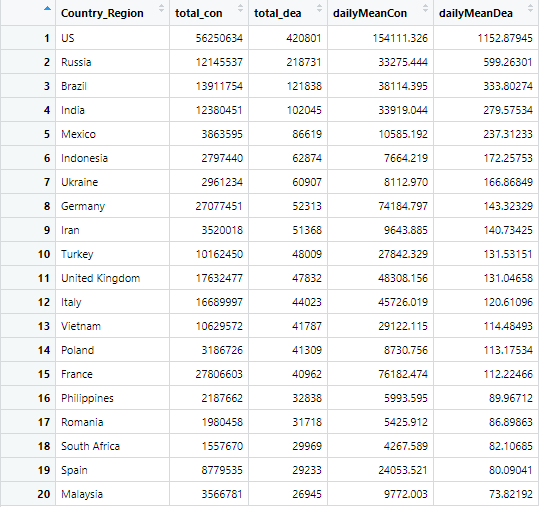
2) 총 사망자 기준
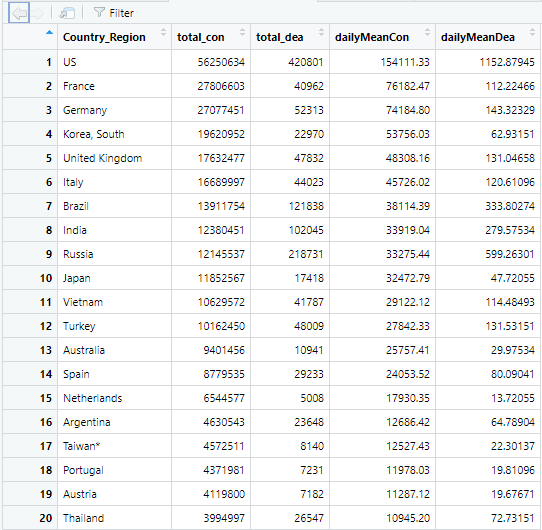
3) 일평균 확진자 기준
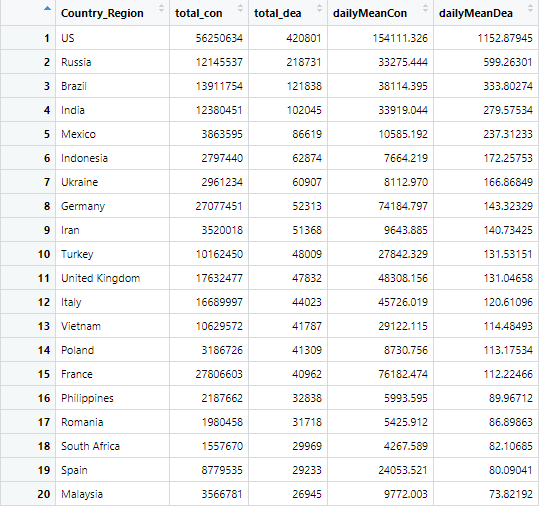
4) 일평균 사망자 기준

귀여운게 좋아