개요
1. 불균형 데이터 처리란?
1) 불균형 데이터 개념
- 분류문제에서 타겟데이터의 범주가 한쪽으로 치우친 데이터를 의미
- 일반적으로 정상 데이터에 비해 이상 데이터가 매우 적은 경우를 의미
ex) 건강한 사람에 비해 특정 질병에 걸린 사람이 매우 적은 경우
ex) 신용카드 거래에서 정상 거래에 비해 사기 거래가 매우 적은 경우
-> fraud detection..
2) 불균형 데이터가 유발할 수 있는 문제점
- 모델의 성능을 왜곡
-> 정확도는 높으나, 실제로 이상이 있는 데이터는 검출 못함 - 이상 데이터가 적기 때문에, 이상 데이터에 과적합될 가능성이 높음
3) 불균형 데이터 해결방안 -> 불균형 데이터 처리!!!
- class수가 적은쪽의 데이터(minority class)를 추가수집
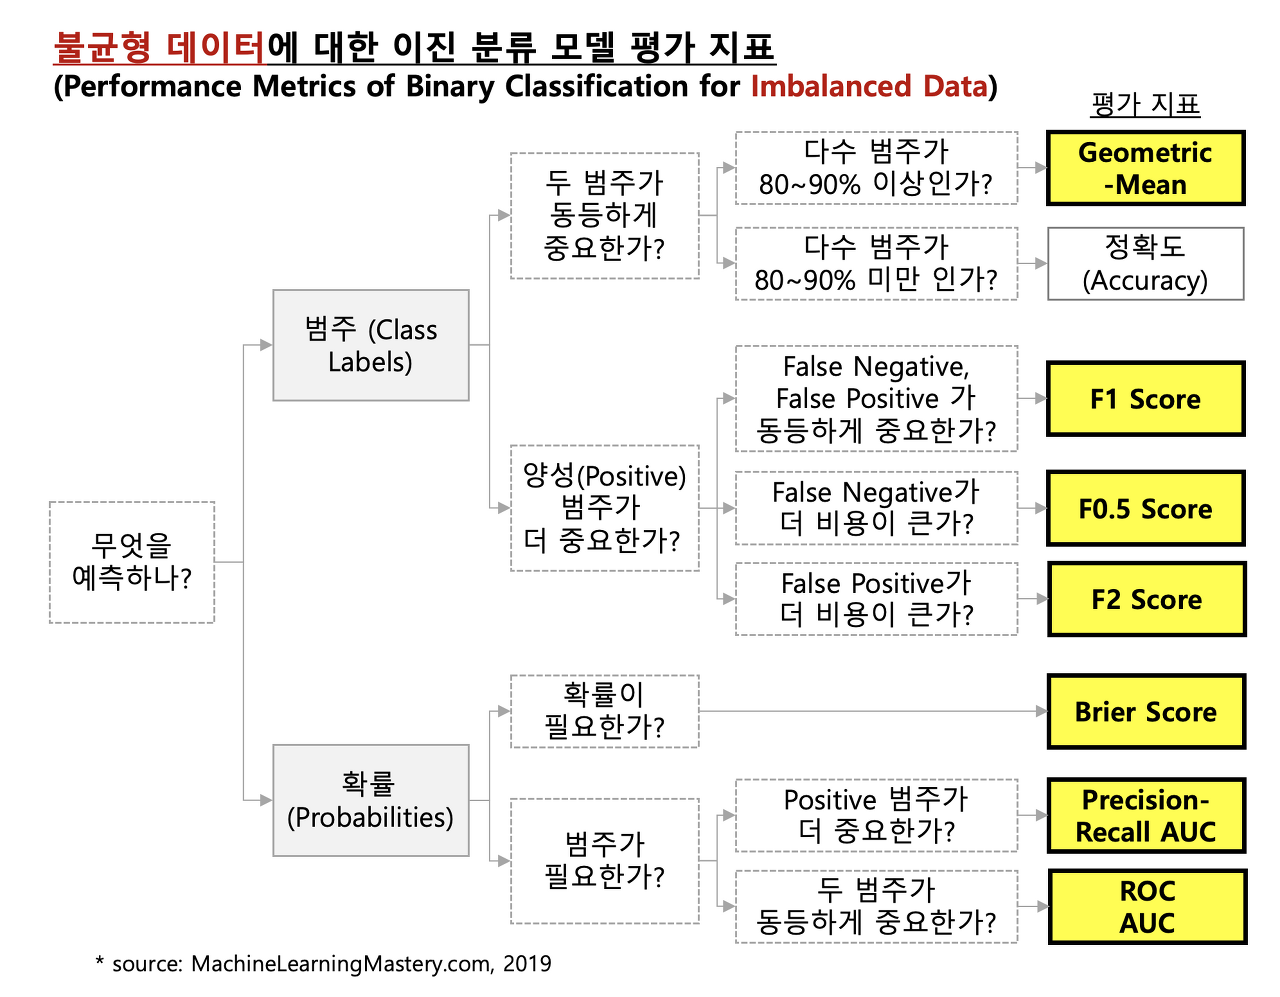
-> 비용과 시간이 많이 들기에 현실적으로 어려움 - 모델의 성능 평가 지표를 변경(정확성을 대체할 새로운 평가지표)
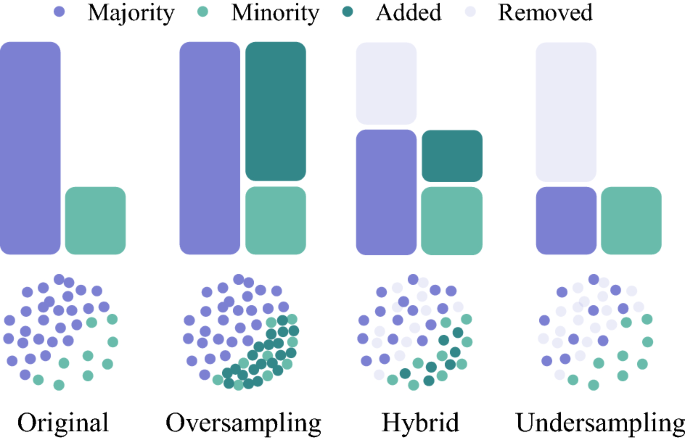
- 샘플링(Sampling) 기법사용(양적 균형 맞추는 방법) - !!중요!!
-> 데이터의 종류(class)별 데이터 개수(instance)를 인위적으로 맞춤
-> 데이터 소실이 매우 크고, 중요한 정상 데이터를 잃을 수 있음 - undersampling 기법
-> majority class의 데이터를 일부만 사용하여 minority class
의 데이터와 양적 균형을 맞추는 방법
-> 데이터 소실이 매우 크고, 중요한 정상 데이터를 잃을 수 있음
-> ex) Random Sampling, Tomek Links - oversampling 기법
-> minority class의 데이터를 복제 또는 유사 데이터를 생성하여
minority class의 데이터수를 증가시키는 방법
-> 정보가 손실되지 않는다는 장점이 있으나 과적합을 초래할 수 있음
-> ex) random over-sampling(데이터 복제)
SMOTE / ADASYN / Borderline-SMOTE (유사 데이터 생성) - UnderSampling + OverSampling(혼합기법)
-> majority class의 데이터는 일부만 사용하고 minority class의
데이터는 복제 또는 유사 데이터를 생성하여 균형을 맞춤
-> ex) SMOTE + Tomek Links
불균형 데이터 처리(샘플링)
1. UnderSampling
1) UnderSampling 방법(종류)소개
-
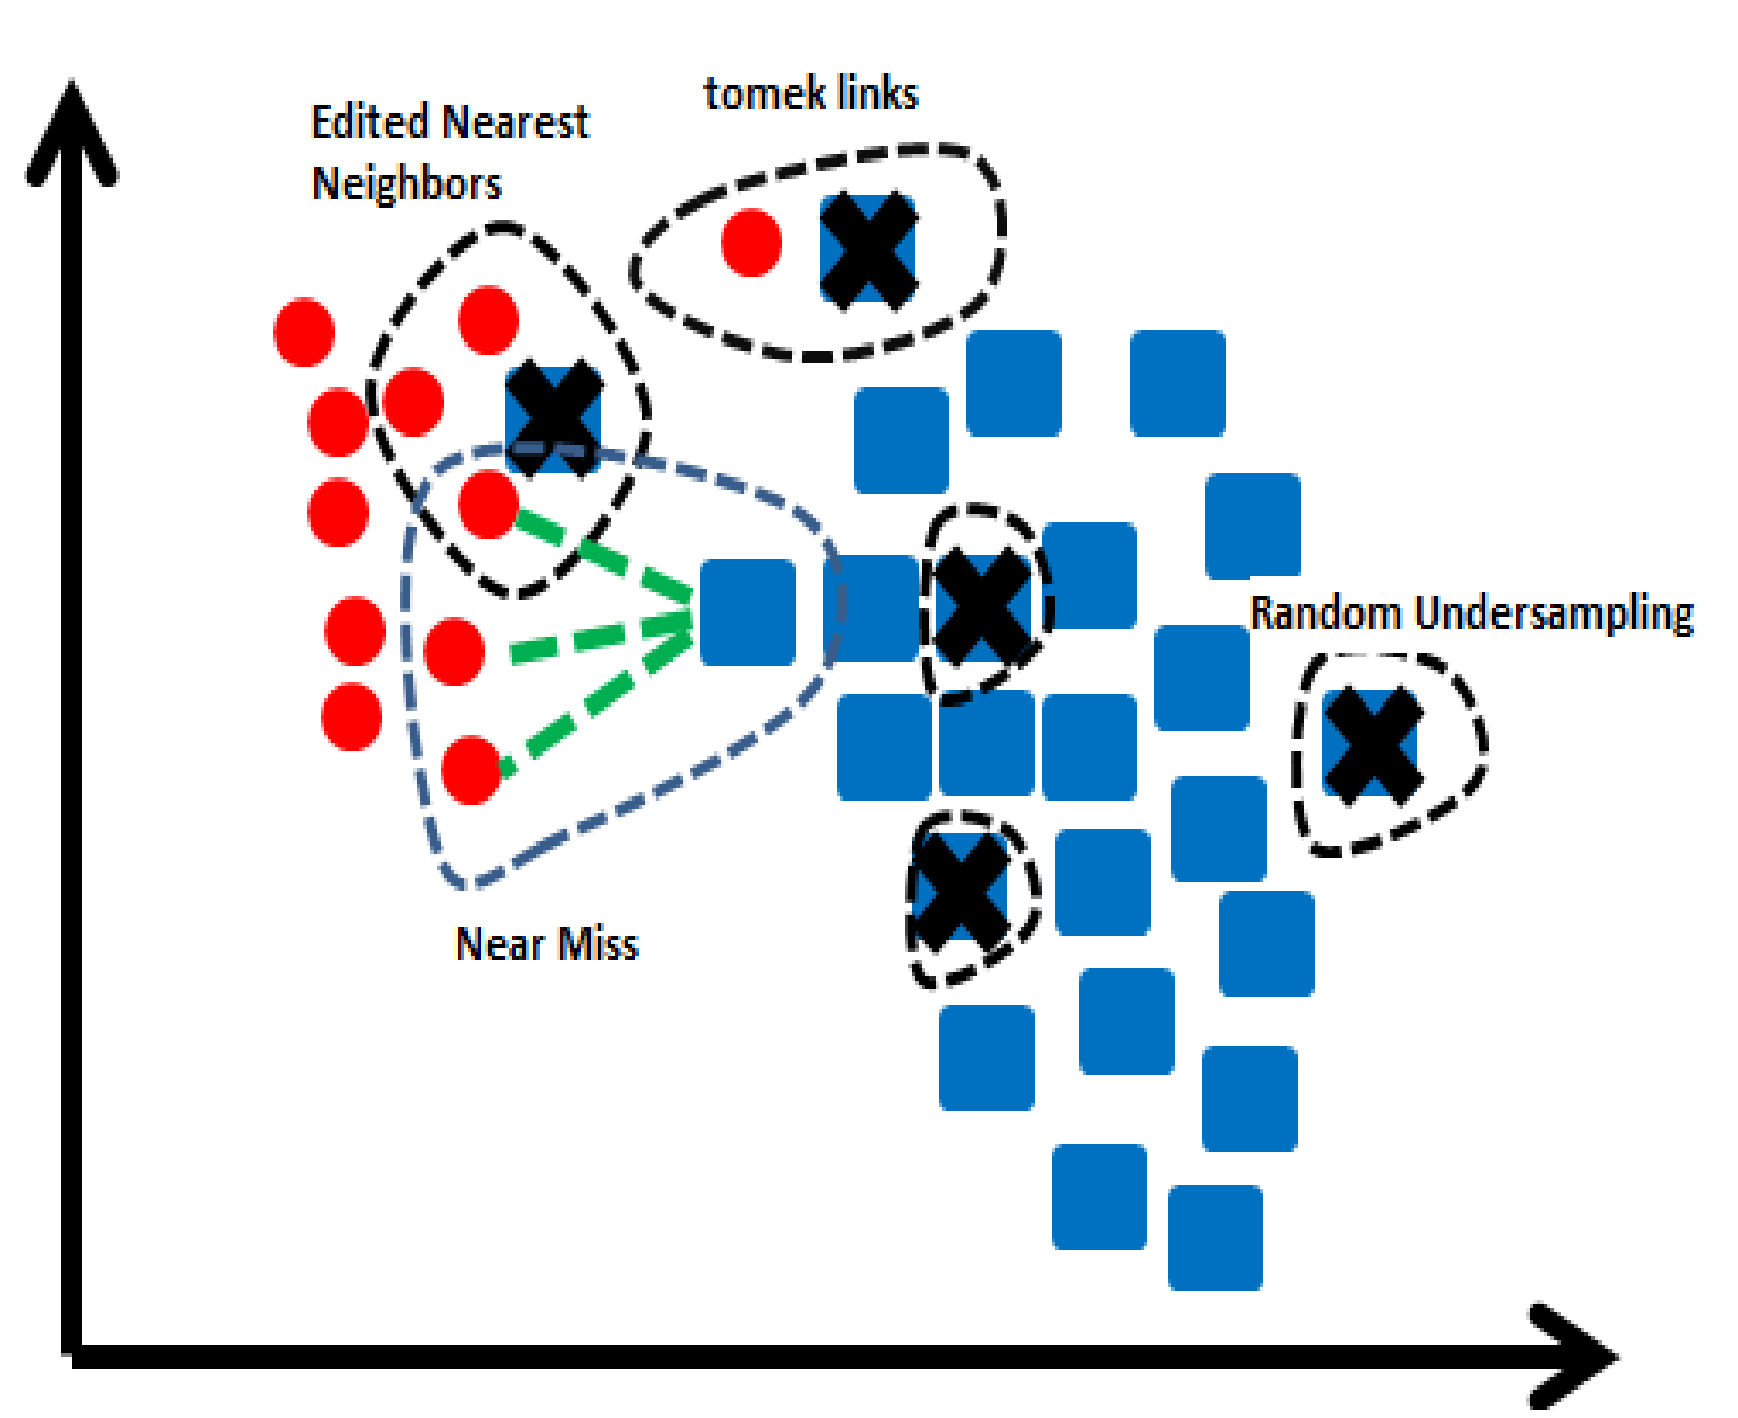
Random UnderSampling
-> 무작위로 majority class의 데이터를 제거하여 균형을 맞춤 -
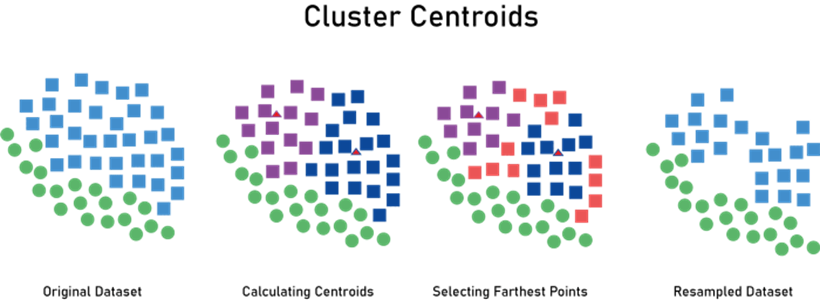
Cluster Centroids
-> majority class에서 중요하지 않은 데이터를 제거하는 것 -
K-Means 알고리즘을 사용하여 군집화 -> 군집의 중심점 발견 ->
중심점과 가장 가까운 데이터만 보존
-
Edited Nearest Neighbours
-> majority class 데이터 중 가장 가까운 k개의 인스턴스가 모두 또는
다수가 majority class 데이터가 아니면 삭제시킴
-> 즉, minority class 주변의 majority class 데이터가 삭제됨
-> minority class 데이터의 분류 정확도를 높이는 것에 의미가 있음
-
Condensed Nearest Neighbour
-> 1-Nearest Neighbour 알고리즘을 사용하여 이 모형으로 분류되지
않는 데이터만 보존
-> majority class에 밀집된 데이터가 없을 때까지 데이터를 제거하여
대표적인 인스턴스만 남도록 하는 방법 -
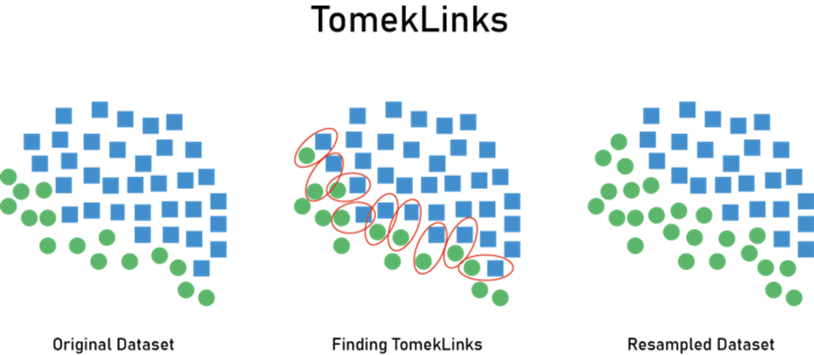
Tomek Links
-> 경계선에 있는 데이터를 찾고, 그 중에서 majority class에 속하는
데이터를 제거
-
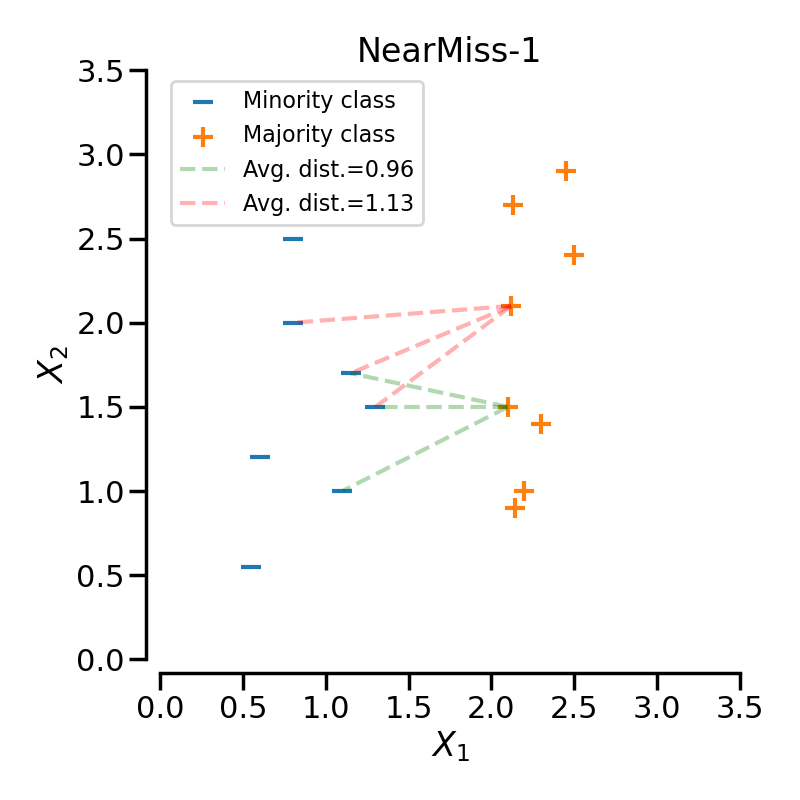
NearMiss-1
-> minority class의 가장 가까운 세개의 데이터까지의 평균 거리가
가장 작은 majority class의 데이터를 보존
-
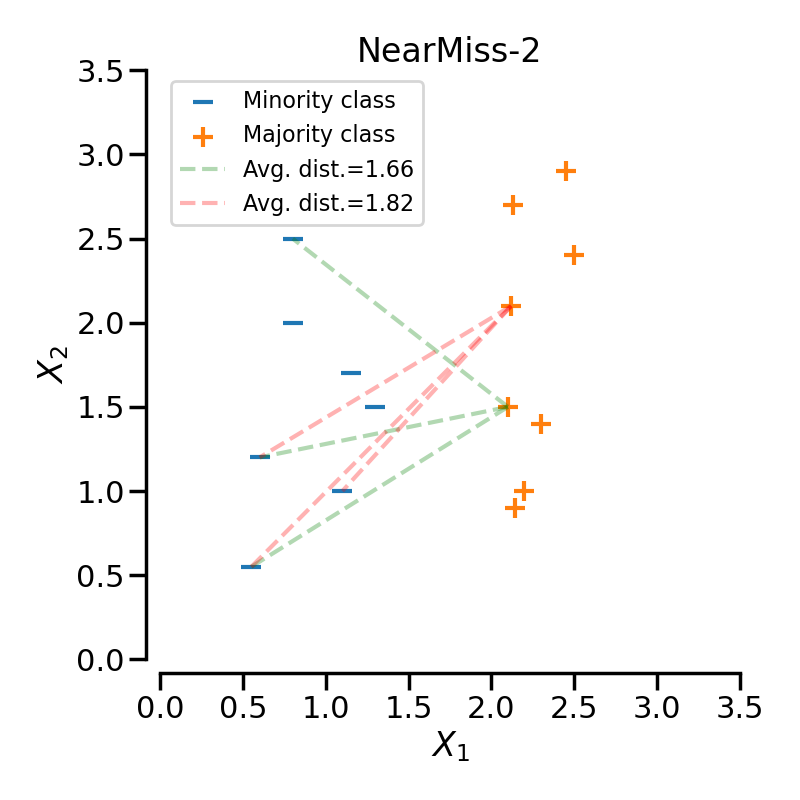
NearMiss-2
-> minority class의 가장 먼 세개의 데이터까지의 평균 거리가 가장
작은 majority class의 데이터를 보존
-
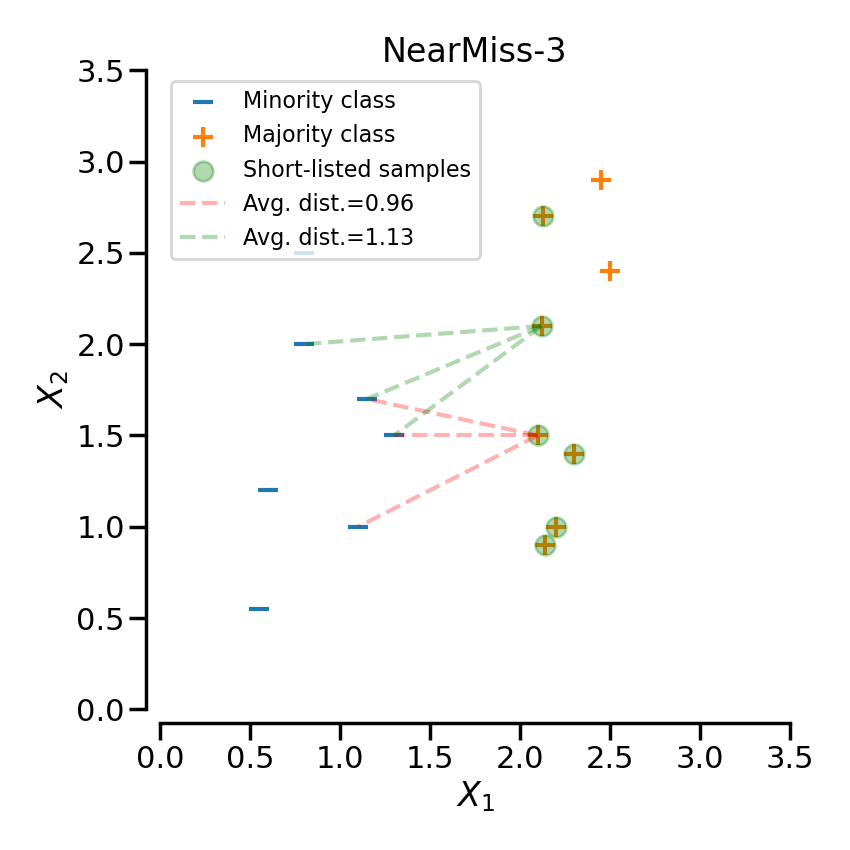
NearMiss-3
-> minority class의 각 샘플에 대해 평균 거리가 가장 작은
majority class의 데이터를 보존
2) 코드
- 위에서 소개한 undersampling 방식을 구현하는 코드 실행
# imbalanced-learn 설치
pip install -U imbalanced-learn

# 필요한 라이브러리(클래스 / 함수) 가져오기
import numpy as np
from sklearn.linear_model import LogisticRegression
from imblearn.under_sampling import RandomUnderSampler, TomekLinks, EditedNearestNeighbours
from imblearn.under_sampling import CondensedNearestNeighbour, NearMiss, ClusterCentroids

# 시드 설정
np.random.seed(0)

# 데이터 생성
X, y = create_dataset(n_samples=200, weights=(0.05, 0.25, 0.7))

# 샘플러 설정
samplers = [RandomUnderSampler(),
            TomekLinks(),
            EditedNearestNeighbours(),
            CondensedNearestNeighbour(n_neighbors=3),
            NearMiss(version=1, n_neighbors=3),
            NearMiss(version=2, n_neighbors=3),
            NearMiss(version=3, n_neighbors=3),
            ClusterCentroids()
            ]

# 그래프 설정
fig, axs = plt.subplots(nrows=3, ncols=3, figsize=(10, 10))

# 분류기 생성
clf = LogisticRegression()

# 결과확인
clf.fit(X, y)
plot_decision_results(X, y, clf, axs[0,0], title="Without resampling")

for i, sampler in enumerate(samplers):
    X_resampled, y_resampled = sampler.fit_resample(X, y)
    clf.fit(X_resampled, y_resampled)
    plot_decision_results(X_resampled, y_resampled, clf, axs[(i+1)//3,(i+1)%3], f"Using {sampler.__class__.__name__}")
    fig.suptitle(f"Decision function of {clf.__class__.__name__}")

fig.tight_layout()
2. OverSampling
1) OverSampling 방법(종류)소개
- Random OverSampling
-> 무작위로 minority class 데이터를 복제하여 균형을 맞춤
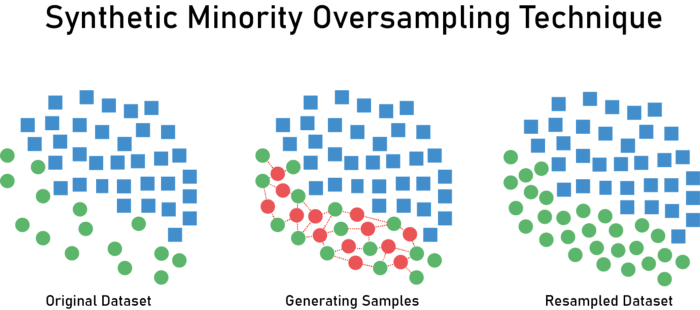
-> 데이터가 동일하게 복제되기 때문에 과적합 문제가 발생할 수 있음 - SMOTE(Synthetic Minority Over-sampling Technique)
-> 각 minority class 데이터의 K-nearist를 찾고, 그 중 하나를 무작위로 선택한 다음
선형 보간법을 활용하여 이웃에 새로운 minority class 데이터를 생성
-> 모델의 과적합을 방지하는 데 유용
2) 코드
- Random OverSampling 방식을 구현하는 코드 작성
# 필요한 패키지(클래스 / 함수) 가져오기
from imblearn.over_sampling import RandomOverSampler
from sklearn.datasets import make_classification
from sklearn.model_selection import train_test_split
from sklearn.ensemble import RandomForestClassifier
from sklearn.metrics import accuracy_score

# 샘플 데이터 생성 (실제 사용 시에는 데이터를 가져와야 함)
X, y = make_classification(n_samples=1000, n_features=20, n_informative=2,
                           n_redundant=10, n_clusters_per_class=1, weights=[0.99], flip_y=0, random_state=1)

# 데이터 분할
X_train, X_test, y_train, y_test = train_test_split(X, y, test_size=0.2, random_state=42)

# RandomOverSampler를 사용하여 오버샘플링
ros = RandomOverSampler(random_state=42)
X_resampled, y_resampled = ros.fit_resample(X_train, y_train)

# 오버샘플링된 데이터로 모델 학습
model = RandomForestClassifier(random_state=42)
model.fit(X_resampled, y_resampled)

# 테스트 데이터로 정확도 평가
y_pred = model.predict(X_test)
accuracy = accuracy_score(y_test, y_pred)
print(f'Accuracy: {accuracy}')
- SMOTE(Synthetic Minority Over-sampling Technique) 방식을 구현하는 코드 작성
# 필요한 라이브러리(클래스 / 함수) 가져오기
from imblearn.over_sampling import SMOTE
from sklearn.datasets import make_classification
from sklearn.model_selection import train_test_split
from sklearn.neighbors import KNeighborsClassifier
from sklearn.metrics import accuracy_score

# 샘플 데이터 생성 (실제 사용 시에는 데이터를 가져와야 함)
X, y = make_classification(n_samples=1000, n_features=20, n_informative=2,
                           n_redundant=10, n_clusters_per_class=1, weights=[0.99], flip_y=0, random_state=1)

# 데이터 분할
X_train, X_test, y_train, y_test = train_test_split(X, y, test_size=0.2, random_state=42)

# SMOTE를 사용하여 오버샘플링
smote = SMOTE(random_state=42)
X_resampled, y_resampled = smote.fit_resample(X_train, y_train)

# 오버샘플링된 데이터로 모델 학습
model = KNeighborsClassifier()
model.fit(X_resampled, y_resampled)

# 테스트 데이터로 정확도 평가
y_pred = model.predict(X_test)
accuracy = accuracy_score(y_test, y_pred)
print(f'Accuracy: {accuracy}')
3. OverSampling과 UnderSampling 혼합 처리
1) 혼합처리 방법 소개
- SMOTE + Tomek Links
-> SMOTE를 사용하여 minority class 데이터를 생성하고, 그 중에서 majority class에 속하는
데이터를 Tomek Links를 사용하여 제거함 - SMOTE + ENN
-> SMOTE를 사용하여 minority class의 데이터를 생성하고, 그 중에서 majority class에 속하는
데이터를 Edited Nearest Neighbours를 사용하여 제거함
2) 코드
- SMOTE + Tomek Links 기법 / SMOTE + ENN 기법 적용
# 필요 라이브러리(클래스 / 함수) 가져오기
import numpy as np
from sklearn.linear_model import LogisticRegression
from imblearn.over_sampling import RandomOverSampler, SMOTE, ADASYN, BorderlineSMOTE, SVMSMOTE, KMeansSMOTE
from imblearn.combine import SMOTETomek, SMOTEENN

# 시드 설정
np.random.seed(0)

# 데이터 생성
X, y = create_dataset(n_samples=200, weights=(0.05, 0.25, 0.7))

# 샘플러 설정
samplers = [RandomOverSampler(),
            SMOTE(),
            ADASYN(),
            BorderlineSMOTE(),
            SVMSMOTE(),
            KMeansSMOTE(),
            SMOTETomek(),
            SMOTEENN()
            ]

# 그래프 설정
fig, axs = plt.subplots(nrows=3, ncols=3, figsize=(10, 10))

# 분류기 생성
clf = LogisticRegression()

clf.fit(X, y)
plot_decision_results(X, y, clf, axs[0,0], title="Without resampling")

for i, sampler in enumerate(samplers):
    X_resampled, y_resampled = sampler.fit_resample(X, y)
    clf.fit(X_resampled, y_resampled)
    plot_decision_results(X_resampled, y_resampled, clf, axs[(i+1)//3,(i+1)%3], f"Using {sampler.__class__.__name__}")
    fig.suptitle(f"Decision function of {clf.__class__.__name__}")

fig.tight_layout(pad=1.5)
plt.show()