TBEG Advanced Features - Charts, Images, and Large-Scale Processing
🇰🇷 한국어 버전
This is Part 5 of the TBEG series. If you haven't read Part 4 (Spring Boot Integration) yet, I recommend starting there.
In the previous four parts, we covered what TBEG is, how to get started, the full template syntax, and how to integrate with Spring Boot. By now you should be comfortable creating Excel reports with variable substitution, repeat expansion, and DataProvider.
But real-world reports demand more. Your finance team wants charts that update automatically. Your marketing team needs logos and banners embedded in every export. Your ops team is exporting 100,000-row datasets and wondering why the server runs out of memory.
This post covers the features that handle all of that — and more.
Formula Integration
Excel formulas are one of the most powerful features of spreadsheets. TBEG doesn't try to reinvent them — instead, it lets you use formulas as-is in your templates and automatically adjusts their references when data expands.
Binding Variables in Excel Formulas
You can embed TBEG variables directly inside Excel formulas. This is useful when the formula's range depends on data.
Template
| A | B | |
|---|---|---|
| 1 | Start | ${startRow} |
| 2 | End | ${endRow} |
| 3 | Total | =SUM(B${startRow}:B${endRow}) |
Code
val data = mapOf("startRow" to 4, "endRow" to 6)

ExcelGenerator().use { generator ->
    val bytes = generator.generate(template, data)
    File("output.xlsx").writeBytes(bytes)
}Result: Cell B3 becomes =SUM(B4:B6) — a live Excel formula.
Hyperlinks
The same technique works with HYPERLINK:
Template cell
=HYPERLINK("${url}", "${text}")Code
val data = mapOf(
    "url" to "https://github.com/jogakdal/data-processors-with-excel",
    "text" to "View on GitHub"
)
The result is a clickable hyperlink in Excel — no POI hyperlink API needed.
Automatic Formula Range Adjustment
When a repeat region expands, TBEG automatically updates formulas that reference that region.
Template
| A | B | |
|---|---|---|
| 1 | ${repeat(items, A2:B2, item)} | |
| 2 | ${item.name} | ${item.value} |
| 3 | Total | =SUM(B2:B2) |
Result (3 items)
| A | B | |
|---|---|---|
| 2 | Item A | 100 |
| 3 | Item B | 200 |
| 4 | Item C | 300 |
| 5 | Total | =SUM(B2:B4) |
The formula =SUM(B2:B2) is expanded to =SUM(B2:B4) to cover all three rows. The same applies to AVERAGE, COUNT, and any other formula referencing the repeat range. Charts and pivot tables that reference the range are also updated automatically.
Image Insertion
Reports often need logos, stamps, charts, or dynamically generated images. TBEG supports inserting images from both local files and URLs.
Local Files
val provider = simpleDataProvider {
    value("company", "Acme Corp.")
    image("logo", File("logo.png").readBytes())
}
In your template, place ${image(logo)} in the cell where you want the image. The image scales to fit the cell (or merged region) by default.
You can also control the size explicitly:
${image(logo, B2, 200:150)}    // 200px wide, 150px tall
${image(logo, B2, original)}   // Original size
${image(logo, B2, fit)}        // Fit to cell (default)
URL Auto-Download
Don't have the image file locally? Just provide a URL:
val provider = simpleDataProvider {
    imageUrl("chart", "https://example.com/quarterly-chart.png")
}
The image is downloaded during generate() and embedded directly in the Excel file. The generated file works offline — no network access required when opening it.
Within a single generate() call, the same URL is downloaded only once. For caching across multiple calls, configure the TTL:
val config = TbegConfig(imageUrlCacheTtlSeconds = 300)  // Cache for 5 minutes
val generator = ExcelGenerator(config)
If a download fails (network error, 404, etc.), a warning is logged and the image is simply skipped. Excel generation continues normally.
Automatic Cell Merge
When generating grouped reports — sales by department, employees by team — you often want to merge consecutive cells with the same value. Doing this manually with POI is tedious and error-prone. TBEG handles it with a single marker.
How It Works
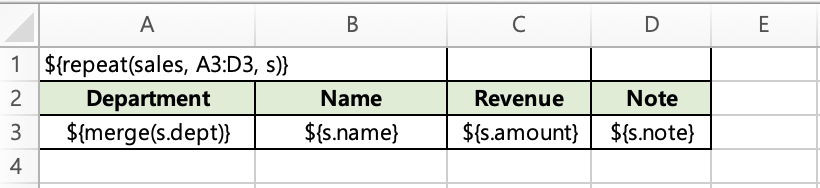
Place ${merge(emp.dept)} in the template cell instead of ${emp.dept}. During repeat expansion, consecutive rows with the same value are automatically merged.
Template
Code
val data = mapOf(
    "employees" to listOf(
        mapOf("dept" to "Sales",       "name" to "Yongho Hwang", "rank" to "Staff"),
        mapOf("dept" to "Sales",       "name" to "Minjun Park",  "rank" to "Manager"),
        mapOf("dept" to "Engineering", "name" to "Soyeon Kim",   "rank" to "Senior"),
    )
)
Result
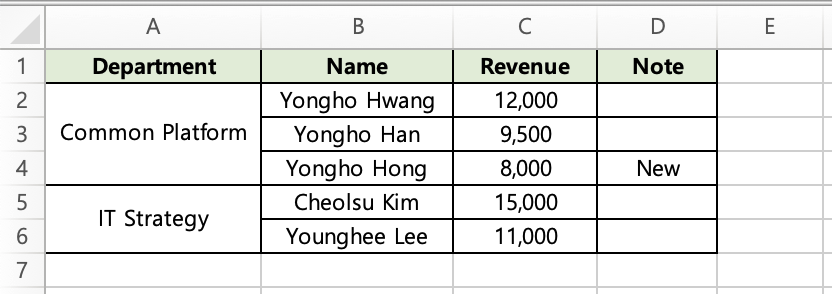
Rows 2–3 in column A are merged because they share the value "Sales".
Important: Data must be pre-sorted by the merge key. TBEG merges consecutive identical values — it does not scan the entire column for matches.
You can apply merge to multiple columns for multi-level grouping (e.g., department + team), and each column merges independently.
Bundle (Element Grouping)
When a sheet has two or more repeat regions and certain elements are affected by multiple repeat expansions independently, the intended template layout can break apart.
In such cases, wrapping the elements that should stay intact with a bundle marker causes the entire bundled region to move as if it were a single cell, preserving the layout.
Example
Template (bundle_template.xlsx)
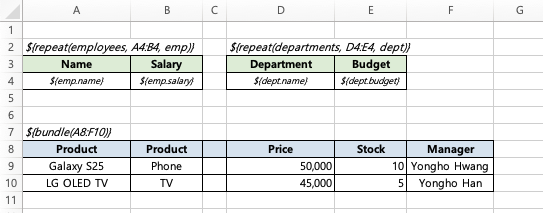
Code
  data class Employee(val name: String, val salary: Int)
  data class Department(val name: String, val budget: Int)

  fun main() {
      val data = mapOf(
          "employees" to listOf(
              Employee("Yongho Hwang", 8000),
              Employee("Yongho Han", 6500),
              Employee("Yongho Hong", 4500),
              Employee("Cheolsu Kim", 5500),
              Employee("Younghee Lee", 7000),
          ),
          "departments" to listOf(
              Department("Common Platform", 50000),
              Department("IT Strategy", 30000),
          )
      )

      ExcelGenerator().use { generator ->
          val template = javaClass.getResourceAsStream("/templates/bundle_template.xlsx")
              ?: throw IllegalStateException("Template not found")

          val bytes = generator.generate(template, data)
          File("bundle_output.xlsx").writeBytes(bytes)
      }
  }
With bundle vs Without bundle
Without bundle: Columns A-B are pushed down 4 rows by the employees expansion, columns D-E are pushed down 1 row by the departments expansion, and columns C and F stay at their original template position (row 8) since nothing pushes them. In other words, the carefully designed table layout breaks apart:
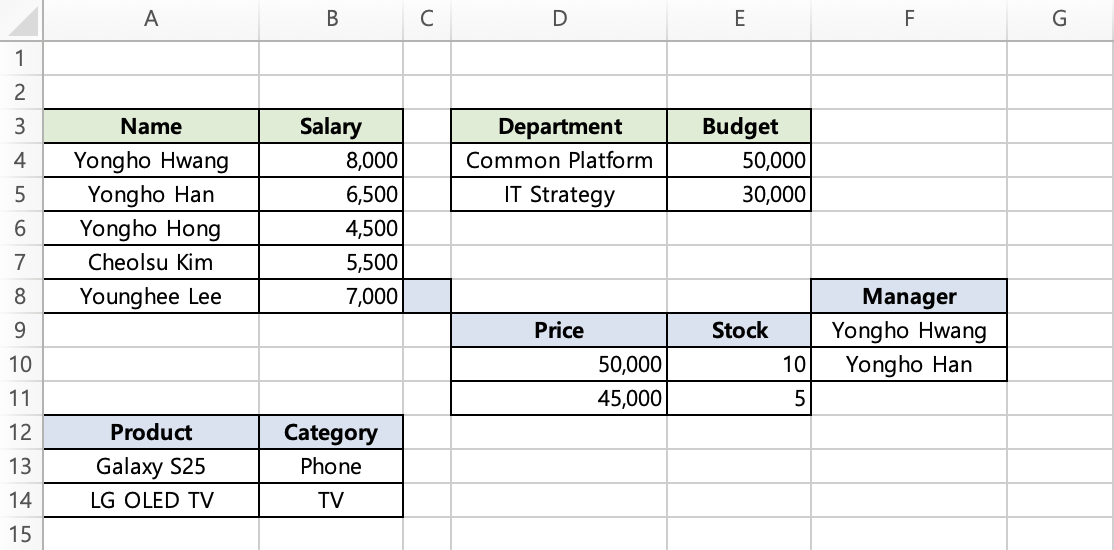
With bundle: The bundled region moves together as if it were a single cell, shifting by the maximum expansion amount, so the table layout stays intact.
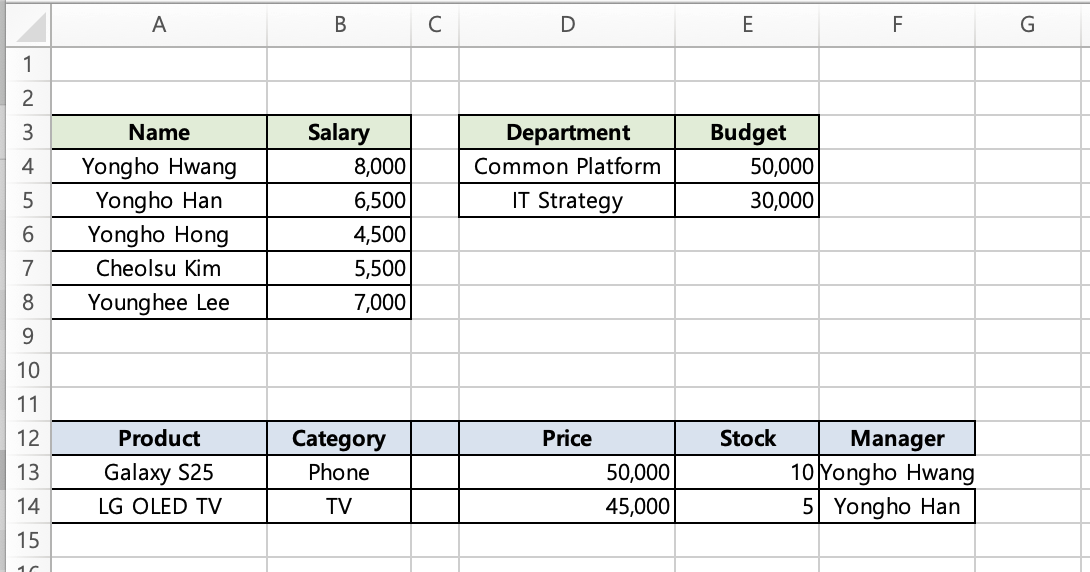
With bundle applied, the entire specified range moves together as if it were a single cell.
📌 A bundle range must not partially overlap with other range-based elements (merged cells, repeat markers, other bundle markers, etc.). The entire range of any such element must be fully contained within the bundle.
Selective Field Visibility (hideable)
Sometimes you need two versions of the same report — a full version with salary data for HR, and a condensed version without it for general distribution. Instead of maintaining two templates, use hideable.
How It Works
Replace the field marker with a hideable marker:
${hideable(value=emp.salary)}Then specify which fields to hide in code:
val provider = simpleDataProvider {
    items("employees", employeeList)
    hideFields("employees", "salary")  // Hide the salary field
}
When hideFields is specified, the salary column is removed and remaining columns shift left. When it's not specified, the hideable marker behaves like a normal field — salary values render normally.
One template, two reports.
DELETE vs DIM Mode
| Mode | Behavior | Best for |
|---|---|---|
DELETE | Physically removes the column, shifts remaining elements (default) | Completely removing sensitive data |
DIM | Applies gray background + light text, clears data values | Preserving layout while indicating restricted data |
${hideable(emp.salary, C2:C4)}           // DELETE mode (default)
${hideable(emp.salary, C2:C4, dim)}      // DIM mode
Bundle Range for Header+Data Hiding
By default, hideable only hides the cell where the marker is placed. Use the bundle parameter to hide the header and totals row together:
Template
| A | B | C | D | |
|---|---|---|---|---|
| 1 | ${repeat(employees, A3:D3, emp)} | |||
| 2 | Name | Position | Salary | Department |
| 3 | ${emp.name} | ${emp.position} | ${hideable(emp.salary, C2:C4)} | ${emp.dept} |
| 4 | Total | =SUM(C3:C3) |
The bundle range C2:C4 includes the field title (C2), data (C3), and total (C4). When salary is hidden, the entire column — header, data, and total — is removed together.
Code
val provider = simpleDataProvider {
    items("employees", employeeList)
    hideFields("employees", "salary")
}
Multi-Sheet
TBEG processes all sheets in a workbook. The same data automatically binds to markers across every sheet — no extra configuration needed.
This makes the Summary + Detail pattern straightforward:
Summary sheet
| A | B | |
|---|---|---|
| 1 | Title | ${title} |
| 2 | Total Employees | ${size(employees)} |
Detail sheet
| A | B | C | |
|---|---|---|---|
| 1 | ${repeat(employees, A3:C3, emp)} | ||
| 2 | Name | Position | Salary |
| 3 | ${emp.name} | ${emp.position} | ${emp.salary} |
Code
val data = mapOf(
    "title" to "Employee Status",
    "employees" to listOf(
        Employee("Yongho Hwang", "Director", 8000),
        Employee("Minjun Park", "Manager", 6500),
        Employee("Soyeon Kim", "Assistant Manager", 4500)
    )
)

ExcelGenerator().use { generator ->
    val bytes = generator.generate(template, data)
    File("multi_sheet_report.xlsx").writeBytes(bytes)
}
The summary sheet shows 3 for ${size(employees)}, while the detail sheet expands all three rows. One data map, all sheets handled.
Asynchronous Processing
For large reports that take seconds to generate, you don't want to block the request thread. TBEG offers three async approaches.
Kotlin Coroutines
ExcelGenerator().use { generator ->
    val path = generator.generateToFileAsync(
        template = template,
        dataProvider = provider,
        outputDir = Path.of("./output"),
        baseFileName = "async_report"
    )
    println("File created: $path")
}
Java CompletableFuture
try (ExcelGenerator generator = new ExcelGenerator();
     InputStream template = new FileInputStream("template.xlsx")) {

    CompletableFuture<Path> future = generator.generateToFileFuture(
        template,
        Map.of("title", "Async Report"),
        Path.of("./output"),
        "async_report"
    );

    future.thenAccept(path -> System.out.println("File created: " + path));
    Path result = future.get();
}
Background Job + Listener
This is the pattern for API servers that need to respond immediately:
val job = generator.submitToFile(
    template = template,
    dataProvider = provider,
    outputDir = Path.of("./output"),
    baseFileName = "background_report",
    listener = object : ExcelGenerationListener {
        override fun onStarted(jobId: String) {
            println("[Started] Job ID: $jobId")
        }

        override fun onCompleted(jobId: String, result: GenerationResult) {
            println("[Completed] File: ${result.filePath}")
            println("[Completed] Rows: ${result.rowsProcessed}")
        }

        override fun onFailed(jobId: String, error: Exception) {
            println("[Failed] ${error.message}")
        }
    }
)

// Respond immediately — don't wait
return ResponseEntity.accepted().body(mapOf("jobId" to job.jobId))
The client gets an HTTP 202 response with the job ID. You can implement a polling endpoint or use WebSocket/SSE to notify when the file is ready.
Large-Scale Data Processing
This is where TBEG really shines. Processing 100,000 rows without running out of memory is table stakes for enterprise reporting.
Streaming Mode
TBEG uses Apache POI's SXSSF (Streaming Usermodel API) under the hood, maintaining a 100-row buffer that writes sequentially to disk. This means memory usage stays constant regardless of data size.
The key to optimal performance is combining count with a lazy iterator through DataProvider:
val provider = simpleDataProvider {
    value("title", "All Employee Status")

    // Provide count + lazy iterator for optimal performance
    items("employees", employeeRepository.count().toInt()) {
        employeeRepository.streamAll().iterator()
    }
}
Why provide the count? Without it, TBEG has to traverse the data once just to count it before processing. With the count, it skips straight to rendering.
Performance Benchmark
Test environment: Java 21, macOS, 3 columns repeat + SUM formula
| Data Size | Time |
|---|---|
| 1,000 rows | 146ms |
| 10,000 rows | 519ms |
| 30,000 rows | 1.1s |
| 50,000 rows | 1.3s |
| 100,000 rows | 2.6s |
100,000 rows in under 3 seconds. The streaming approach makes the growth near-linear.
Comparison with Other Libraries (30,000 rows)
| Library | Time |
|---|---|
| TBEG | 1.1s |
| JXLS | 5.2s |
TBEG is roughly 5x faster than JXLS for the same workload. TBEG calls the POI API directly and writes in a single pass with streaming, whereas JXLS goes through an abstraction layer performing multiple passes of template parsing, transformation, and writing.
Source: JXLS benchmark discussion
Comprehensive Example: Quarterly Sales Report
Let's tie everything together with a real-world example that uses nearly every feature covered in this series.
Template

This template includes:
- Variable markers: report title, period, author, date
- Image markers: company logo, CI
- Three repeat regions: department performance, product categories, employee details
- Auto-merge markers: department and team columns in the employee table
- Bundle marker: protects the employee table from department repeat expansion
- Formulas: SUM, AVERAGE for totals, inter-cell calculations for profit and achievement rate
- Conditional formatting: green/red highlights based on achievement thresholds
- Charts: bar chart for department performance, pie chart for product categories
Code
import io.github.jogakdal.tbeg.ExcelGenerator
import io.github.jogakdal.tbeg.simpleDataProvider
import java.io.File
import java.nio.file.Path
import java.time.LocalDate

data class DeptResult(val deptName: String, val revenue: Long, val cost: Long, val target: Long)
data class ProductCategory(val category: String, val revenue: Long)
data class Employee(
    val dept: String, val team: String, val name: String, val rank: String,
    val revenue: Long, val cost: Long, val target: Long
)

fun main() {
    val data = simpleDataProvider {
        value("reportTitle", "Q1 2026 Sales Performance Report")
        value("period", "Jan 2026 ~ Mar 2026")
        value("author", "Yongho Hwang")
        value("reportDate", LocalDate.now().toString())
        value("subtitle_emp", "Employee Performance Details")
        image("logo", File("company_logo.png").readBytes())
        image("ci", File("company_ci.png").readBytes())

        items("depts") {
            listOf(
                DeptResult("Common Platform", 52000, 31000, 50000),
                DeptResult("IT Strategy",     38000, 22000, 40000),
                DeptResult("HR Management",   28000, 19000, 30000),
                DeptResult("Education Biz",   95000, 61000, 90000),
                DeptResult("Content Dev",     42000, 28000, 45000),
            ).iterator()
        }

        items("products") {
            listOf(
                ProductCategory("Online Courses", 128000),
                ProductCategory("Consulting", 67000),
                ProductCategory("Certification", 45000),
                ProductCategory("Contents License", 15000),
            ).iterator()
        }

        items("employees") {
            listOf(
                Employee("Common Platform", "Strategy", "Yongho Hwang", "Manager", 18000, 11000, 17000),
                Employee("Common Platform", "Strategy", "Sungjun Park", "Senior", 15000, 9000, 14000),
                Employee("Common Platform", "Backend", "Changmin Choi", "Senior", 12000, 7000, 13000),
                Employee("Common Platform", "Backend", "Hyunkyung Kim", "Junior", 7000, 4000, 6000),
                Employee("IT Strategy", "Planning", "Jaemyung Byun", "Manager", 20000, 12000, 20000),
                Employee("IT Strategy", "Planning", "Minchul Kim", "Senior", 11000, 6000, 12000),
                Employee("IT Strategy", "Analysis", "Minhee Kim", "Senior", 7000, 4000, 8000),
                Employee("Education Biz", "Sales", "Seojin Yoon", "Manager", 35000, 22000, 30000),
                Employee("Education Biz", "Sales", "Minwoo Kang", "Senior", 28000, 18000, 25000),
                Employee("Education Biz", "Sales", "Soyeon Lim", "Junior", 15000, 10000, 15000),
                Employee("Education Biz", "Support", "Junhyeok Oh", "Senior", 17000, 11000, 20000),
            ).iterator()
        }
    }

    ExcelGenerator().use { generator ->
        val template = File("rich_sample_template.xlsx").inputStream()
        generator.generateToFile(template, data, Path.of("output"), "quarterly_report")
    }
}
Result

Everything TBEG handled automatically:
- Variable substitution — title, period, author, date, section subtitle
- Image insertion — logo, CI
- Repeat expansion — departments (5 rows), products (4 rows), employees (11 rows)
- Automatic cell merge — consecutive department/team names merged
- Bundle — employee table protected from department expansion
- Formula range adjustment —
SUM(C8:C8)→SUM(C8:C12), etc. - Conditional formatting replication — color rules applied to all expanded rows
- Chart data range reflection — charts reference the expanded data
All from a single template and a single generate() call.
Wrap-Up
Here's a summary of the advanced features covered in this post:
| Feature | What It Does | Key Syntax / API |
|---|---|---|
| Formula integration | Bind variables inside Excel formulas | =SUM(B\${startRow}:B\${endRow}) |
| Image insertion | Embed images from files or URLs | image(), imageUrl() |
| Automatic cell merge | Merge consecutive identical values | \${merge(item.field)} |
| Bundle | Group elements to move as a unit | \${bundle(range)} |
| Selective field visibility | Hide/show fields conditionally | \${hideable(value=item.field)} + hideFields() |
| Multi-sheet | Same data binds across all sheets | Automatic — no extra config |
| Async processing | Coroutines, CompletableFuture, background jobs | generateToFileAsync(), submitToFile() |
| Streaming mode | Constant-memory large data processing | Built-in — always active |
In the next and final post, Part 6: Tips & Troubleshooting, we'll cover best practices for template design, common pitfalls, debugging techniques, and performance optimization tips.
Links
- GitHub: jogakdal/data-processors-with-excel
- Maven Central:
io.github.jogakdal:tbeg:1.2.3 - Documentation: