예제 코드 출처: https://wikidocs.net/92114
예제 코드
import matplotlib.pyplot as plt

ratio = [34, 32, 16, 18]
labels = ['Apple', 'Banana', 'Melon', 'Grapes']
explode = [0.05, 0.05, 0.05, 0.05]
colors = ['silver', 'gold', 'whitesmoke', 'lightgray']

plt.pie(ratio, labels=labels, autopct='%.1f%%', startangle=260, counterclock=False, explode=explode, shadow=True, colors=colors)
plt.show()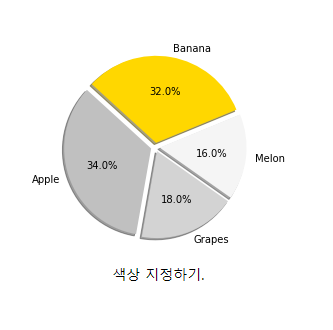
응용
# 특정 변수 빈도 계산
P_K_count = process.PROPOSER_KIND_CD.value_counts()

# P_K_count.index # 속성
# P_K_count # 값

import matplotlib.pyplot as plt

labels = P_K_count.index
ratio = P_K_count

explode = [0.05, 0.05, 0.05, 0.05,0.05]
colors = ['gold','silver','lightgray', 'whitesmoke', 'whitesmoke']

plt.figure(figsize=(8,8))
plt.title('본회의 처리 안건 중 의원 입법 비율', size=20)

plt.pie(ratio, labels=labels, autopct='%.1f%%', startangle=260, counterclock=False, explode=explode, shadow=True, colors=colors,textprops={'fontsize':20})
plt.show()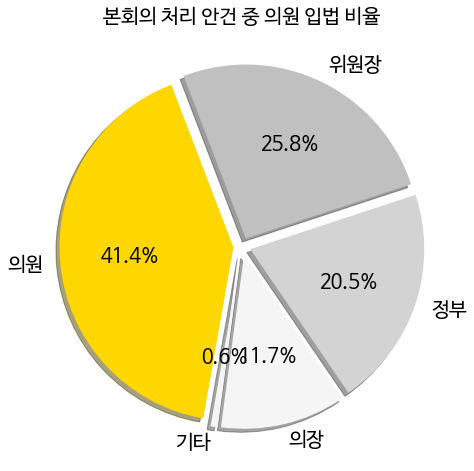

호앙조옹스우