예제 코드 (출처: https://rfriend.tistory.com/412)
1. 값 지정
 # info. of groups
group_names = ['Group_A', 'Group_B', 'Group_C']
group_sizes = [95, 54, 25]

# info. of subgroups
subgroup_names = ['A_1', 'A_2', 'A_3', 'A_4',
                  'B_1', 'B_2', 'B_3',
                  'C_1', 'C_2']

subgroup_sizes = [50, 30, 10, 5, 30, 20, 4, 20, 5]

# colors
a, b, c = [plt.cm.Reds, plt.cm.Greens, plt.cm.Blues]

# width
width_num = 0.4
2. 그림 출력
# Outside Ring

fig, ax = plt.subplots()
ax.axis('equal')
pie_outside, _ = ax.pie(group_sizes,
                        radius=1.3,
                        labels=group_names,
                        labeldistance=0.8,
                        colors=[a(0.6), b(0.6), c(0.6)])
plt.setp(pie_outside,
         width=width_num,
         edgecolor='white')

# Inside Ring
pie_inside, plt_labels, junk = \
    ax.pie(subgroup_sizes,
           radius=(1.3 - width_num),
           labels=subgroup_names,
           labeldistance=0.75,
           autopct='%1.1f%%',
           colors=[a(0.5), a(0.4), a(0.3), a(0.2),
                   b(0.5), b(0.4), b(0.3),
                   c(0.5), c(0.4)])

plt.setp(pie_inside,
         width=width_num,
         edgecolor='white')
plt.title('Donut Plot with Subgroups', fontsize=20)
plt.show()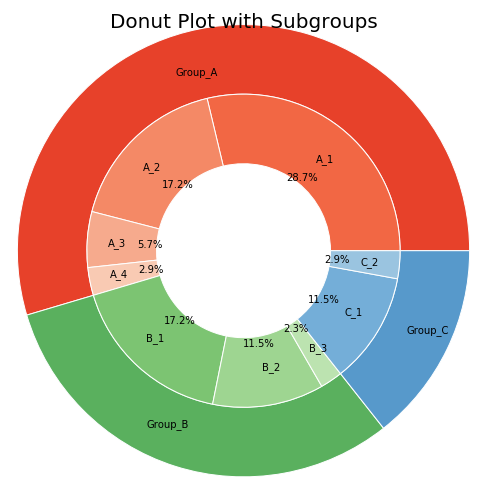
맛(?)있는 도넛 그래프를 그려보자##

호앙조옹스우