설정 방법
plt.style.use() 사용
- 테마 종류
‘default’‘dark_background’‘classic’‘ggplot’‘seaborn’
예제 코드
import numpy as np
import matplotlib.pyplot as plt
for theme in ['default','dark_background','classic','ggplot','seaborn']:
plt.style.use([theme]) # 테마 설정
plt.figure(figsize=(12, 4)) # 출력 크기 설정
plt.title(theme)
for i in range(5):
temp = np.random.normal(0,1,(100,1))[:,0] # 표준정규분포 추출 100개 list 형태로 저장
plt.plot(range(0,len(temp)), temp, label = f'line{i}') # line plot 출력
plt.legend() # 범례 추가
# plt.grid(False) # False로 설정 시 grid 제거
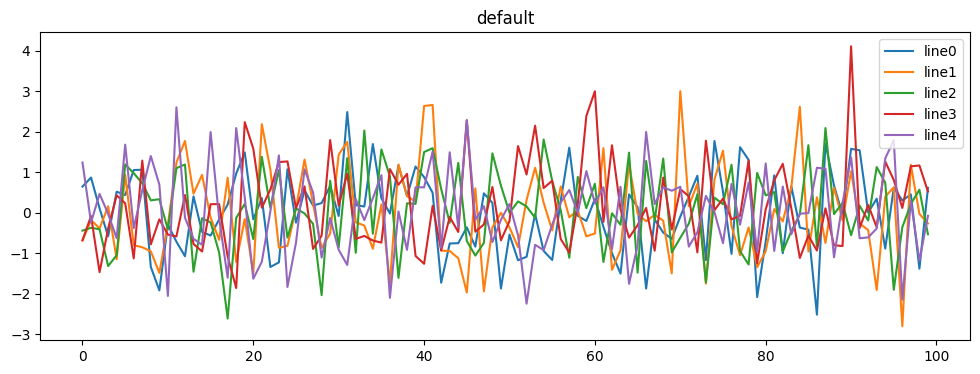
plt.show()default
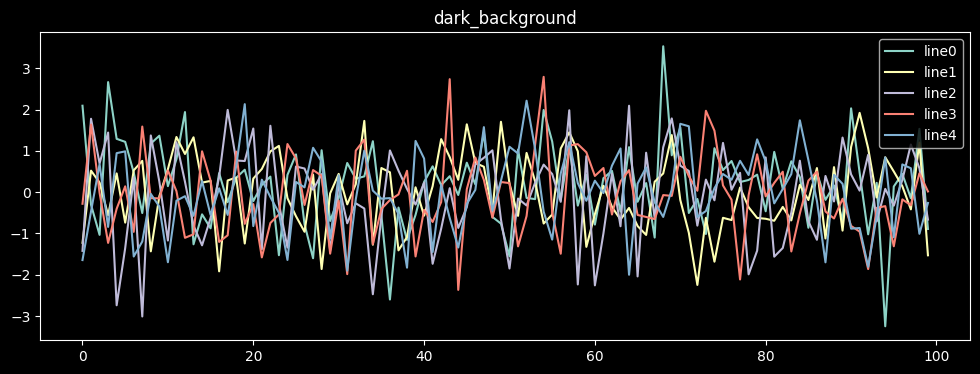
dark_background
classic

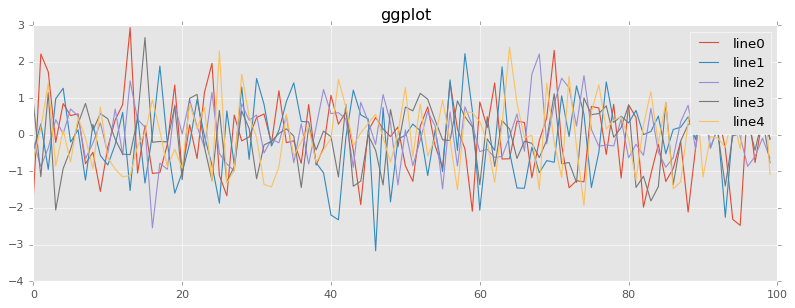
ggplot
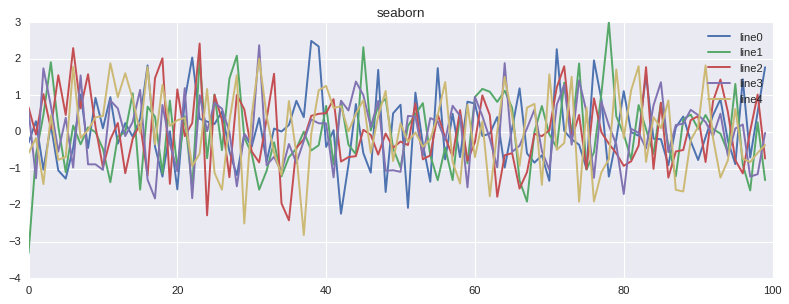
seaborn
끝!

호앙조옹스우