출처:https://jakevdp.github.io/PythonDataScienceHandbook/04.03-errorbars.html
basic errorbars
- 기본형
%matplotlib inline
import matplotlib.pyplot as plt
plt.style.use('seaborn-whitegrid')
import numpy as np
x = np.linspace(0, 10, 50)
dy = 0.8
y = np.sin(x) + dy * np.random.randn(50)
plt.errorbar(x, y, yerr=dy, fmt='.k');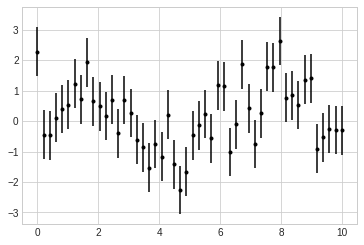
- 일부 옵션 설정
plt.errorbar(x, y, yerr=dy, fmt='o', color='black',
             ecolor='lightgray', elinewidth=3, capsize=0);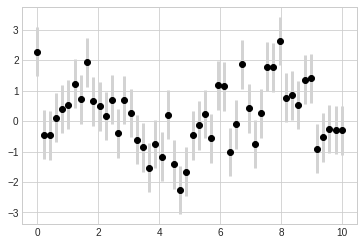

호앙조옹스우