예제 코드
- 대칭 편차
import matplotlib.pyplot as plt

x = [1, 2, 3, 4]
y = [1, 4, 9, 16]
yerr = [2.3, 3.1, 1.7, 2.5]

plt.errorbar(x, y, yerr=yerr)
plt.show()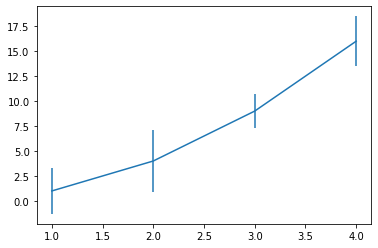
- 비대칭 편차
import matplotlib.pyplot as plt

x = [1, 2, 3, 4]
y = [1, 4, 9, 16]
yerr = [(2.3, 3.1, 1.7, 2.5), (1.1, 2.5, 0.9, 3.9)]

plt.errorbar(x, y, yerr=yerr)
plt.show()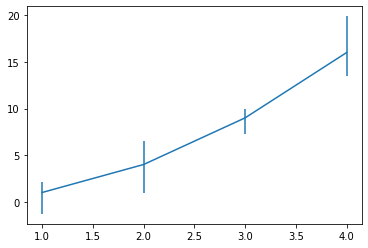
- 상한/하한 기호 표시하기
import numpy as np
import matplotlib.pyplot as plt

x = np.arange(1, 5)
y = x**2
yerr = np.linspace(0.1, 0.4, 4)

plt.errorbar(x, y + 4, yerr=yerr)
plt.errorbar(x, y + 2, yerr=yerr, uplims=True, lolims=True)

upperlimits = [True, False, True, False]
lowerlimits = [False, False, True, True]
plt.errorbar(x, y, yerr=yerr, uplims=upperlimits, lolims=lowerlimits)
plt.show()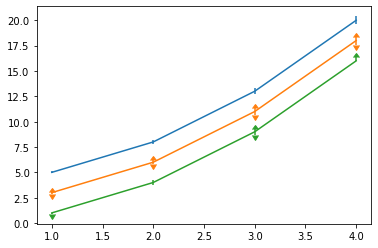
끝!

호앙조옹스우