Exploring ROC-AUC: A Deep Dive into Classifiers and Performance Metrics in AI

Classifier & Metrics
In the development process of AI models, the first task we usually encounter is the Classifier. Let's explore the methods for measuring the performance of a classifier and the advantages and disadvantages of these methods.
Accuracy
- It can be considered the most intuitive metric. It's the simplest metric.
- Problems:
- Class Imbalance:
When there's an imbalance in the number of data points across classes, a model that predicts only one class can still seem to perform well. - Sensitive to Outliers:
Since accuracy treats all predictions equally, the presence of outliers can skew the perceived accuracy, making it a less reliable metric.
- Class Imbalance:
❓ Wouldn't a model (A) that predicts a single class with 99% accuracy be better than a model (B) predicting multiple classes but with only 90% accuracy?
For instance, in a model distinguishing cancer patients, if 99% of the data are of healthy patients and 1% are cancer patients, model A wouldn't classify any cancer patients correctly. If model B accurately classifies even one cancer patient, it can be considered more valuable than model A.
Precision & Recall & Specificity
❓ What are False/True Negative/Positive?
Predictions are classified into four categories based on whether the predicted outcome is positive or negative, and whether that prediction matches the actual value. For instance, if healthy patients are labeled as Positive, then minimizing False Positive values is crucial for a cancer detection model.
Precision
- The ratio of actual positives among samples predicted as positive.
- Focuses on reducing False Positives.
Recall (Inversely related to Specificity)
- The ratio of samples correctly predicted as positive among actual positive samples.
- Focuses on reducing False Negatives.
Specificity
- The ratio of samples correctly predicted as negative among actual negative samples.
- Focuses on reducing False Positives.
F1 Score
-
The harmonic mean of Precision and Recall.
- Intuitively, the F1 Score performs well when both Precision and Recall are high and balanced.
- Useful for reducing both FN & FP.
- Unlike Accuracy, it is automatically sensitive to the smaller of Precision and Recall, making it a balanced metric.
-
Why is the harmonic mean considered to reflect the balance of two values?
As shown, the harmonic mean is larger when the ratio (r) is closer to 1 and a is larger.
ROC-AUC
Receiver Operating Characteristic Curve - Area Under the Curve
It represents the area under the curve formed by plotting the True Positives Rate (Y-axis) against the False Positives Rate (X-axis).
- TPR: The rate at which the model correctly predicts positive samples.
- FPR: The rate at which the model incorrectly predicts negative samples.
-
Sample Code
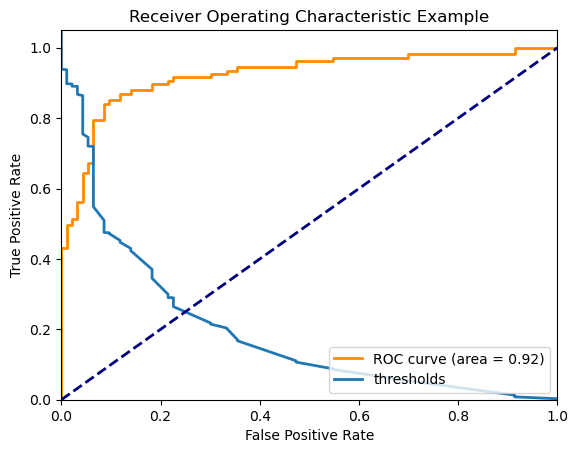
# Import Libraries from sklearn.datasets import make_classification from sklearn.linear_model import LogisticRegression from sklearn.model_selection import train_test_split from sklearn.metrics import roc_curve, auc import matplotlib.pyplot as plt # Generate Example Dataset X, y = make_classification(n_samples=1000, n_features=20, n_classes=2, random_state=42) # Split Data into Training and Test Sets X_train, X_test, y_train, y_test = train_test_split(X, y, test_size=0.2, random_state=42) # Create and Train Logistic Regression Model model = LogisticRegression() model.fit(X_train, y_train) # Calculate Prediction Probabilities on Test Data y_scores = model.predict_proba(X_test)[:, 1] # Calculate ROC Curve fpr, tpr, thresholds = roc_curve(y_test, y_scores) roc_auc = auc(fpr, tpr) # Plot ROC Curve plt.figure() plt.plot(fpr, tpr, color='darkorange', lw=2, label='ROC curve (area = %0.2f)' % roc_auc) plt.plot(fpr, thresholds, lw=2, label='thresholds') plt.plot([0, 1], [0, 1], color='navy', lw=2, linestyle='--') plt.xlim([0.0, 1.0]) plt.ylim([0.0, 1.05]) plt.xlabel('False Positive Rate') plt.ylabel('True Positive Rate') plt.title('Receiver Operating Characteristic Example') plt.legend(loc="lower right") plt.show() -
How to Plot ROC
- Input the test dataset into the model and calculate the prediction probabilities.
- Adjust the threshold value while calculating TPR and FPR, and plot these values in ascending order of FPR.
-
Interpreting the Graph
- As the threshold value decreases, the model's predictions bias towards Positive, naturally increasing both TPR and FPR.
-
Meaning of Area Under the Curve
- AUC = 1: Perfect classification. The model perfectly distinguishes between positive and negative samples.
-
0.5 < AUC < 1: Good classification. Closer the value to 1, better the model's performance. It shows the model's capability to distinguish between positive and negative samples.
3. **AUC = 0.5**: Random guessing. The model's performance is equivalent to randomly choosing positive or negative. It indicates the model doesn't provide useful predictions.

4. **AUC < 0.5**: Worse than random guessing. This implies the model tends to make incorrect predictions.
-
Intuitive Understanding of ROC-AUC
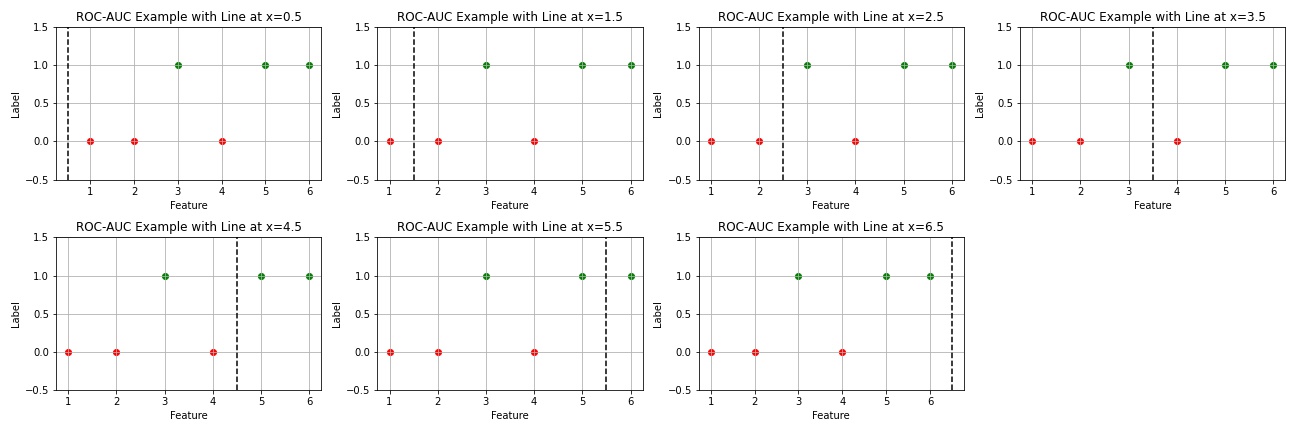 To aid understanding, an example with 6 data samples was created, with 2 types of labels and 1 type of feature.
-
The TPR and FPR values based on the threshold are as follows:
Threshold 0.5 Threshold 1.5 Threshold 2.5 Threshold 3.5 Threshold 4.5 Threshold 5.5 Threshold 6.5 TPR 1.00 1.00 1.00 0.67 0.67 0.33 0.00 FPR 1.00 0.67 0.33 0.33 0.00 0.00 0.00 -
At a threshold of 0.5, all labels are predicted as positive, hence both TPR and FPR are 1.
-
As the threshold increases, predictions of negative occur, naturally lowering both FPR and TPR. Here, a good model is one that lowers the False Positive Rate while keeping the True Positive Rate as high as possible.
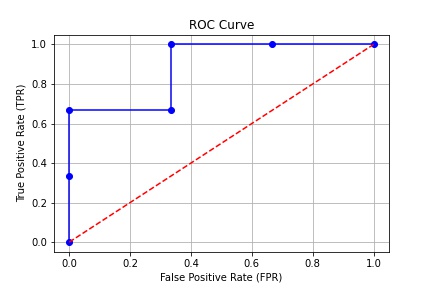
-
The simplest way to identify such a model is by calculating the area under the ROC curve.
-
-
When to Use ROC-AUC?
-
In cases of class imbalance
: In problems like fraud detection or disease diagnosis where positive samples (fraud, positive disease cases) are relatively rare, ROC-AUC helps in accurately evaluating how well the model distinguishes between positive and negative samples. -
When robust performance measurement is needed against threshold changes
: Useful when you want to understand the model's overall performance rather than its performance at a specific threshold. -
In situations like diagnostic tests where both sensitivity and specificity are important
: In medical diagnoses, missing a positive case (sensitivity) and misdiagnosing a healthy person (specificity) are both crucial. ROC-AUC comprehensively evaluates the relationship between sensitivity (true positive rate) and 1-specificity (false positive rate). -
For relatively simple binary classification problems
: ROC-AUC works best in binary classification scenarios. In multi-class classification problems, ROC-AUC is usually calculated separately for each class or different methods are used.
However, it's not recommended to solely rely on ROC-AUC in every situation. For example, when one type of error (false positive or false negative) incurs significantly higher costs, or when performance at a specific threshold is crucial, it's important to consider other performance metrics (e.g., precision, recall, F1 score) alongside ROC-AUC.
-
How to Define Positive and Negative Classes? Labeling Issues
The designation of positive and negative classes depends on the given problem and objectives. Typically, the positive class is the one of primary interest, and the negative class is everything else. Several factors can influence the choice of positive and negative classes:
-
Business Goals and Priorities:
Based on the purpose of using the classification model, you can decide which class to treat as positive. Consider which class has higher priority and select it as the positive class. -
Class Imbalance:
If there's an imbalance between positive and negative classes in the dataset, choosing the less frequent class as positive can be beneficial. This approach can increase accuracy, but one must consider issues stemming from class imbalance. -
Costs and Benefits:
The costs or benefits associated with each type of error can vary. You can decide which class to set as positive based on the costs of misclassifying positives and negatives. -
Domain Knowledge:
In certain domains, setting a specific class as positive can be more meaningful. You can choose the positive class based on the opinions of domain experts. -
Model Performance Perspective:
Consider whether recognizing a certain class as positive improves the model's performance. Evaluate the model's performance using metrics like Precision, Recall, F1 Score, etc., and accordingly set the appropriate class as positive.
In Conclusion
I recall being asked about ROC-AUC and F1 Score in a technical interview. At that time, I was flustered and couldn't respond about ROC-AUC, probably because I had never deeply understood it.
p.s. This content has been translated using ChatGPT, so there may be some mistranslations.