참고 영상
- 위 영상을 따라 Logstash를 학습한 내용을 기록한다.
- Windows 환경에서 위 실습을 따라가는 데 필요한 내용들을 주로 기술한다.(위 영상은 MacOS 환경이다.)
1. Logstash 실행
- logstash를 실행하기 위해선 input과 output 설정이 필수다.
- 방법 1.
bin/logstash.bat -e "input { stdin { } } output{ stdout{ } }"
- 방법 2.
bin/logstash.bat -f mypipeline.config
<mypipeline.config 파일 내용 샘플.>
======================================================
input{
	stdin{ }
}

output{
	stdout{ }
}
2. Logstash Input / Output 설정
2.1 conf 파일 설정과 내용.
-
Logstash는 input => filter => output 순서로 실행된다.
-
아래는 config 파일 설정 예시다. tcp의 9900포트로 수집한 정보를 elasticsearch 서버로 내보낸다.
input{
	tcp {
		port => 9900
  	}
}
output{
	elasticsearch {
    	hosts => ["ip:port"] #ES클러스터에 접근하기 위한 호스트 주소와 포트 번호
        user => "유저 ID"
        password => "패스워드"
    }
}
2.2 Windows에서 Logstash 동작 확인하는 방법.
2.2.1 Windows에서 Telnet 사용법(nc명령어 대체).
TCP 메시지를 보내기위해 Telnet 사용. localhost 9900포트에서 실행중인 Logstach에, tcp 메시지 "Hello Logstash"를 보내는 과정.
>telent
>set localecho		#사용자가 입력하는 내용을 콘솔에 출력.
>open localhost 9900 	#Logstash 실행중인 호스트와 포트
>send "Hello Logstash" 	# 쌍따옴표를 포함한 문자를 전송함.
>close 			#연결 종료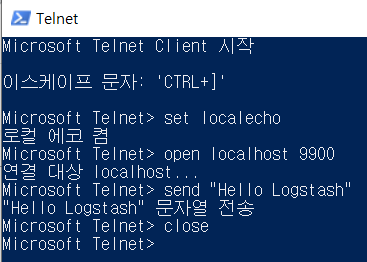
2.2.2 Windows에서 curl 명령 사용법.
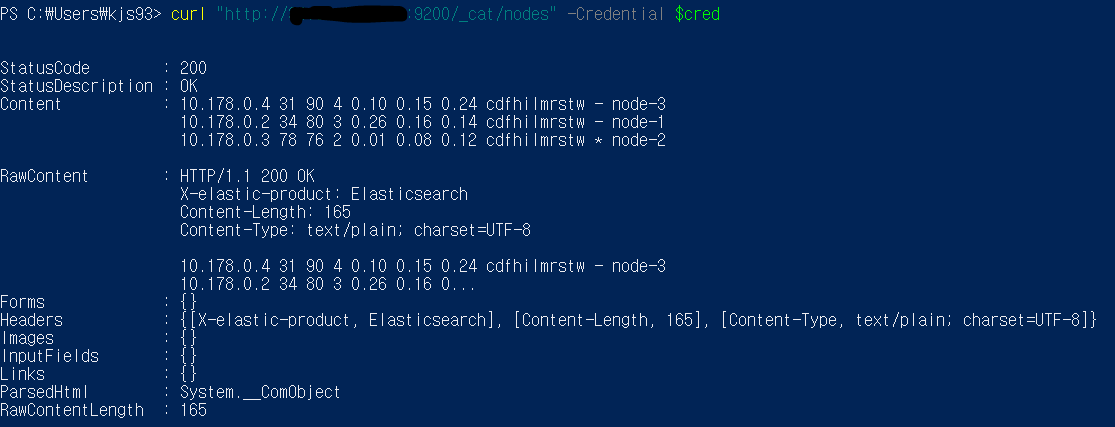
ElasticSearch 클러스터가 제대로 구성되어있는지 확인하기위해 URL( ip:port/_cat/nodes )로 요청을 보낸다.
>$cred = Get-Credential  #인증 정보를 입력할 팝업이 뜬다.
>curl "http://ip:port/_cat/nodes" -Credential $cred 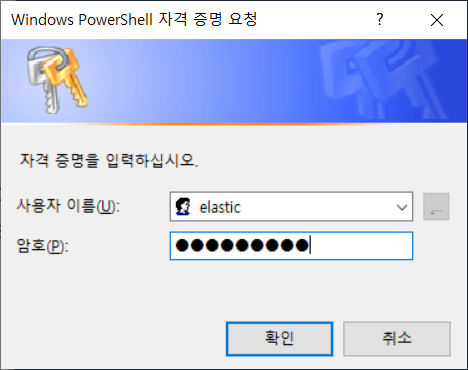
3.kibana에서 확인하기
-
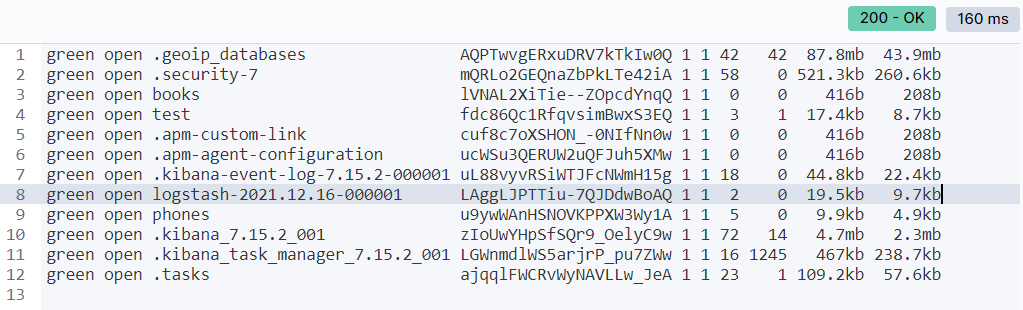
GET _cat/indices
음영으로 표시된 부분이 Logstach를 통해 입력된 Index다.
-
GET logstash*/_search
ElasticSearch 서버에 전달된 최종 데이터는 아래과 같다.
{
  {...},
      {
        "_index" : "logstash-2021.12.16-000001",
        "_type" : "_doc",
        "_id" : "twgsyH0BiFZi2jvaaJGS",
        "_score" : 1.0,
        "_source" : {
          "host" : "0:0:0:0:0:0:0:1",
          "message" : "\"Hello Logstash\"",
          "@version" : "1",
          "port" : 58726,
          "@timestamp" : "2021-12-17T11:34:53.091Z"
        }
      },
  {...}
}

테니스 좋아합니다.