
Trouble Shooting: Production environment docker image stops
언제볼까?의 v1이 완성된 이후
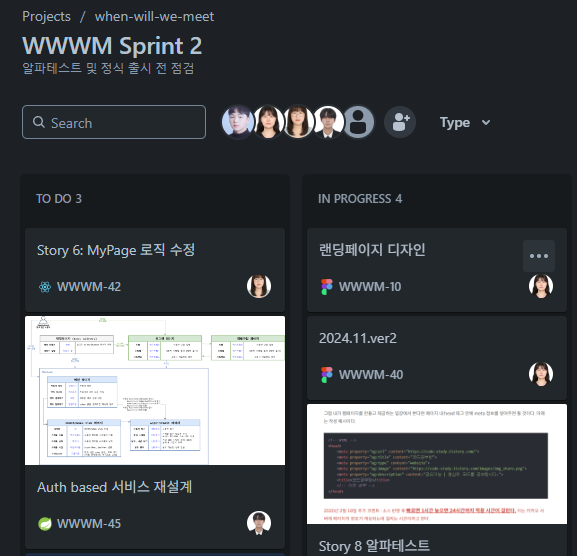 위와 같이 출시 전 알파 테스트를 진행하고 있을 때
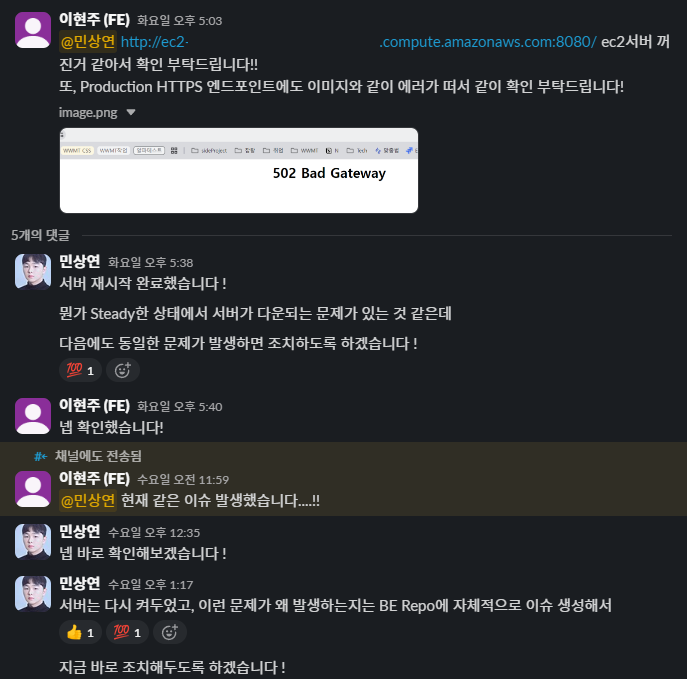 FE 팀원분께서 EC2 및 ALB 통해 배포되고 있는 서버가 별다른 이유 없이 멈춘다고 말씀주셔서
$ docker ps
CONTAINER ID   IMAGE     COMMAND   CREATED   STATUS    PORTS     NAMES
$ docker ps -a
CONTAINER ID   IMAGE  COMMAND               CREATED      STATUS                      PORTS     NAMES
422eea5457a7   ...   "java -jar app.jar"   2 days ago   Exited (137) 11 hours ago             wwwm-spring-be
Docker Container를 확인한 결과 Exited (137) 상태로 종료되었던 것을 확인하였다.
137은 SIGKILL에 의해 강제 종료된 메세지로, OOM으로 인한 가능성이 높다고 판단하여
$ free -h
               total        used        free      shared  buff/cache   available
Mem:           764Mi       506Mi        56Mi        17Mi       327Mi       258Mi
Swap:             0B          0B          0B
우선 인스턴스의 메모리를 확인하고
sudo docker run -p 8080:8080 \
  ...
  --memory=900m \
  ...
이후 이전에 이미지를 실행할 때 메모리 제한을 900m으로 두고 있었던 것을 확인하여
$ df -h
Filesystem      Size  Used Avail Use% Mounted on
devtmpfs        4.0M     0  4.0M   0% /dev
tmpfs           383M     0  383M   0% /dev/shm
tmpfs           153M   17M  137M  11% /run
/dev/xvda4      8.8G  2.6G  6.2G  30% /
/dev/xvda3      960M  172M  789M  18% /boot
/dev/xvda2      200M  7.1M  193M   4% /boot/efi
tmpfs            77M     0   77M   0% /run/user/1000
...
현재 디스크 정보를 확인한 이후
sudo fallocate -l 1G /swapfile
sudo chmod 600 /swapfile
sudo mkswap /swapfile
sudo swapon /swapfile
1G 크기의 swap 메모리를 할당하고
echo '/swapfile none swap sw 0 0' | sudo tee -a /etc/fstab추후 인스턴스가 재시작 될 경우에도 자동으로 적용하도록 변경
$ free -h
               total        used        free      shared  buff/cache   available
Mem:           764Mi       516Mi        65Mi        17Mi       309Mi       248Mi
Swap:          1.0Gi          0B       1.0Gi

$ swapon --show
NAME      TYPE  SIZE USED PRIO
/swapfile file 1024M   0B   -2
이후 swap 메모리가 정상적으로 할당된 것을 확인한 이후
sudo docker run -p 8080:8080 \
  --network host \
  --user 1000:1000 \
  --cpus=0.8 \
  --memory=400m \
  --memory-swap=800m \
  -e JAVA_OPTS="-Xmx300m -Xms300m" \
  --restart=always \
  ...
위와 같이 이미지를 실행하도록 변경하였다.
--memory=400m,--memory-swap=800m: 실제 RAM(400MB) + Swap(400MB) = 총 800MB까지 사용 가능하여 OOM으로 인한 컨테이너 Exit 방지-Xmx300m -Xms300m: JVM이 최대 300MB만 사용하도록 제한하여 컨테이너의 메모리 초과 방지--restart=always: 컨테이너가 예상치 못하게 종료되었을 경우 자동으로 재시작--cpus=0.8: CPU 사용량을 0.8 코어로 제한하여 EC2 인스턴스의 성능 유지
https://github.com/TEAM-WHEN-WILL-WE-MEET/WWWM-SPRING-BE/issues/3
Monitoring Infra Configuration
위와 같은 문제는 현재 단일 인스턴스로 실행되는 환경이고, 최근까지 작접을 진행하여 기억이 생생한 상태였기에 운 좋게 이를 바로 확인할 수 있었지만
추후 실제 서비스가 되고 Auto Scaling 등이 적용된 상태에서는 위와 같이 일일히 확인하기 어렵다고 판단하여 별도의 Monitoring Infra를 구축하고자 한다.
Infra Architecture
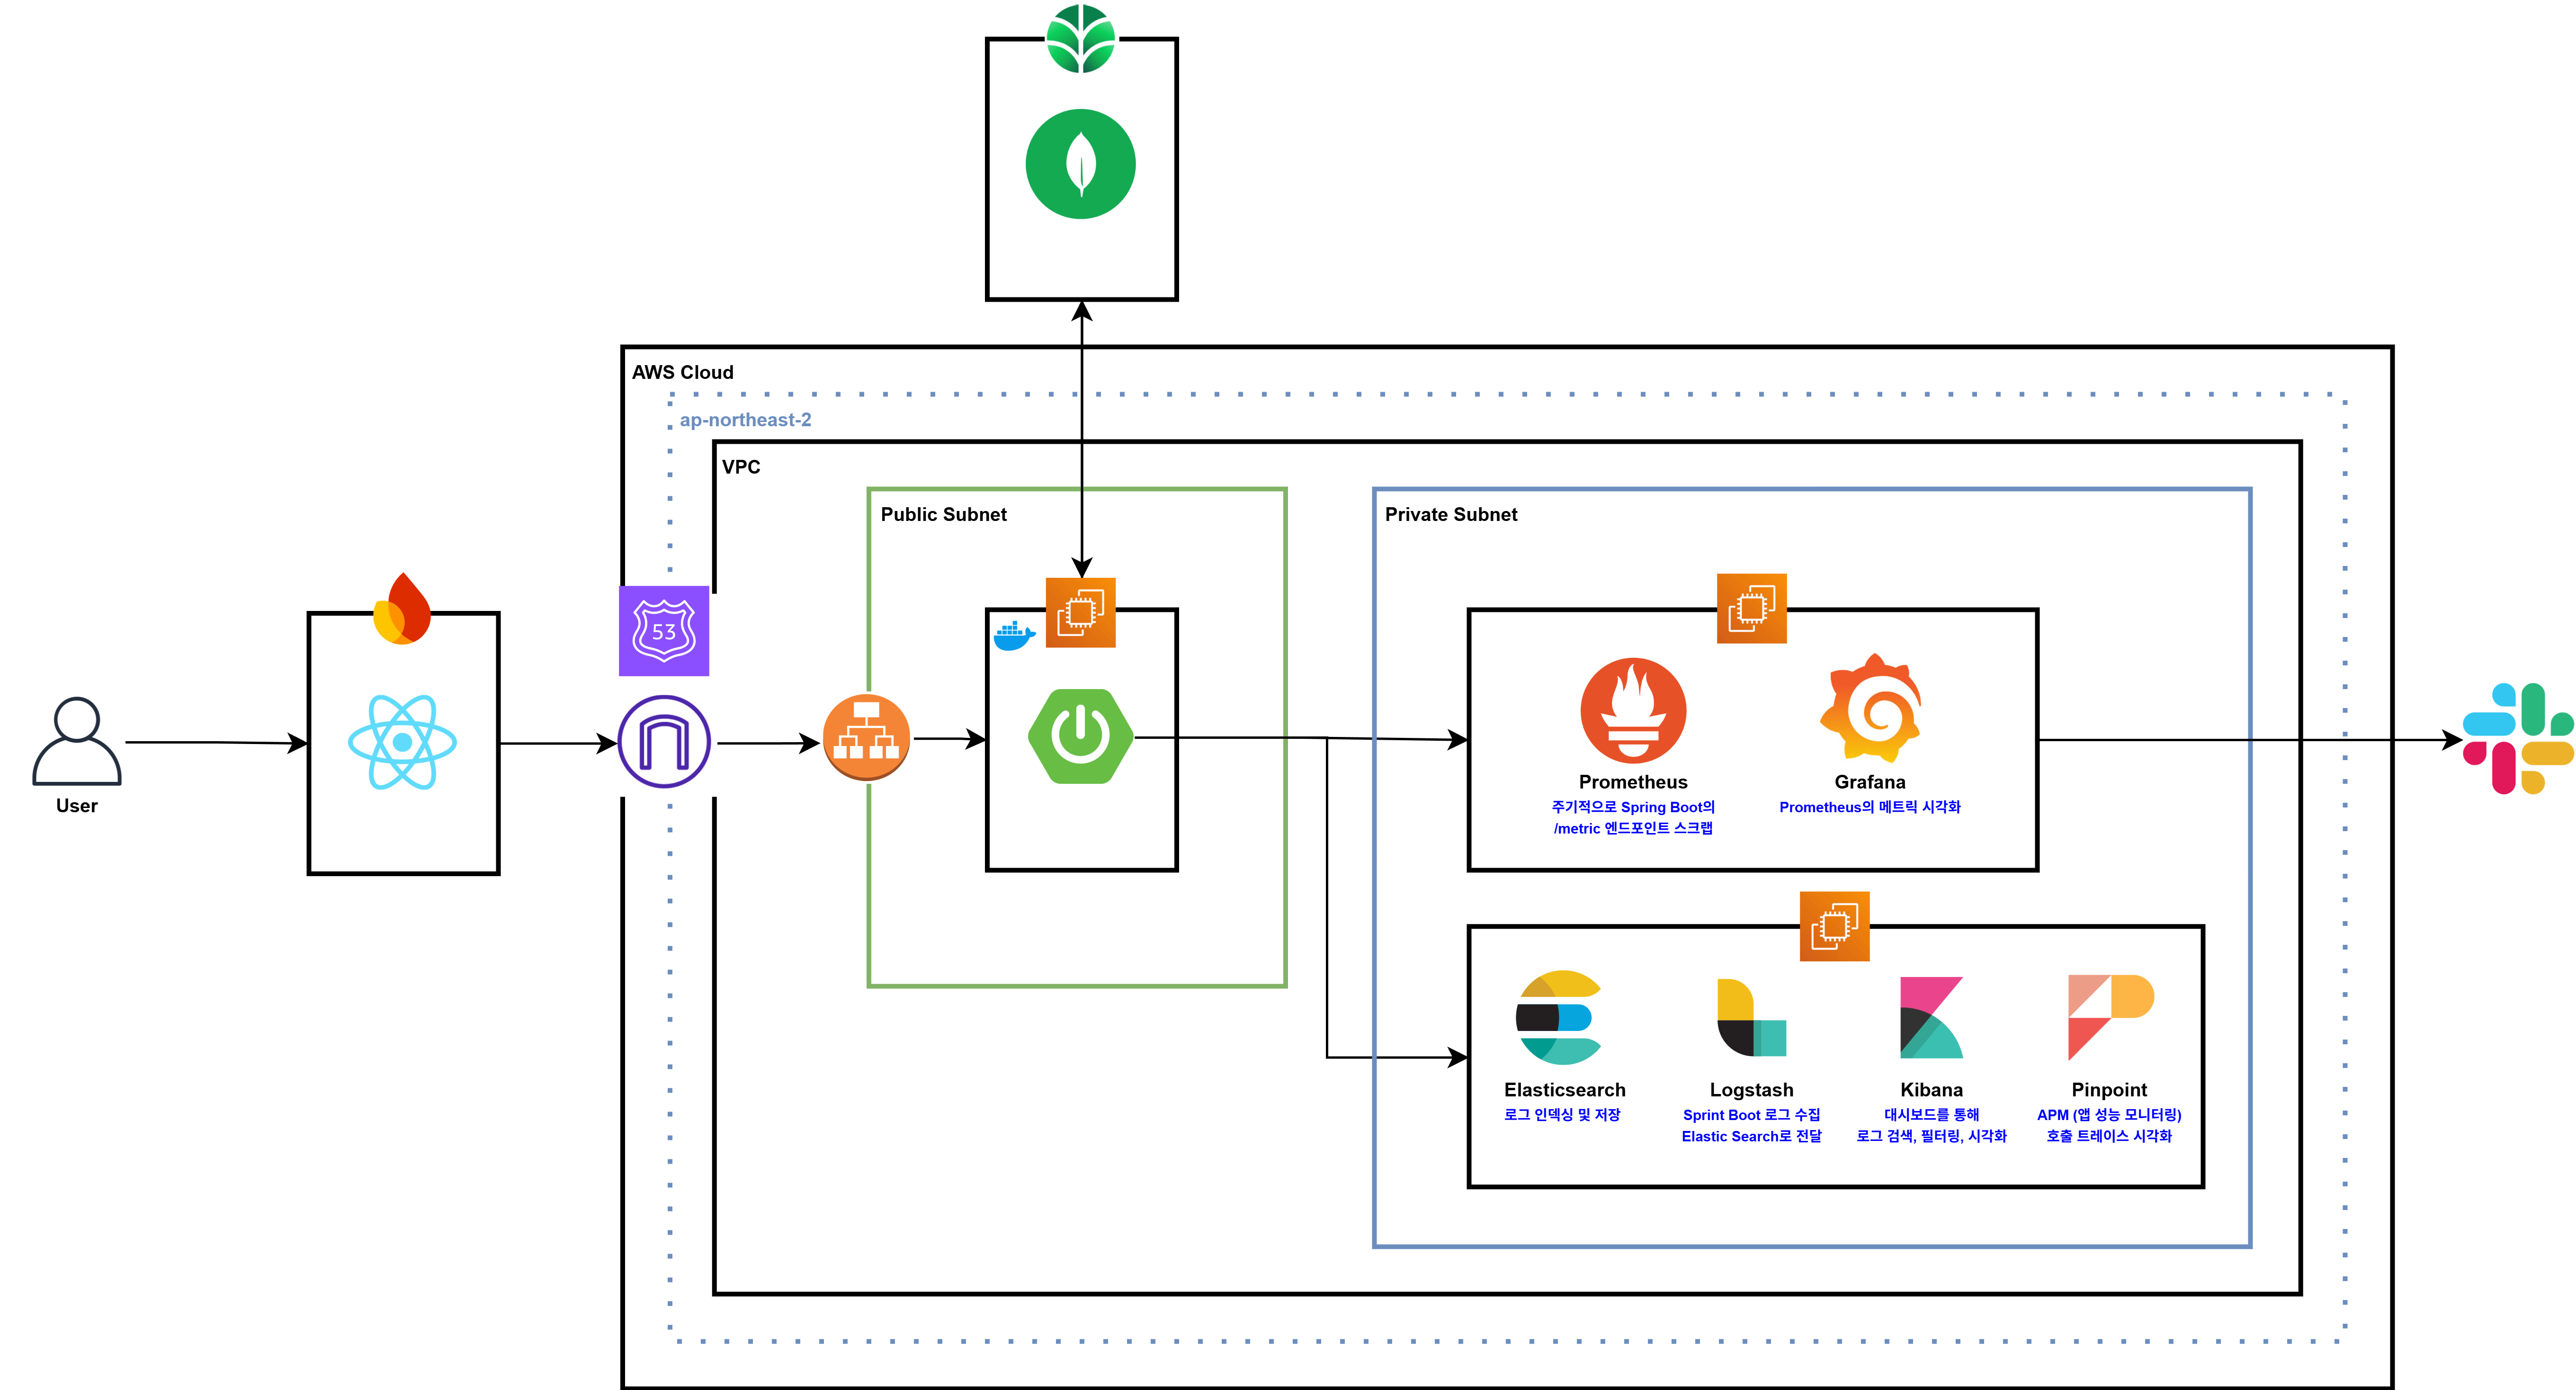 우선 모니터링 인프라 아키텍처는 위와 같으며 아래와 같이 이를 구축할 계획이다.
- Spring Boot
Pinpoint Agent를 통해 APM 데이터(트랜잭션 추적, 응답 시간, TPS 등) 전송Micrometer등을 통해Prometheus에서 수집할 메트릭 노출(Actuator /metrics 엔드포인트)- 애플리케이션 로그는 파일 또는 콘솔로 출력
Prometheus & Grafana
Prometheus서버가Spring Boot메트릭 수집Grafana에서 대시보드로 시각화(애플리케이션 지표, 서버 자원 사용량, DB 지표 등)
- ELK Stack
Logstash로 Spring Boot 로그, 시스템 로그, Docker 로그 등 수집Elasticsearch에 저장 후 검색 가능하게 인덱싱Kibana로 로그 대시보드, 검색 및 시각화, 에러 추적
- Pinpoint Collector / Web
- 애플리케이션에서 전달되는 APM 데이터 수집 및 저장
Pinpoint Web에서 트랜잭션 흐름, Slow Query, 성능 병목 등을 UI로 분석
- Alerting
Prometheus의Alertmanager와 연동하여 CPU, Memory, 오류율 등 임계치 초과 시Slack알림Elasticsearch Watcher등을 통해 특정 패턴의 에러 로그 발생 시 알림
Spring Boot Logging
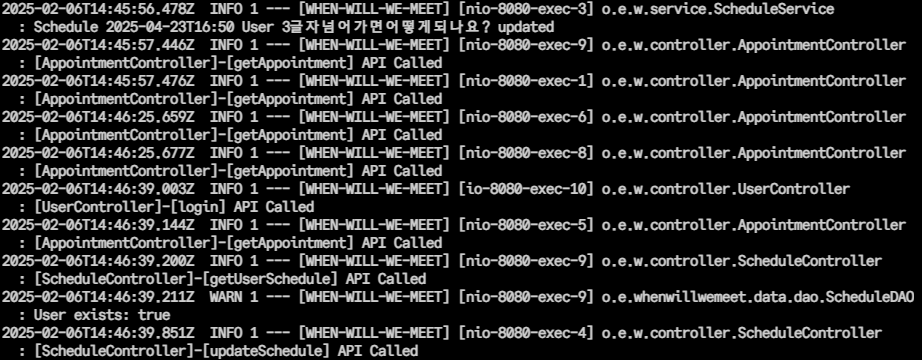 우선 위와 같이 기존
 v1을 개발할 때의 로그는 어떤 Appointment 및 어떤 User에서 로그가 발생하였는지 알기 어려웠기 때문에
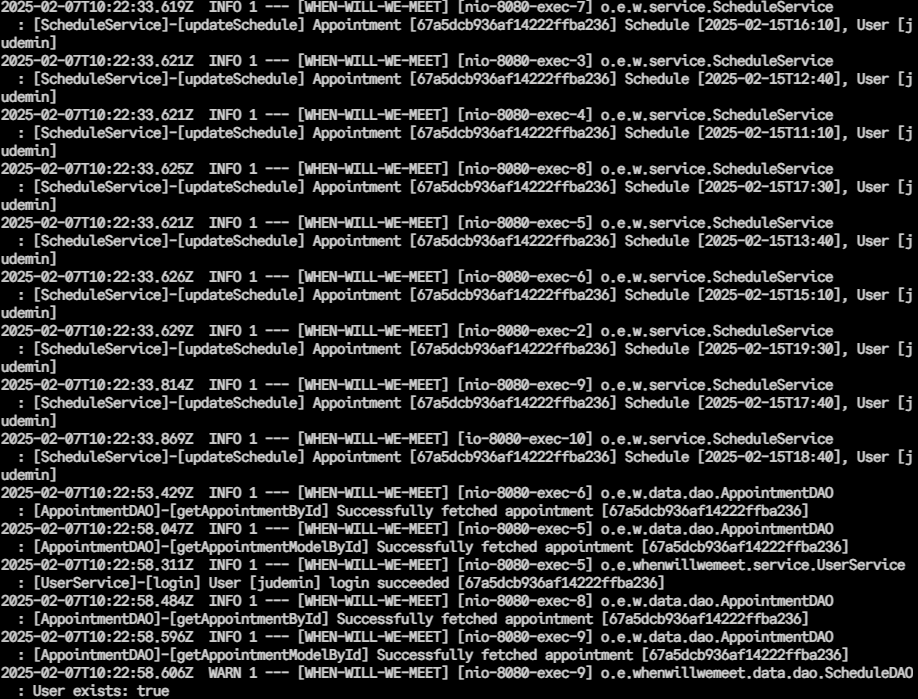 BE 코드를 리팩토링하여 위와 같이 더 상세한 로깅이 가능하도록 변경하였다.
@Slf4j
@Controller
public class IndexController {
    @GetMapping("/")
    public Object index(HttpServletRequest request) {
        String clientIp = getClientIp(request);
        String userAgent = request.getHeader("User-Agent");

        // ELB Health Checker 요청 필터링
        // ELB Health Checker 요청이면 200 OK 응답만 반환
        if (userAgent != null && userAgent.startsWith("ELB-HealthChecker"))
            return ResponseEntity.ok().build();

        // 인덱스 페이지는 접근할 일이 없기 때문에
        // 인덱스 페이지 접근시 요청한 Client의 IP와 Agent를 로깅
        log.info("[IndexController]-[index] Client IP: {}", clientIp);
        log.info("[IndexController]-[index] User-Agent: {}", userAgent);

        return "index";
    }

    private String getClientIp(HttpServletRequest request) {
        String ip = request.getHeader("X-Forwarded-For");
        if (ip == null || ip.isEmpty() || "unknown".equalsIgnoreCase(ip)) {
            ip = request.getRemoteAddr();
        }
        return ip;
    }
}
또한 인덱스 페이지는 개발 목적이 아닌 이유로는 접근할 일이 없기 때문에 IndexController를 위와 같이 변경하여
 인덱스 페이지 접근시 요청한
 Client의 IP와 Agent를 로깅하여 예상하지 못한 BE 서버로의 접근을 추적할 수 있도록 하였다.
Prometheus + Grafana
Architecture
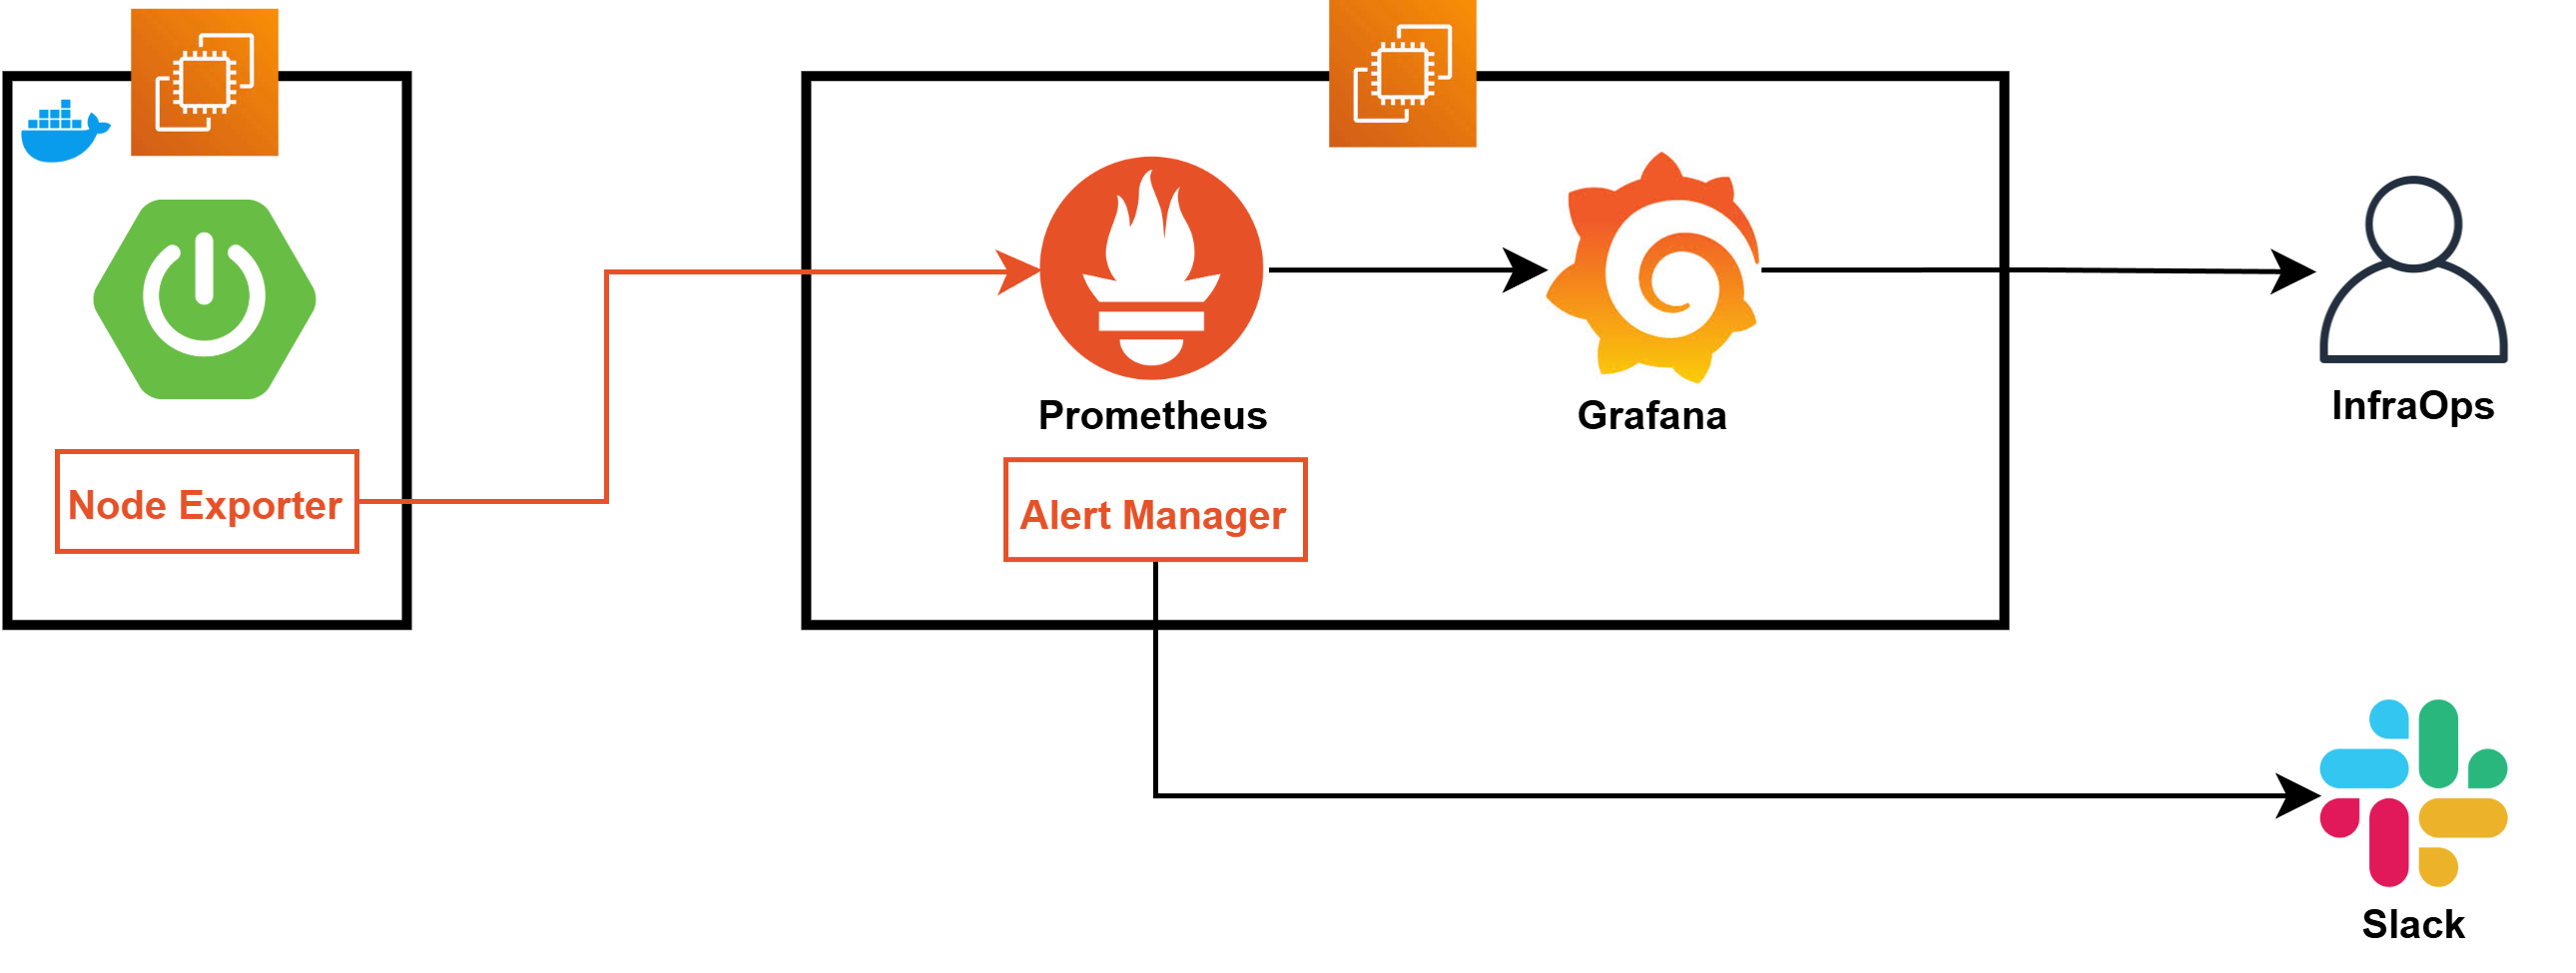 우선 Prometheus와 Grafana를 현재 구동되고 있는 Spring Boot EC2의 정보를 습득하도록 하기 위해서는 위와 같은 구조로 동작해야 한다.
현재는 이를 적용하기 쉽도록 동일한 Public Subnet에서 진행하지만, 알파테스트가 끝난 이후 Priavte Subnet으로 해당 인스턴스를 옮길 계획이다.
-
Exporter- 모니터링이 필요한 서버에 Exporter가 존재해야 한다
- Exporter는 해당 서버의 필요한 정보를 내보내는 역할을 한다
- MySQL, SpringBoot, Nginx 등 서버의 용도에 따라 원하는 정보를 내보낼 수 있다
-
Prometheus- 데이터를 수집하는 역할을 한다
- 정해진 주기마다 Exporter에 데이터를 요청한다
- 여러 Exporter에 연결되어 정보를 받아서 수집하는 것도 가능하다
-
Alert Manager- Prometheus에서 설정한 경고(Alert)를 관리하는 역할을 한다
= 특정 임계값을 초과하거나 이상 징후가 감지되었을 때 알림을 생성한다 - 이메일, Slack, PagerDuty 등 다양한 방법으로 알림을 전송할 수 있다
- 알림을 그룹화하거나 중복 알림을 방지하는 기능도 제공한다
- Prometheus에서 설정한 경고(Alert)를 관리하는 역할을 한다
-
Grafana- 데이터를 시각화하는 역할을 한다
- 데이터를 확인할 때 Grafana에 접근해서 확인한다
Prometheus Architecture
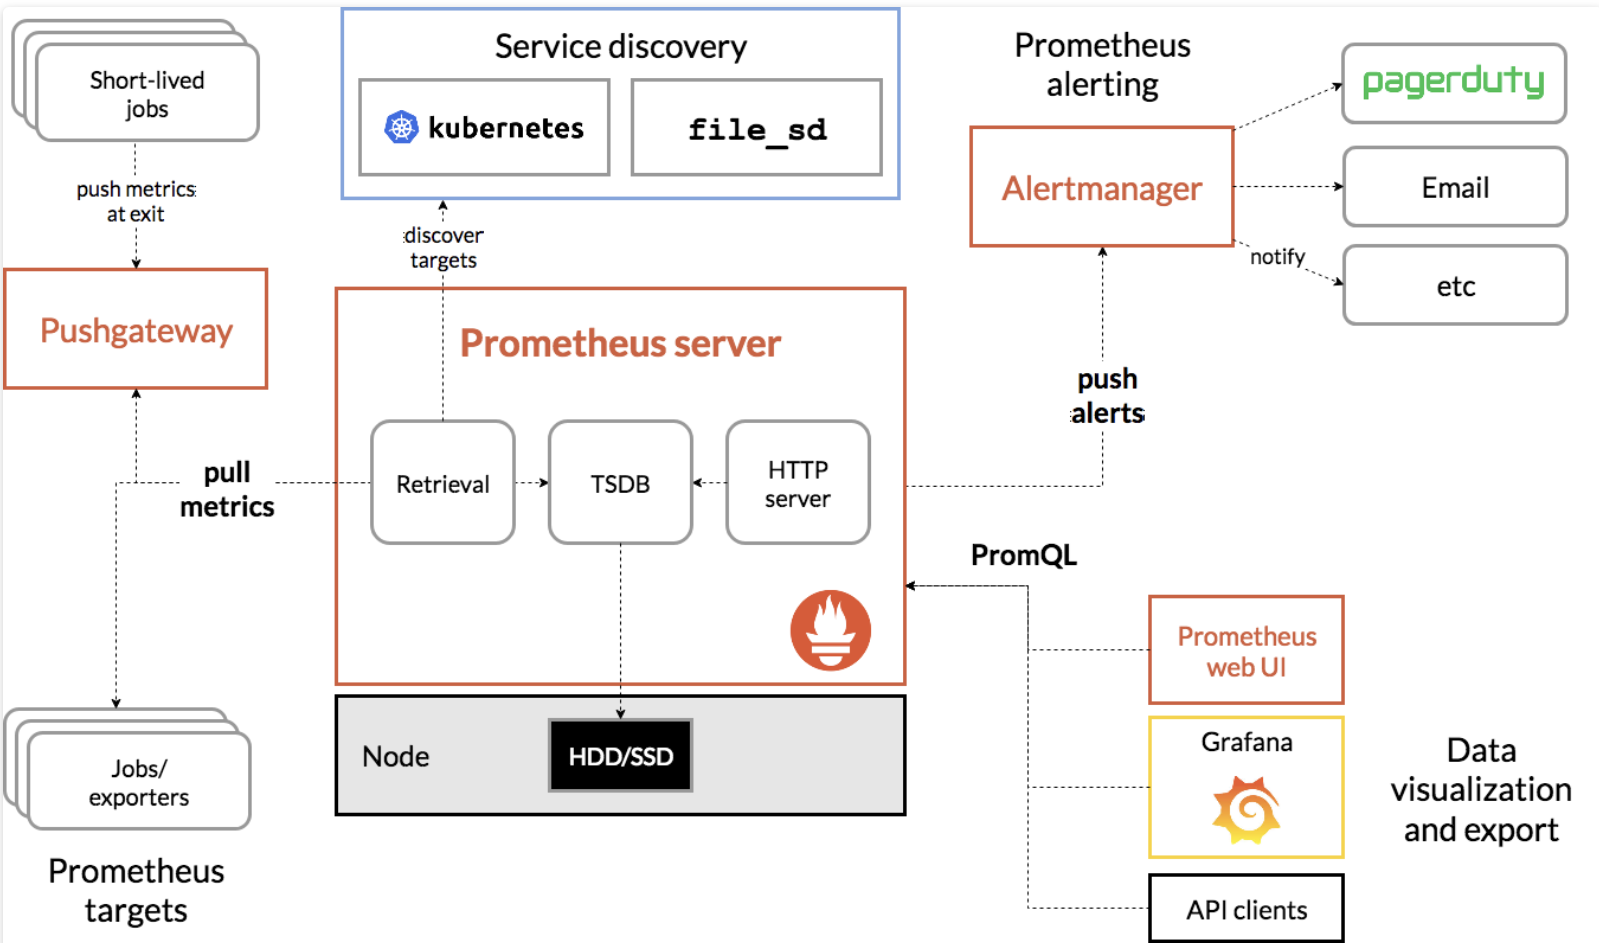
프로메테우스는 Soundcloud사에서 개발한 오픈소스 모니터링 툴로, vm이나 container node의 메트릭 정보를 시계열데이터로 저장하고 관리
2016년에 CNCF에 합류했으며, 서비스 운영을 위해 모니터링 시스템을 구축할 때 가장 널리 사용되는 툴이기도 함
-
Prometheus Targets
- Exporter 또는 Jobs와 같은 데이터 제공자가 메트릭을 Prometheus로 노출
- Prometheus는 이를 주기적으로 Pull 방식으로 수집
-
Pushgateway
- 단명(short-lived) 작업의 메트릭을 수집
- 작업 종료 시 메트릭을 Push 방식으로 전달하여 Prometheus가 이를 Pull할 수 있도록 중개 역할 수행
-
Service Discovery
- Kubernetes나 File-based Service Discovery를 통해 동적으로 메트릭 수집 대상(타겟)을 자동으로 발견
-
Prometheus Server
- Retrieval: 타겟으로부터 데이터를 주기적으로 가져옴
- TSDB(Time Series Database): 가져온 데이터를 시계열 데이터로 저장
- HTTP Server: PromQL을 통해 데이터를 쿼리하거나 Alert 조건을 확인
- 데이터를 HDD/SSD 스토리지에 저장
-
Prometheus Alerting
- PromQL로 정의된 조건에 따라 Alert를 생성
- 경고가 발생하면 Alertmanager로 전달
-
Alertmanager
- 경고를 처리하고 알림을 전송
- PagerDuty, 이메일, Slack 등의 채널로 알림 제공
- 알림 그룹화 및 중복 제거 기능 포함
-
Data Visualization and Export
- Prometheus Web UI: 데이터 조회와 간단한 시각화 가능
- Grafana: 대시보드 형태로 데이터를 시각화하여 실시간 모니터링 제공
- API Clients: Prometheus API를 통해 외부 애플리케이션으로 데이터 연동 가능
Dataflow
- Exporter 또는 Pushgateway에서 메트릭 데이터가 Prometheus로 수집
- Prometheus Server가 데이터를 저장하고 경고 조건을 분석
- 경고 발생 시 Alertmanager가 알림을 전송
- Grafana를 통해 시각화된 데이터를 대시보드에서 확인
Prometheus Configuration
EC2 Instance Configuration
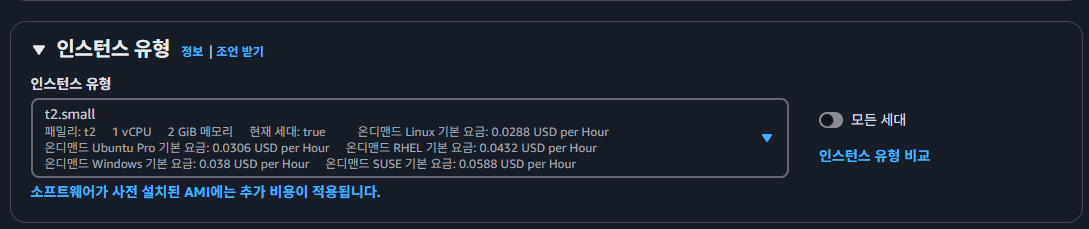 우선 공식 문서와 기타 레퍼런스에 따라
 t2.small 이미지의 인스턴스를 생성해주고
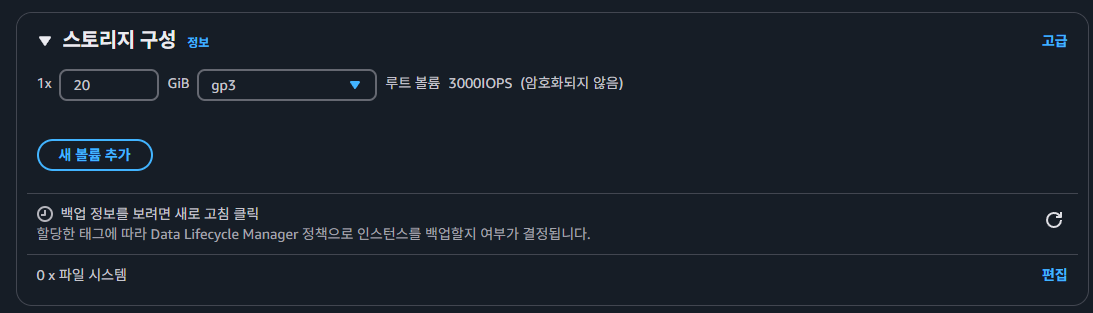 볼륨 스토리지 또한 추후 Log들이 쌓일 것을 대비해
 20GiB로 인스턴스를 생성해주었다.
Node Exporter Configuration
yum install -y wget

# node_exporter 다운로드
wget https://github.com/prometheus/node_exporter/releases/download/v1.8.2/node_exporter-1.8.2.linux-amd64.tar.gz

# 압축 해제
tar xvfz node_exporter-1.8.2.linux-amd64.tar.gzPrometheus는 Node Exporter를 통해 데이터를 수집하기 때문에 위와 같이 Node Exporter를 다운로드하고 압축을 풀어준다.
$ mv node_exporter-1.8.2.linux-amd64/ /home/ec2-user/
$ ls /home/ec2-user/
node_exporter-1.8.2.linux-amd64
$ chmod 777 /home/ec2-user/node_exporter-1.8.2.linux-amd64/node_exporter

$ ls -l /home/ec2-user/node_exporter-1.8.2.linux-amd64/
total 20040
-rw-r--r--. 1 1001 1002    11357 Jul 14  2024 LICENSE
-rwxrwxrwx. 1 1001 1002 20500541 Jul 14  2024 node_exporter
-rw-r--r--. 1 1001 1002      463 Jul 14  2024 NOTICE
이후 위와 같이 추후 systemd에서 ec2-user로 실행 가능하도록 폴더를 옮겨주고 실행 파일에 대한 권한을 변경한다.
$ vi /etc/systemd/system/node_exporter.service
[Unit]
Description=Node Exporter
Wants=network-online.target
After=network-online.target

[Service]
User=ec2-user
ExecStart=/home/ec2-user/node_exporter-1.8.2.linux-amd64/node_exporter --web.listen-address=:9100
Restart=always

[Install]
WantedBy=multi-user.target
systemd 서비스 파일 node_exporter.service을 위와 같이 생성해주고
# 서비스 파일 리로드
sudo systemctl daemon-reload

# Node Exporter 서비스 시작
sudo systemctl start node_exporter

# 부팅 시 자동 시작 활성화
sudo systemctl enable node_exporter
위와 같이 Node Exporter 서비스를 실행하고
$ systemctl status node_exporter
● node_exporter.service - Node Exporter
     Loaded: loaded (/etc/systemd/system/node_exporter.service; enabled; preset: disabled)
     Active: active (running) since Sat 2025-02-08 07:27:13 UTC; 15s ago
   Main PID: 147200 (node_exporter)
      Tasks: 3 (limit: 4377)
     Memory: 4.6M
        CPU: 9ms
     CGroup: /system.slice/node_exporter.service
└─147200 /home/ec2-user/node_exporter-1.8.2.linux-amd64/node_exporter --web.listen-address=:91009100번 포트에서 정상적으로 실행되고 있는 모습을 확인한다.
$ curl localhost:9100/metrics
...
# TYPE promhttp_metric_handler_errors_total counter
promhttp_metric_handler_errors_total{cause="encoding"} 0
promhttp_metric_handler_errors_total{cause="gathering"} 0
# HELP promhttp_metric_handler_requests_in_flight Current number of scrapes being served.
# TYPE promhttp_metric_handler_requests_in_flight gauge
promhttp_metric_handler_requests_in_flight 1
# HELP promhttp_metric_handler_requests_total Total number of scrapes by HTTP status code.
# TYPE promhttp_metric_handler_requests_total counter
promhttp_metric_handler_requests_total{code="200"} 1
promhttp_metric_handler_requests_total{code="500"} 0
promhttp_metric_handler_requests_total{code="503"} 0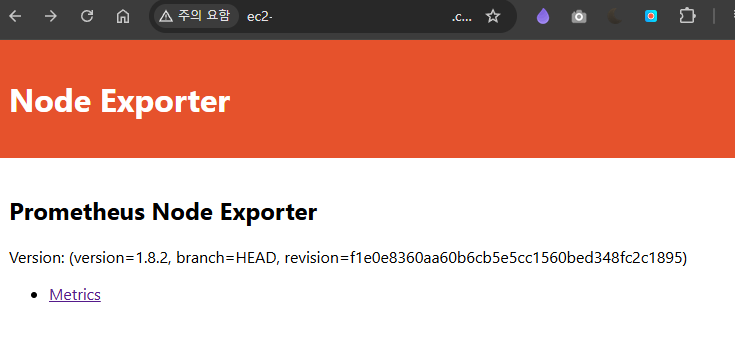 이후 Spring Boot가 실행되고 있는 서버로의 Node Exporter 접근을 확인한다.
// build.gradle
// Prometheus 관련 의존성 추가
implementation 'org.springframework.boot:spring-boot-starter-actuator'
implementation 'io.micrometer:micrometer-registry-prometheus'
또한 추가적으로 Spring의 의존성을 추가해준다.
Install Prometheus
wget https://github.com/prometheus/prometheus/releases/download/v3.1.0/prometheus-3.1.0.linux-amd64.tar.gz
tar xvfz prometheus-3.1.0.linux-amd64.tar.gz
Prometheus를 설치하기 위해 위와 같이 다운로드 받은 후
$ vi ./prometheus-3.1.0.linux-amd64/prometheus.yml
...
scrape_configs:
  # The job name is added as a label `job=<job_name>` to any timeseries scraped from this config.
  - job_name: "node-server"

    # metrics_path defaults to '/metrics'
    # scheme defaults to 'http'.

    static_configs:
      - targets: ["<node_ip>:9100"]
prometheus.yml 설정 파일에서 scrape_configs에 기존에 설정한 Node Exporter의 IP를 추가한다.
$ mv prometheus-3.1.0.linux-amd64 /home/ec2-user/
$ ls -al /home/ec2-user/prometheus-3.1.0.linux-amd64/
total 278836
drwxr-xr-x. 2     1001      118        91 Feb  8 07:40 .
drwx------. 4 ec2-user ec2-user       110 Feb  8 07:41 ..
-rw-r--r--. 1     1001      118     11357 Jan  2 14:07 LICENSE
-rw-r--r--. 1     1001      118      3773 Jan  2 14:07 NOTICE
-rwxr-xr-x. 1     1001      118 147248362 Jan  2 13:57 prometheus
-rw-r--r--. 1     1001      118       937 Feb  8 07:40 prometheus.yml
-rwxr-xr-x. 1     1001      118 138252929 Jan  2 13:57 promtool

$ chmod +x /home/ec2-user/prometheus-3.1.0.linux-amd64/prometheus
이후 위와 같이 해당 파일을 옮긴 후 권한을 재설정해주고
mkdir -p /home/ec2-user/prometheus-3.1.0.linux-amd64/data
chmod 777 /home/ec2-user/prometheus-3.1.0.linux-amd64/data
Prometheus는 /data 디렉터리가 필요하기 때문에 추가적으로 생성하고 권한을 부여한다.
만약 이를 생성하지 않는다면 "Failed to create directory for logging active queries", "panic: Unable to create mmap-ed active query log"와 같은 오류가 발생한다.
$ vi /etc/systemd/system/prometheus.service
[Unit]
Description=Prometheus Monitoring System
Wants=network-online.target
After=network-online.target

[Service]
User=ec2-user
Group=ec2-user
ExecStart=/home/ec2-user/prometheus-3.1.0.linux-amd64/prometheus --config.file=/home/ec2-user/prometheus-3.1.0.linux-amd64/prometheus.yml --storage.tsdb.path=/home/ec2-user/prometheus-3.1.0.linux-amd64/data --web.listen-address=:8080
Restart=always
WorkingDirectory=/home/ec2-user/prometheus-3.1.0.linux-amd64/

[Install]
WantedBy=multi-user.target
이후 prometheus.service 서비스 데몬 파일을 위와 같이 설정하고
sudo systemctl daemon-reload
sudo systemctl enable prometheus
sudo systemctl start prometheussystemctl을 통해 실행하면
$ sudo systemctl status prometheus
● prometheus.service - Prometheus Monitoring System
Loaded: loaded (/etc/systemd/system/prometheus.service; enabled; preset: disabled)
Active: active (running) since Sat 2025-02-08 08:14:17 UTC; 4s ago
Main PID: 5601 (prometheus)
Tasks: 5 (limit: 2319)
Memory: 15.4M
CPU: 50ms
CGroup: /system.slice/prometheus.service
└─5601 /home/ec2-user/prometheus-3.1.0.linux-amd64/prometheus --config.file=/home/ec2-user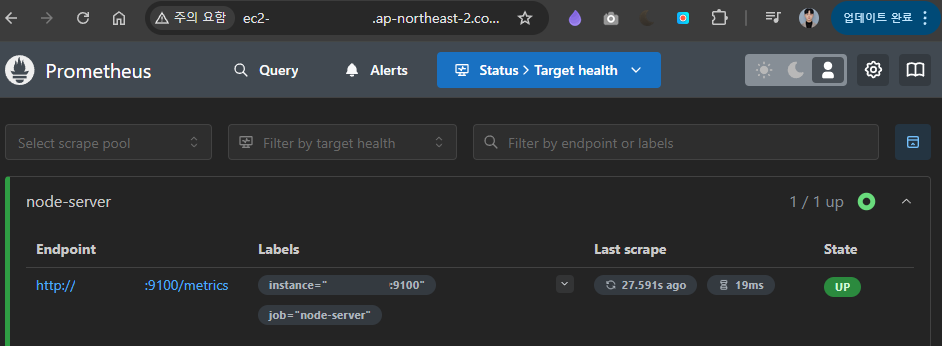 Prometheus 서비스가 정상 동작하고 접근이 가능한 것을 볼 수 있다.
Alert Manager Setup
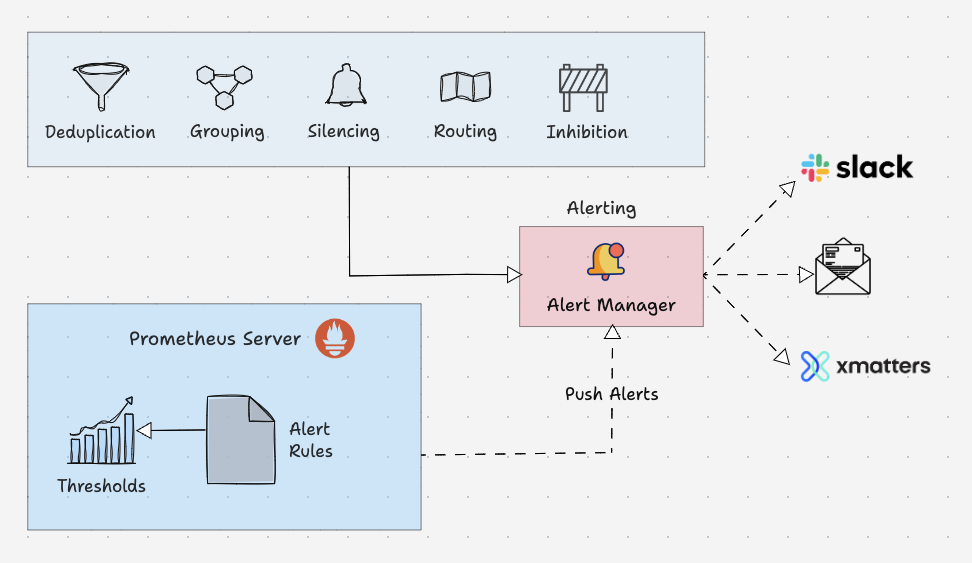
Alert Manager는 Prometheus에서 생성된 알림(Alert)을 관리하고 적절한 수신자에게 전달하는 도구
Alert Manager의 주요 기능
-
Deduplication (중복 제거)
- 동일한 경고(Alert)가 반복적으로 발생하는 경우 이를 제거하여 불필요한 알림을 방지
-
Grouping (그룹화)
- 관련된 알림을 하나의 그룹으로 묶어 더 효율적으로 전달
-
Silencing (무시)
- 특정 조건(예: 유지보수 중)에서 알림을 무시하도록 설정
-
Routing (라우팅)
- 알림을 적절한 수신자(예: 팀, 채널, 서비스)로 라우팅
-
Inhibition (억제)
- 특정 조건(예: 더 심각한 알림이 이미 발생)에서 덜 중요한 알림을 억제
Alert Manager 동작 흐름
-
Prometheus Server
Alert Rules를 통해 정의된 조건이 만족되면 경고(Alert)를 생성하여 Alert Manager로 전달
-
Alert Manager
- 받은 알림을 중복 제거, 그룹화, 라우팅 등의 처리를 수행
-
알림 전송
- Slack, 이메일, xMatters 등으로 최종 알림 전송
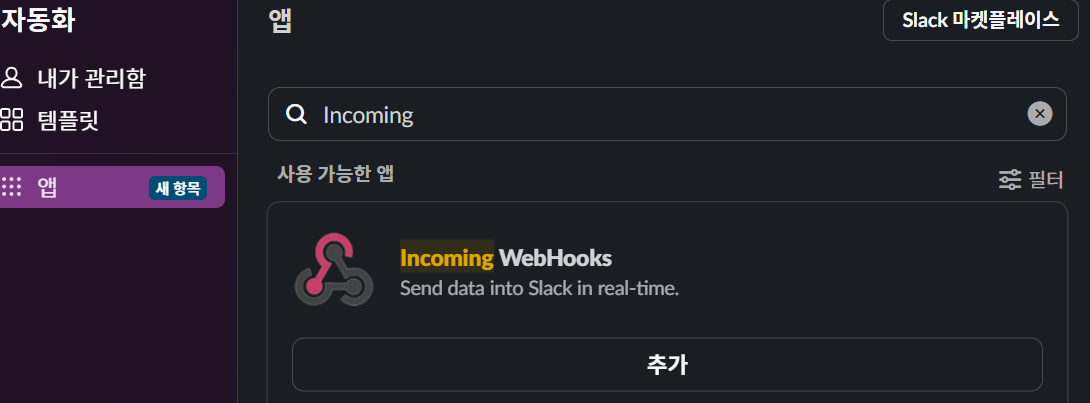 우선 Slack에서
 WebHooks 앱을 추가하여준다.
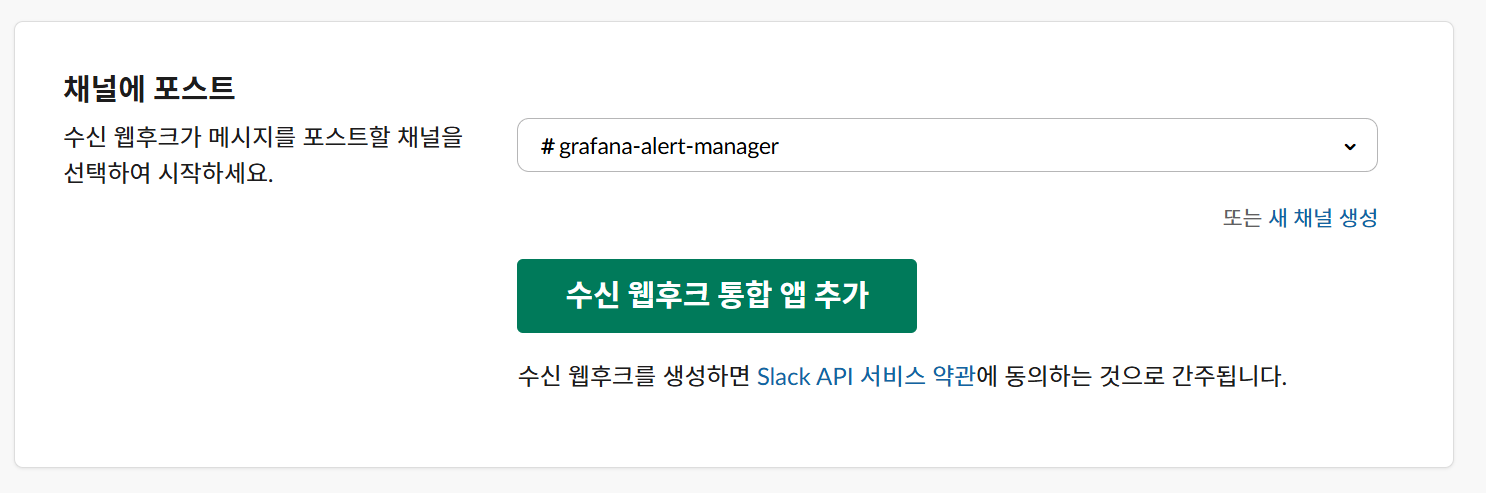 또한 채널을 만들고 이를 설정한 뒤 WebHooks URL을 저장해둔다.
cd /home/ec2-user/
wget https://github.com/prometheus/alertmanager/releases/download/v0.25.0/alertmanager-0.25.0.linux-amd64.tar.gz
tar xvf alertmanager-0.25.0.linux-amd64.tar.gz
이후 위와 같이 alertmanager를 다운로드 받고 압축을 풀어준 뒤
mkdir -p /var/lib/alertmanager
chown -R ec2-user:ec2-user /var/lib/alertmanageralertmanager는 상태 데이터를 저장할 별도 디렉터리가 필요하기 때문에 이를 생성한다.
$ vi /home/ec2-user/alertmanager-0.25.0.linux-amd64/alertmanager.yml

global:
  slack_api_url: 'https://hooks.slack.com/services/XXXXXXXXX/XXXXXXXXX/XXXXXXXXXXXXXXXXXXXXXXXX'
  resolve_timeout: 5m

route:
  group_by: ['alertname']
  group_wait: 30s
  group_interval: 5m
  repeat_interval: 1h
  receiver: 'slack-notifications'

receivers:
  - name: 'slack-notifications'
    slack_configs:
      - channel: "#알림채널"
        title: "{{ .CommonAnnotations.summary }}"
        text: >
          {{ range .Alerts }}
            *Alert:* {{ .Annotations.description }}
            *Instance:* {{ .Labels.instance }}
          {{ end }}

inhibit_rules:
  - source_match:
      severity: 'critical'
    target_match:
      severity: 'warning'
    equal: ['alertname', 'dev', 'instance']
또한 alertmanager.yml 파일을 위와 같이 설정하여준다.
$ vi /etc/systemd/system/alertmanager.service
[Unit]
Description=Prometheus Alertmanager
After=network.target

[Service]
Type=simple
WorkingDirectory=/home/ec2-user/alertmanager-0.25.0.linux-amd64
ExecStart=/home/ec2-user/alertmanager-0.25.0.linux-amd64/alertmanager \
  --config.file=/home/ec2-user/alertmanager-0.25.0.linux-amd64/alertmanager.yml \
  --storage.path=/var/lib/alertmanager \
  --web.listen-address=:9093
Restart=on-failure
User=ec2-user
Group=ec2-user

[Install]
WantedBy=multi-user.target
이후 데몬 서비스 파일을 정의하고
sudo systemctl daemon-reload
sudo systemctl enable alertmanager
sudo systemctl start alertmanager
서비스를 enable한 뒤 실행하면
sudo systemctl status alertmanager
● alertmanager.service - Prometheus Alertmanager
     Loaded: loaded (/etc/systemd/system/alertmanager.service; enabled; preset: disabled)
     Active: active (running) since Sat 2025-02-08 09:24:50 UTC; 2s ago
   Main PID: 8759 (alertmanager)
      Tasks: 6 (limit: 2319)
     Memory: 16.5M
        CPU: 64ms
     CGroup: /system.slice/alertmanager.service
             └─8759 /home/ec2-user/alertmanager-0.25.0.linux-amd64/alertmanager --config.file=/home/ec2-user/a
정상적으로 alertmanager가 실행되는 것을 확인할 수 있으며
$ vi /home/ec2-user/prometheus-3.1.0.linux-amd64/prometheus.yml
...
alerting:
  alertmanagers:
  - static_configs:
    - targets:
      - 'localhost:9093'
prometheus.yml 파일에 alertmanagers의 targets을 추가해주어
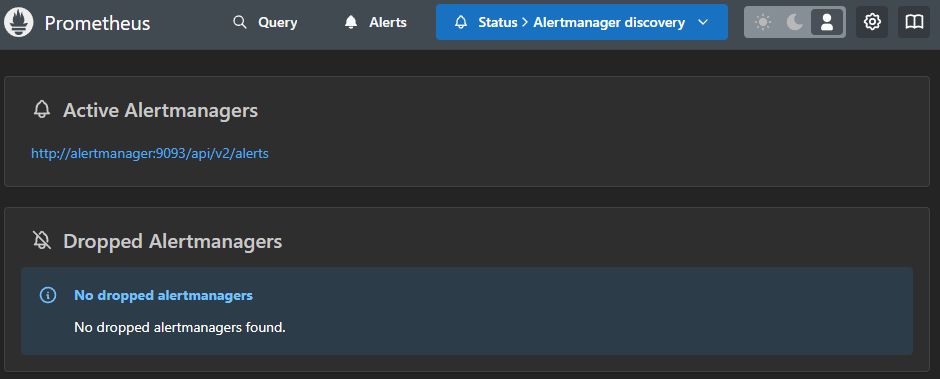 Prometheus에서도 정상적으로 인식되는 것을 볼 수 있다.
journalctl -u alertmanager.service --no-pager --lines=50만약 설치 도중 문제가 발생한다면 위 명령어를 통해 데몬의 로그를 확인할 수 있다.
$ vi /home/ec2-user/prometheus-3.1.0.linux-amd64/rules/node-server-alerts.yml

groups:
  - name: node-server-alerts.yml
    rules:
      - alert: HighMemoryUsage
        expr: (node_memory_MemTotal_bytes - node_memory_MemAvailable_bytes) / node_memory_MemTotal_bytes > 0.9
        for: 2m
        labels:
          severity: critical
        annotations:
          summary: "Memory Usage Critical"
          description: "Memory usage is above 90% for more than 2 minutes. Current value: {{ $value }}"
      - alert: MediumMemoryUsage
        expr: (node_memory_MemTotal_bytes - node_memory_MemAvailable_bytes) / node_memory_MemTotal_bytes > 0.8
        for: 2m
        labels:
          severity: warning
        annotations:
          summary: "Memory Usage Warning"
          description: "Memory usage is above 80% for more than 2 minutes. Current value: {{ $value }}"
또한 이후 /<Prometheus 설치 경로>/rules/node-server-alerts.yml 파일을 생성하여 위와 같이 Memory 사용량에 대한 Rule을 생성해주고
$ vi /home/ec2-user/prometheus-3.1.0.linux-amd64/prometheus.yml
...
rule_files:
- "rules/node-server-alerts.yml"prometheus.yml에 alert_rules.yml 파일을 추가해서 Prometheus가 경고 Rule을 읽을 수 있게 한다.
sudo systemctl restart prometheus이후 Prometheus 서비스를 재시작하면
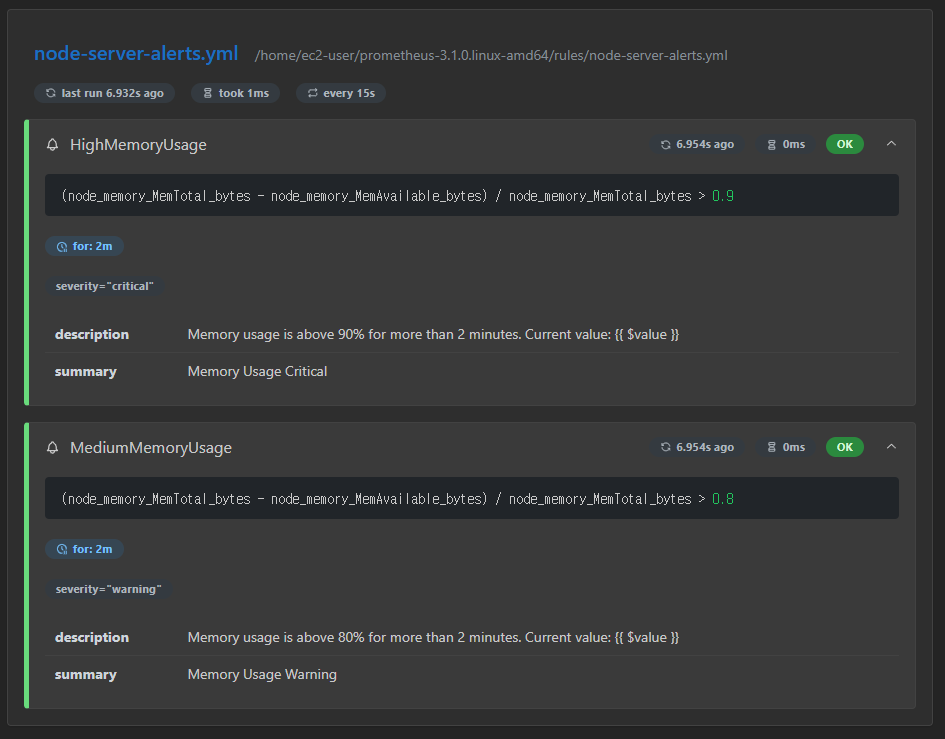 정상적으로 Rule이 생성된 모습을 볼 수 있다.
Grafana Configuration
sudo yum install -y https://dl.grafana.com/oss/release/grafana-11.5.1-1.x86_64.rpmsudo systemctl enable grafana-server
sudo systemctl start grafana-server$ sudo systemctl status grafana-server
● grafana-server.service - Grafana instance
Loaded: loaded (/usr/lib/systemd/system/grafana-server.service; disabled; preset: disabled)
Active: active (running) since Sat 2025-02-08 08:20:37 UTC; 3s ago
Docs: http://docs.grafana.org
Main PID: 6011 (grafana)
Tasks: 7 (limit: 2319)
Memory: 94.4M
CPU: 2.735s
CGroup: /system.slice/grafana-server.service
└─6011 /usr/share/grafana/bin/grafana server --config=/etc/grafana/grafana.ini --pidfile=/var/runGrafana의 경우 Prometheus보다 더 간단하게 위와 같이 설치를 진행한다.
$ curl -u admin:admin http://localhost:3000/api/health
{
  "database": "ok",
  "version": "11.5.1",
  "commit": "c6c701cf5be984b088b9d51690b474ab63ca86ff"
}
이후 localhost로의 접근이 정상적으로 동작하는지 확인한 후
$ vi /etc/grafana/grafana.ini
...
[server]
http_addr = 0.0.0.0 # 외부에서도 접근 가능하도록 설정grafana.ini의 http_addr를 설정해 외부에서도 접근 가능하도록 설정한다.
 이후 브라우저를 통해 접근할 수 있으며 기본 아이디와 비밀번호는
 admin이다.
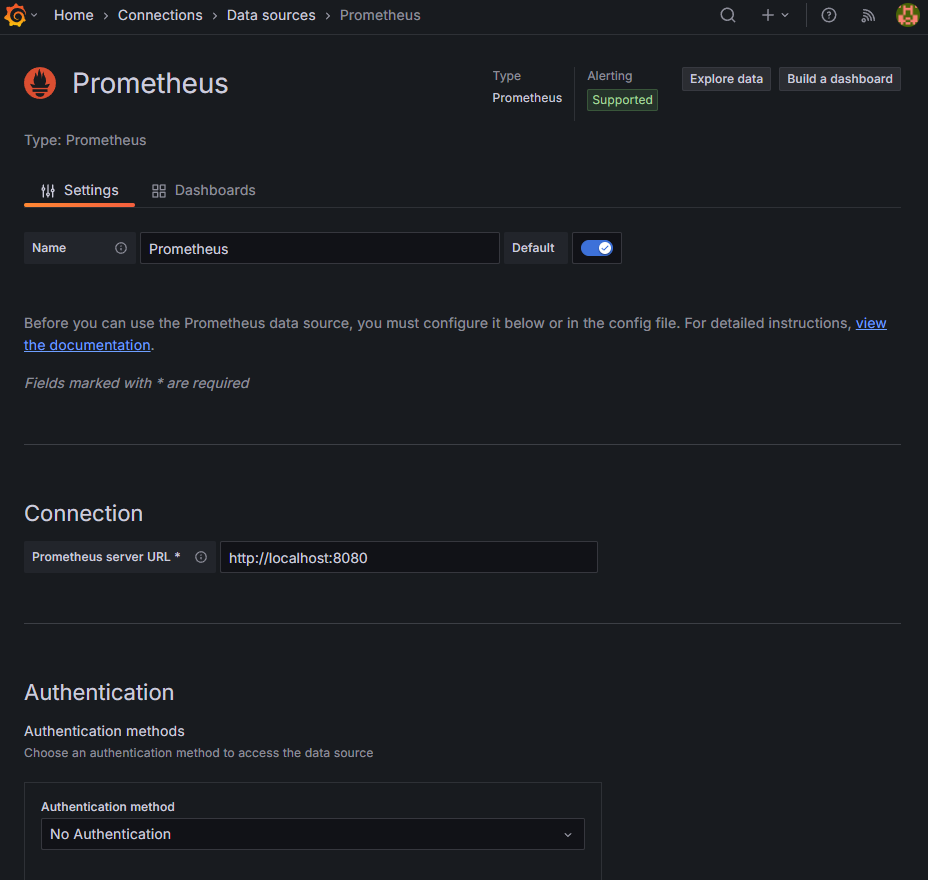
Configuration → Data sources → Add DataSource → Prometheus로 Http URL만 설정해준뒤 Save and test를 눌러서 확인한다.
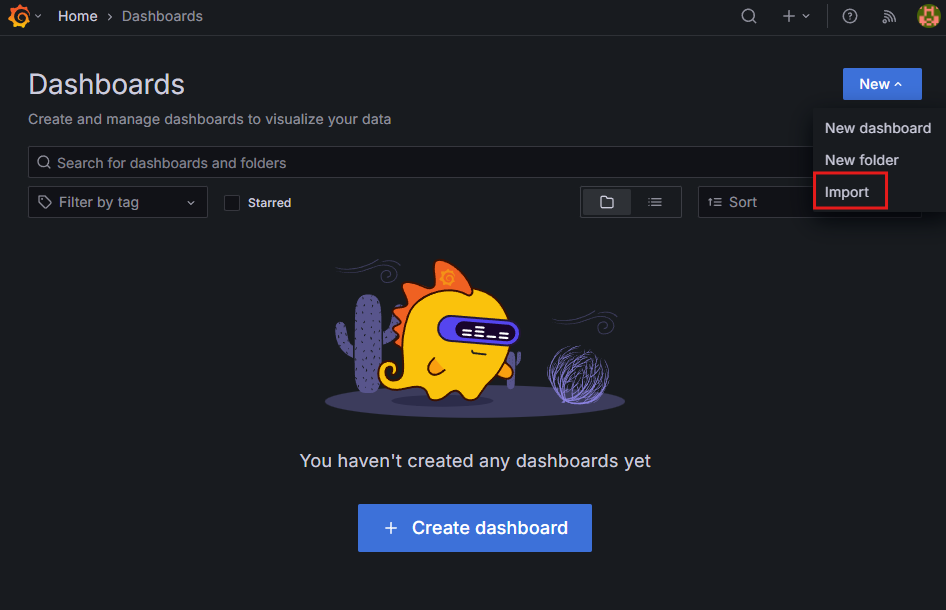 이후 Dashboard를 구성할 수 있는데, 추천되는 Import ID는 아래와 같다.
| Import ID | 이름 | 설명 |
|---|---|---|
| 1860 | Node Exporter Full | CPU, 메모리, 디스크, 네트워크 등 전체적인 노드 성능 모니터링 |
| 11074 | Node Exporter for Prometheus | Kubernetes 및 일반 서버용 최적화된 노드 모니터링 대시보드 |
| 13978 | Linux Node Dashboard | Linux 기반 서버를 위한 심플한 Node Exporter 대시보드 |
| 405 | Node Exporter Server Metrics | CPU, Memory, Disk I/O, Network 등의 노드 상태 모니터링 |
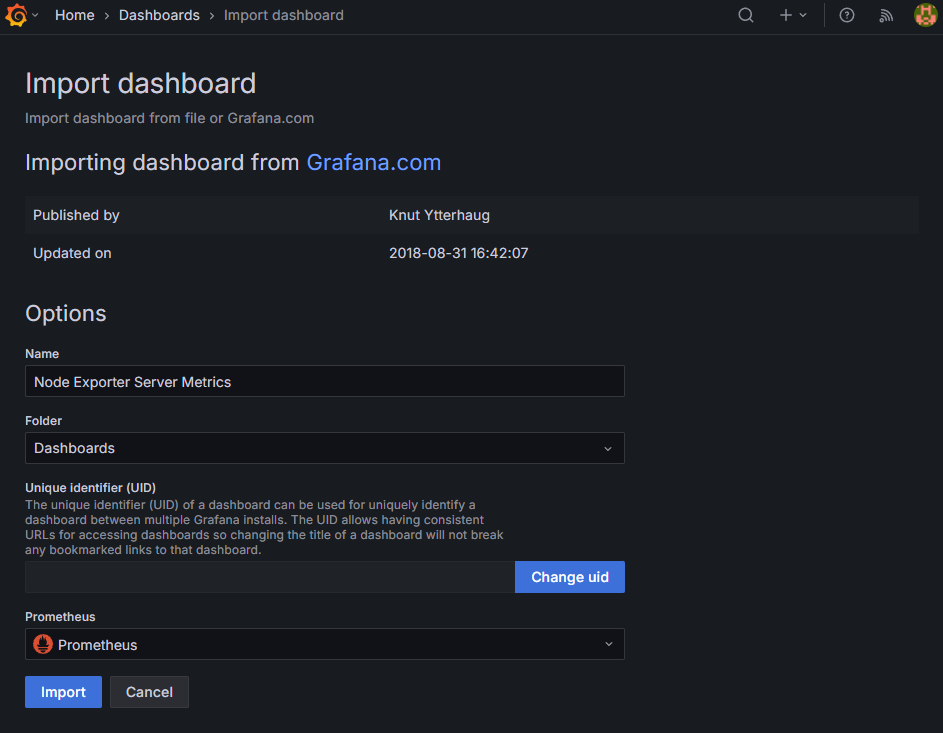 이후 Prometheus Source를 지정해주면
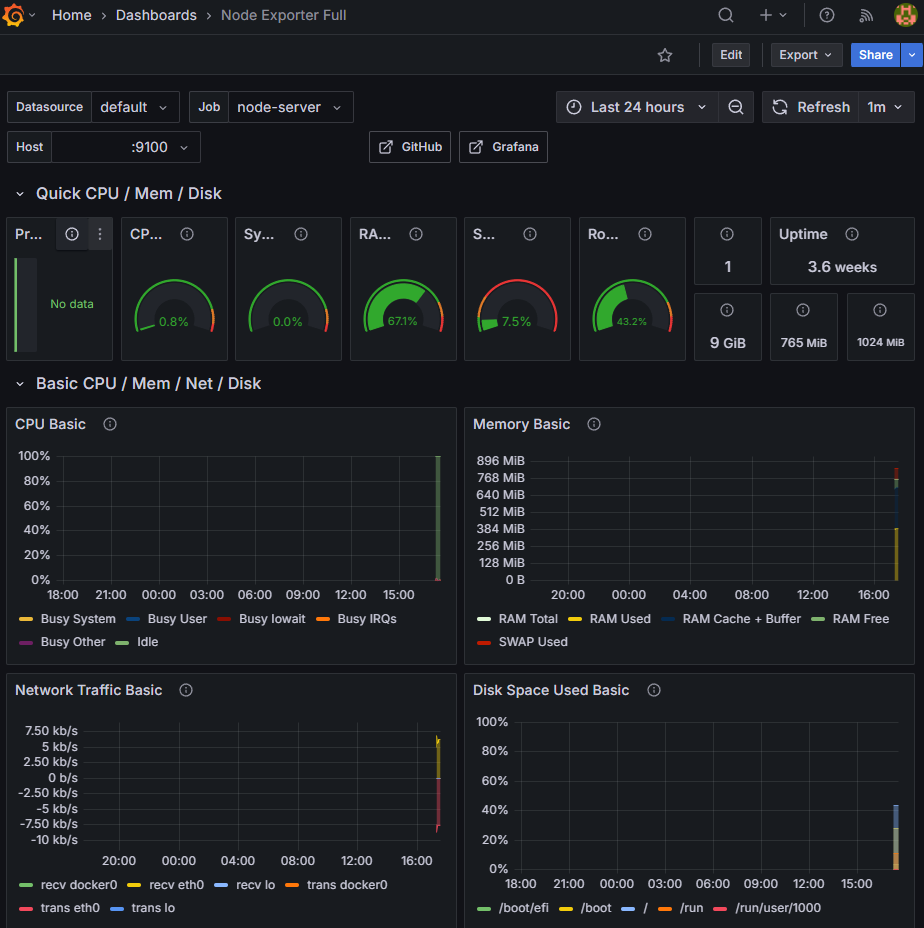 Grafana를 통해 EC2 인스턴스의 상태를 확인할 수 있다.
Stress Test
sudo subscription-manager register --auto-attach
sudo dnf install -y https://dl.fedoraproject.org/pub/epel/epel-release-latest-9.noarch.rpm
sudo dnf install -y stress
부하 테스트를 진행하기 위하여 위와 같이 stress 라이브러리를 생성해주고
$ stress --vm 1 --vm-bytes 700M --timeout 180s
stress: info: [149503] dispatching hogs: 0 cpu, 0 io, 1 vm, 0 hd
총 3분동안 700M의 메모리를 사용하도록 임의의 프로세스를 생성하고 경과를 지켜보았다.
vm: 메모리 부하를 생성할 프로세스 개수vm-bytes: 각 프로세스가 사용할 메모리 크기timeout: 특정한 시간동안 실행 후 종료
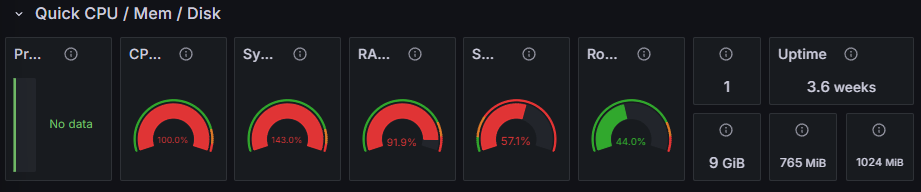 이후 Grafana에서 시스템의 점유율이 모두 빨간색인 것을 확인할 수 있었으며
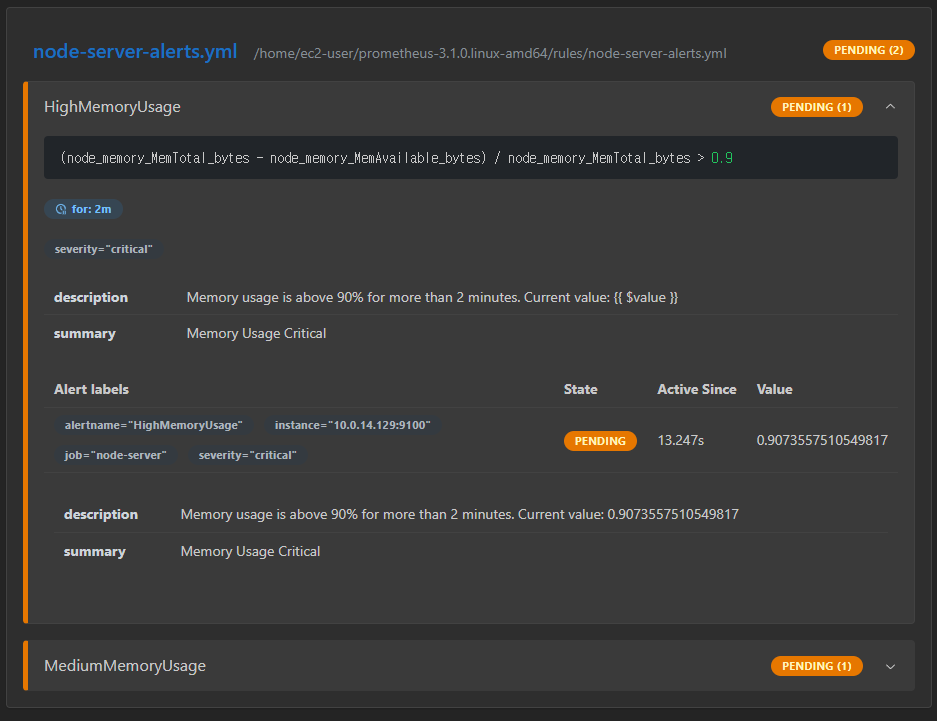 Prometheus의
 Rule Health 탭에서 위와 같이 PENDING 상태임을 확인할 수 있었다.
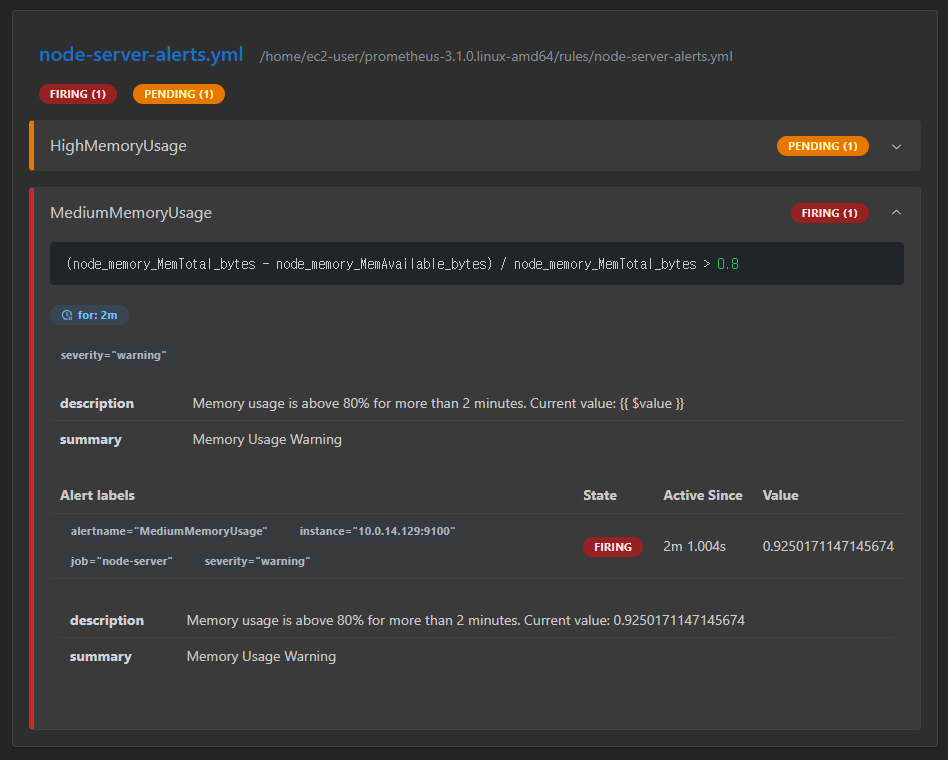 2분이 경과되고 Prometheus의
 Medium Memory Usage가 FIRING 상태로 전환되었고
[
  {
    "annotations": {
      "description": "Memory usage is above 80% for more than 2 minutes. Current value: 0.900198224156781",
      "summary": "Memory Usage Warning"
    },
    "endsAt": "2025-02-08T11:20:56.051Z",
    "fingerprint": "eb582d29cd476696",
    "receivers": [
      {
        "name": "slack-notifications"
      }
    ],
    "startsAt": "2025-02-08T11:11:26.051Z",
    "status": {
      "inhibitedBy": [],
      "silencedBy": [],
      "state": "active"
    },
    "updatedAt": "2025-02-08T11:16:56.053Z",
...localhost:9093/api/v2/alerts에서 위와 같이 현재 활성화된 alert를 확인할 수 있었으며
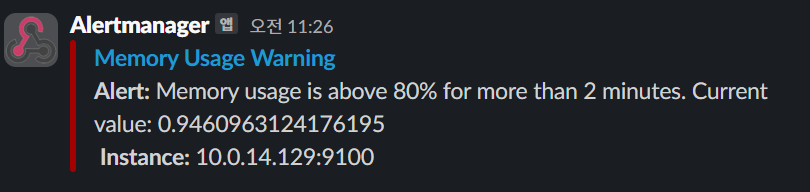 Alertmanager로부터의 메세지가 정상적으로 Slack WebHook를 통해 도달하는 것을 확인하였다.