
원형그래프 Pie Chart
- 진행하는 프로젝트에 원형그래프가 사용되어 사용법을 익힐겸 프로젝트에 적합한 그래프를 찾아보고자 한다.
Pie Chart 라이브러리
1. AnyChart Android
다양한 차트 유형을 제공하는 JavaScript 차트 라이브러리이며, Android용 라이브러리도 제공
https://github.com/AnyChart/AnyChart-Android/
2. MPAndroidChart
Android용 다양한 차트를 생성할 수 있는 라이브러리이며 다양한 커스텀 옵션을 제공하고 다양한 예제와 문서를 제공
https://github.com/PhilJay/MPAndroidChart
Pie Chart 사용해보기
1. build.gradle 설정
dependencies {
    implementation 'com.github.AnyChart:AnyChart-Android:1.1.5'
    implementation 'com.github.PhilJay:MPAndroidChart:v3.1.0'
}
2. Layout file 설정
- AnyChart
com.anychart.AnyChartView - MPChart
com.github.mikephil.charting.charts.PieChart
fragment_chart.xml

     <TextView
        android:id="@+id/anychartCarbohydrates"
        android:layout_width="wrap_content"
        android:layout_height="wrap_content"
        android:text="탄수화물"
        android:textColor="@color/white"
        android:textSize="24sp"
        app:layout_constraintBottom_toTopOf="@id/anychartText"
        app:layout_constraintEnd_toEndOf="@id/anychartText"
        app:layout_constraintStart_toStartOf="@id/anychartText" />

    <TextView
        android:id="@+id/anychartText"
        android:layout_width="wrap_content"
        android:layout_height="wrap_content"
        android:text="섭취량"
        android:textColor="@color/white"
        app:layout_constraintBottom_toBottomOf="@id/anyChartView"
        app:layout_constraintEnd_toEndOf="@id/anyChartView"
        app:layout_constraintStart_toStartOf="@id/anyChartView"
        app:layout_constraintTop_toTopOf="@id/anyChartView" />

    <com.anychart.AnyChartView
        android:id="@+id/anyChartView"
        android:layout_width="300dp"
        android:layout_height="300dp"
        app:layout_constraintEnd_toEndOf="parent"
        app:layout_constraintStart_toStartOf="parent"
        app:layout_constraintTop_toBottomOf="@+id/textView1" />

    <TextView
        android:id="@+id/textView1"
        android:layout_width="wrap_content"
        android:layout_height="wrap_content"
        android:layout_marginTop="40dp"
        android:text="Anychart"
        app:layout_constraintBottom_toTopOf="@+id/anyChartView"
        app:layout_constraintEnd_toEndOf="parent"
        app:layout_constraintStart_toStartOf="parent"
        app:layout_constraintTop_toTopOf="parent" />

    <com.github.mikephil.charting.charts.PieChart
        android:id="@+id/MPpieChart"
        android:layout_width="300dp"
        android:layout_height="300dp"
        android:layout_marginTop="24dp"
        app:layout_constraintEnd_toEndOf="parent"
        app:layout_constraintStart_toStartOf="parent"
        app:layout_constraintTop_toBottomOf="@+id/textView2" />

    <TextView
        android:id="@+id/textView2"
        android:layout_width="wrap_content"
        android:layout_height="wrap_content"
        android:layout_marginTop="32dp"
        android:text="MPchart"
        app:layout_constraintEnd_toEndOf="parent"
        app:layout_constraintStart_toStartOf="parent"
        app:layout_constraintTop_toBottomOf="@+id/anyChartView" />
3. Chart 설정
- 사용한 속성은 주석으로 남겼으며, 그 외 속성은 Git에서 확인
        // 탄수화물 권장 섭취량
        val recommendCarbohydrates = 200f
        // 탄수화물 섭취량
        val intakeCarbohydrates = 130f

        // 그래프에 나타낼 데이터
        val dataAnychart = mutableListOf<DataEntry>()
        dataAnychart.add(ValueDataEntry("현재 섭취량", intakeCarbohydrates))
        dataAnychart.add(ValueDataEntry("남은 섭취량", recommendCarbohydrates - intakeCarbohydrates))

        // 그래프 색상(데이터 순서)
        val fillColors = arrayOf<String>(
            "#50A56F",
            "#D2D1D4"
        )

        // AnyChart의 Pie차트 생성
        val anyPieChart = AnyChart.pie()
        // 데이터 설정
        anyPieChart.data(dataAnychart)
        // 라벨, 범례,크레딧 텍스트 비활성화
        anyPieChart.labels(false)
        anyPieChart.legend(false)
        anyPieChart.credits(false)
        // 그래프 색상 설정
        anyPieChart.palette(fillColors)

        fragmentChartBinding.run {
            // 그래프를 화면에 표시
            anyChartView.setChart(anyPieChart)
            // 탄수화물, 섭취현황을 차트위에 표시
            anychartText.bringToFront()
            anychartCarbohydrates.bringToFront()
            anychartText.text =
                String.format("%.1f g / %.1f g", intakeCarbohydrates, recommendCarbohydrates)
        }


        val mpPieChart: PieChart = fragmentChartBinding.MPpieChart

        // 그래프에 나타낼 데이터
        val entries = ArrayList<PieEntry>()
        entries.add(PieEntry(intakeCarbohydrates, "현재 섭취량"))
        entries.add(PieEntry(recommendCarbohydrates - intakeCarbohydrates, "남은 섭취량"))

        // 그래프 색상(데이터 순서)
        val colors = listOf(
            Color.parseColor("#50A56F"),
            Color.parseColor("#D2D1D4")
        )

        // 데이터, 색상, 글자크기 및 색상 설정
        val dataSet = PieDataSet(entries, "")
        dataSet.colors = colors
        dataSet.valueTextSize = 16F
        dataSet.valueTextColor = R.color.black

        // Pie 그래프 생성
        val dataMPchart = PieData(dataSet)
        mpPieChart.data = dataMPchart
        // 중앙 텍스트를 설정하여 섭취량 표시
        mpPieChart.centerText =
            String.format("탄수화물 \n%.1f g / %.1f g", intakeCarbohydrates, recommendCarbohydrates)
        mpPieChart.setCenterTextSize(20f)
        // 범례와 그래프 설명 비활성화
        mpPieChart.legend.isEnabled = false
        mpPieChart.description.isEnabled = false
        // 그래프 업데이트
        mpPieChart.invalidate()
4. 결과
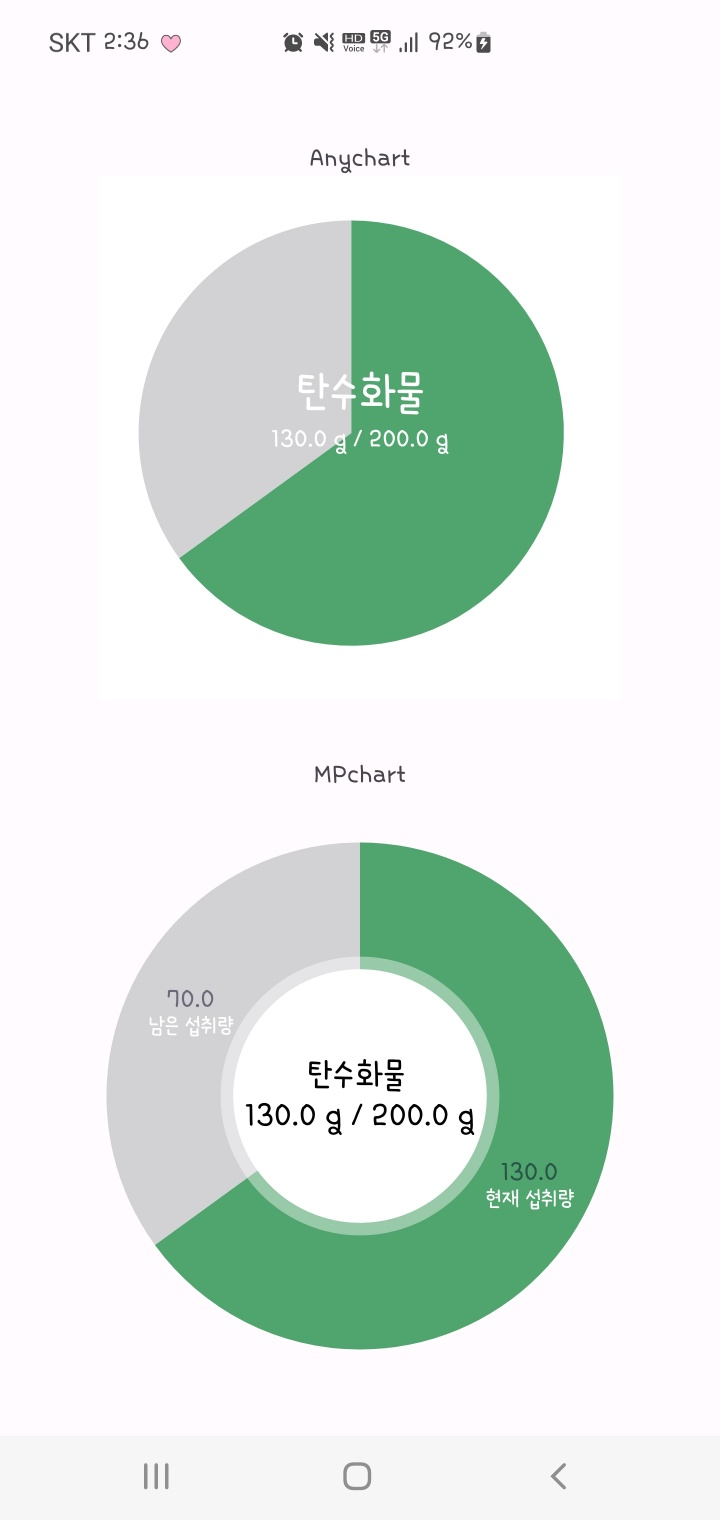
- 범례, 그래프 설명, 라벨 등 활성화 한 결과물
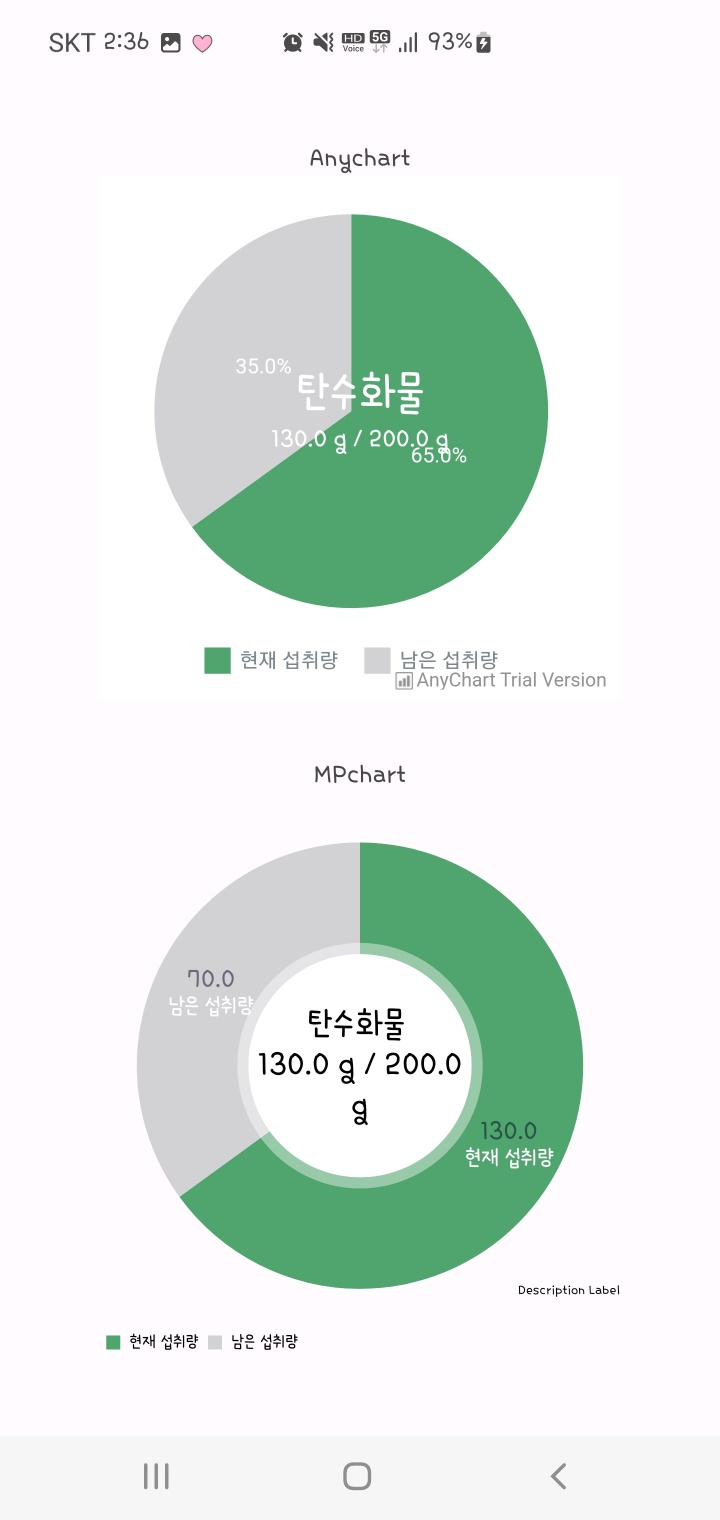
- AnyChart는 MPChart와 다르게 centerText 항목이 없어 TextView를 추가하여 겹쳐놓았다.
- 속성들을 찾아보며 프로젝트에 사용될수 있도록 커스텀 해보자

끝까지 해보자