
서론
이번주차는 카오스 엔지니어링 툴 ChaosMonkey를 사용하는 방법에 대해 알아보자.
ChaosMonkey
Netflix에서 만든 카오스 엔지니어링 툴이다.
카오스엔지니어링 툴 : 프로덕션 환경에서 불확실성을 파악하고 해결방안을 모색하는데 사용하는 툴이다.
불확실성?
- 네트워크 지연
- 서버장애
- 메모리누수
- 디스크 오작동 등
Chaos Monkey spring boot
Spring Boot 에서 사용 가능하다.
https://github.com/codecentric/chaos-monkey-spring-boot
공격대상 : @RestController, @Controller, @Service, @Repository, @Component
공격 유형 : 응답 지연, 예외발생, 애플리케이션 종료, 메모리 누수
설치
Maven
<!--chaos monkey 설치-->
<dependency>
    <groupId>de.codecentric</groupId>
    <artifactId>chaos-monkey-spring-boot</artifactId>
    <version>2.1.1</version>
</dependency>
<!--spring boot 운영에 필요한 기능을 제공해줌-->
<dependency>
    <groupId>org.springframework.boot</groupId>
    <artifactId>spring-boot-starter-actuator</artifactId>
</dependency>
spring-boot-starter-actuator
- 스프링 부트 운영 툴로, 런타임중 chaos monkey 설정을 변경할 수 있다.
- Health check, 매트릭스 데이터 조회 등 다양한 운영 툴로 사용 가능하다.
활성화는 다음과 같이 할 수 있다.
...
spring.profiles.active=chaos-monkey

management.endpoint.chaosmonkey.enabled=true
management.endpoints.web.exposure.include=health,info,chaosmonkey
...
응답지연
- choas monkey watcher 활성화
application properties에 chaos.monkey.watcher.repository=true를 추가한다.
tip. JpaRepository에는 @Repository annotaion이 이미 붙어있다.
애플리케이션을 실행하고 chaos monkey 활성화 여부를 확인할 수 있다.
- 상태확인 : http localhost:8080/actuator/chaosmonkey/status
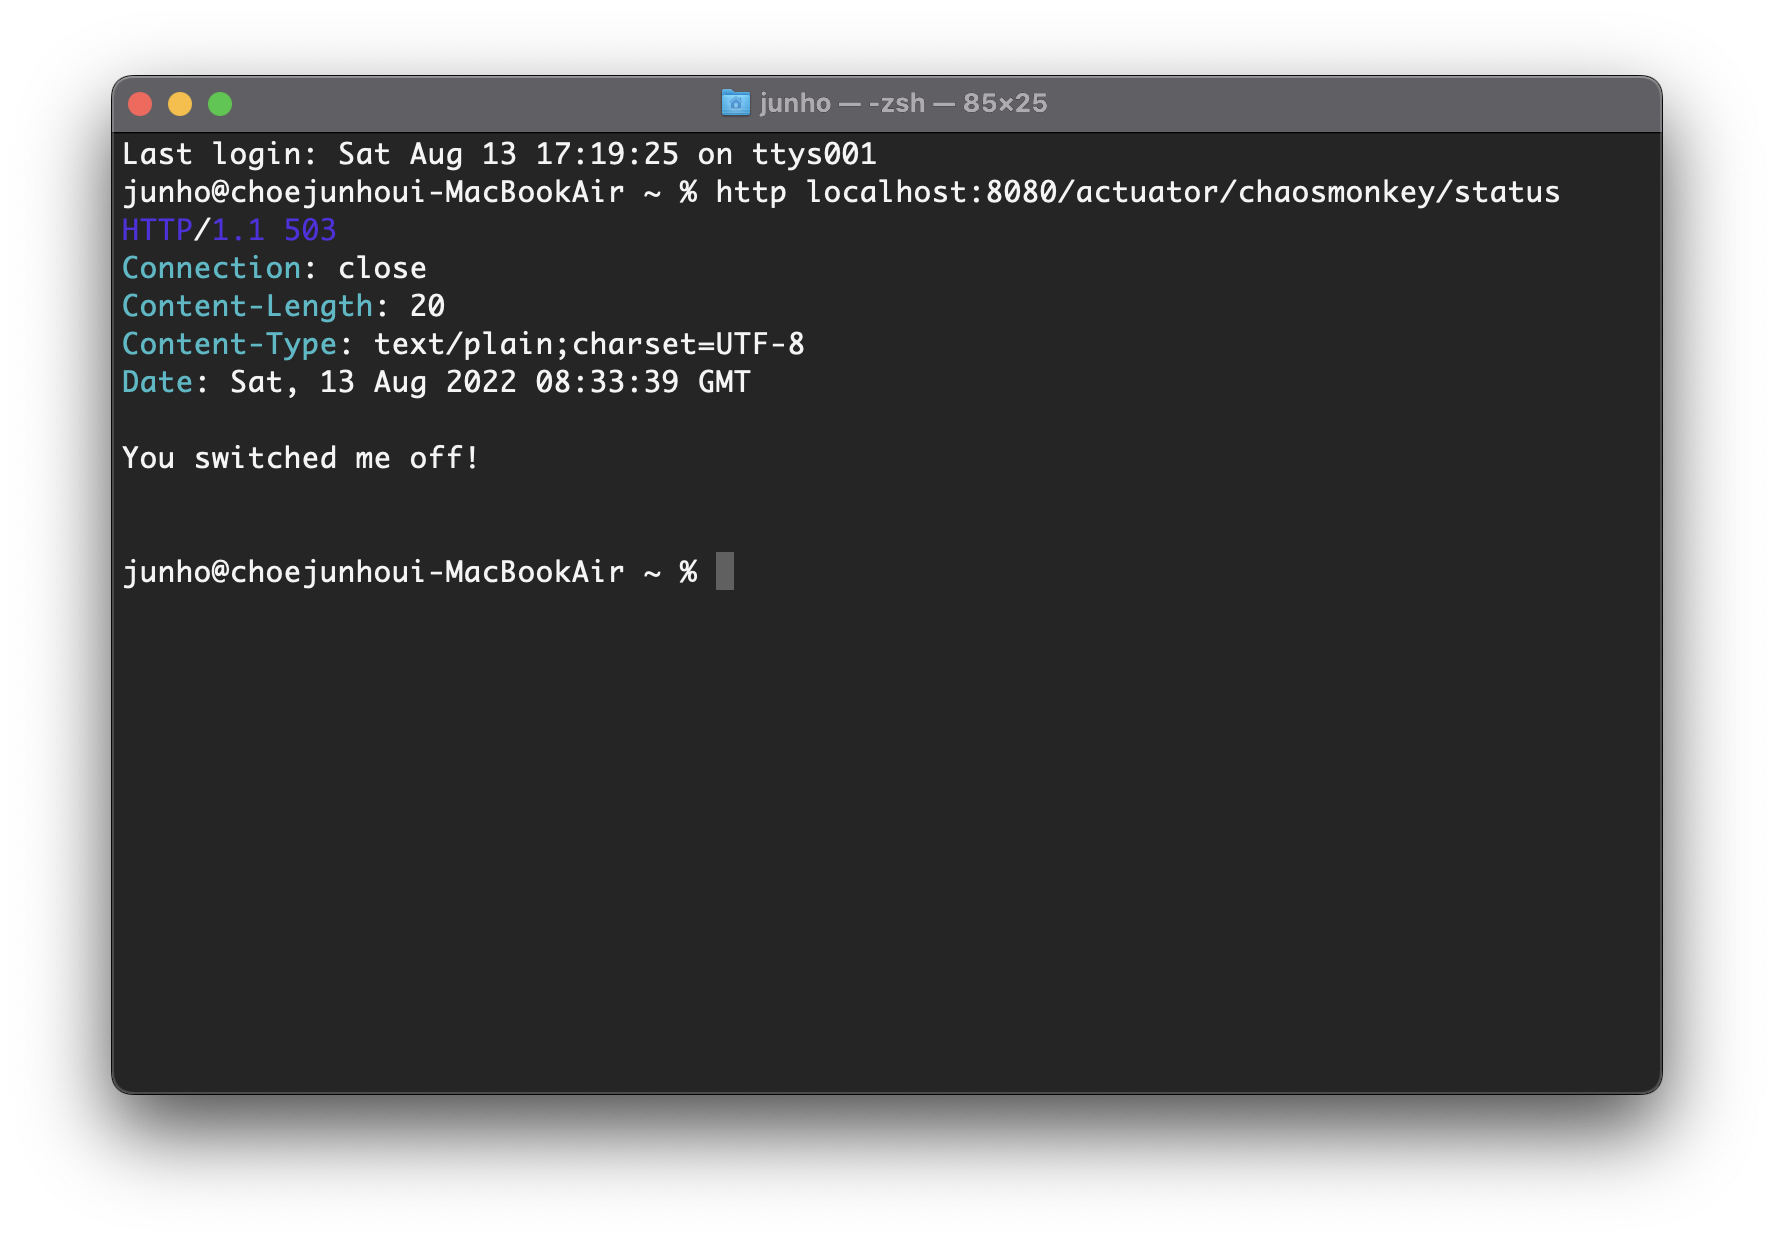
http 명령어를 사용하고싶다면 httpie를 참고하자
-
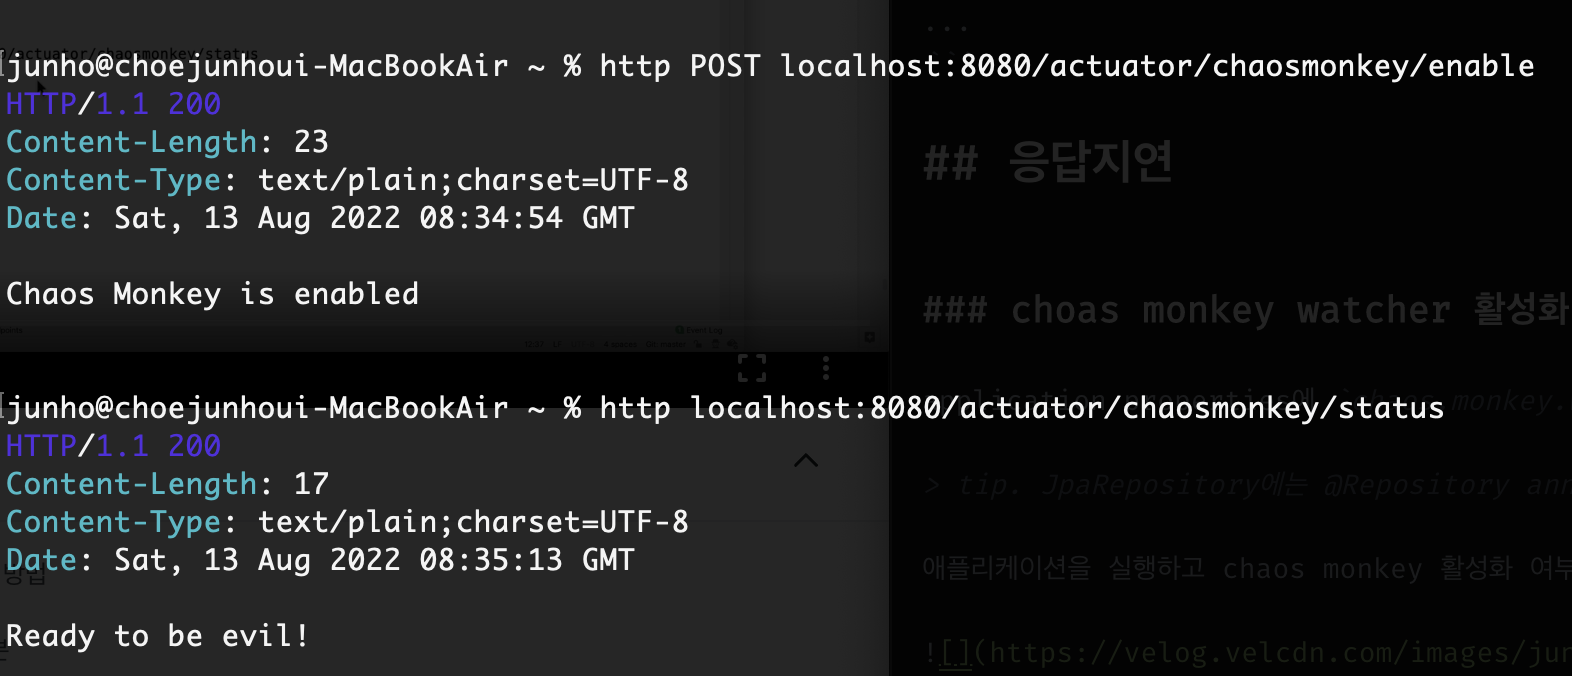
활성화 : http POST localhost:8080/actuator/chaosmonkey/enable
-
watcher 확인 : http localhost:8080/actuator/chaosmonkey/watchers
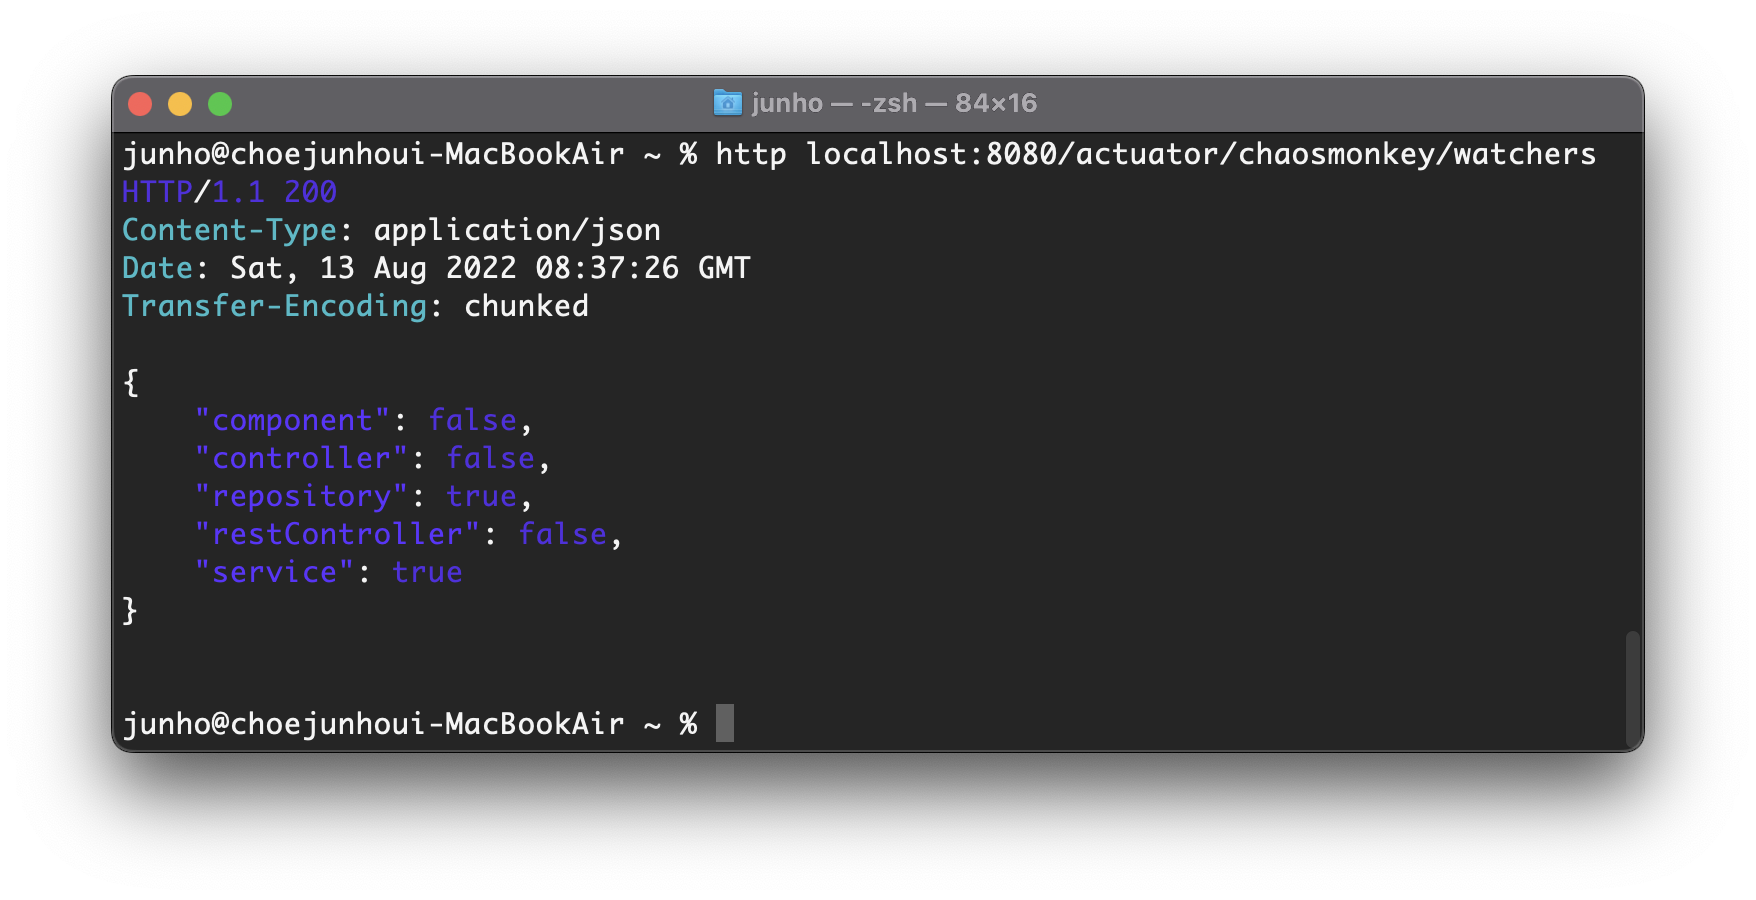
service는 기본적으로 활성화 되어있다.
- watcher 비활성화 : http localhost:8080/actuator/chaosmonkey/watchers service=false
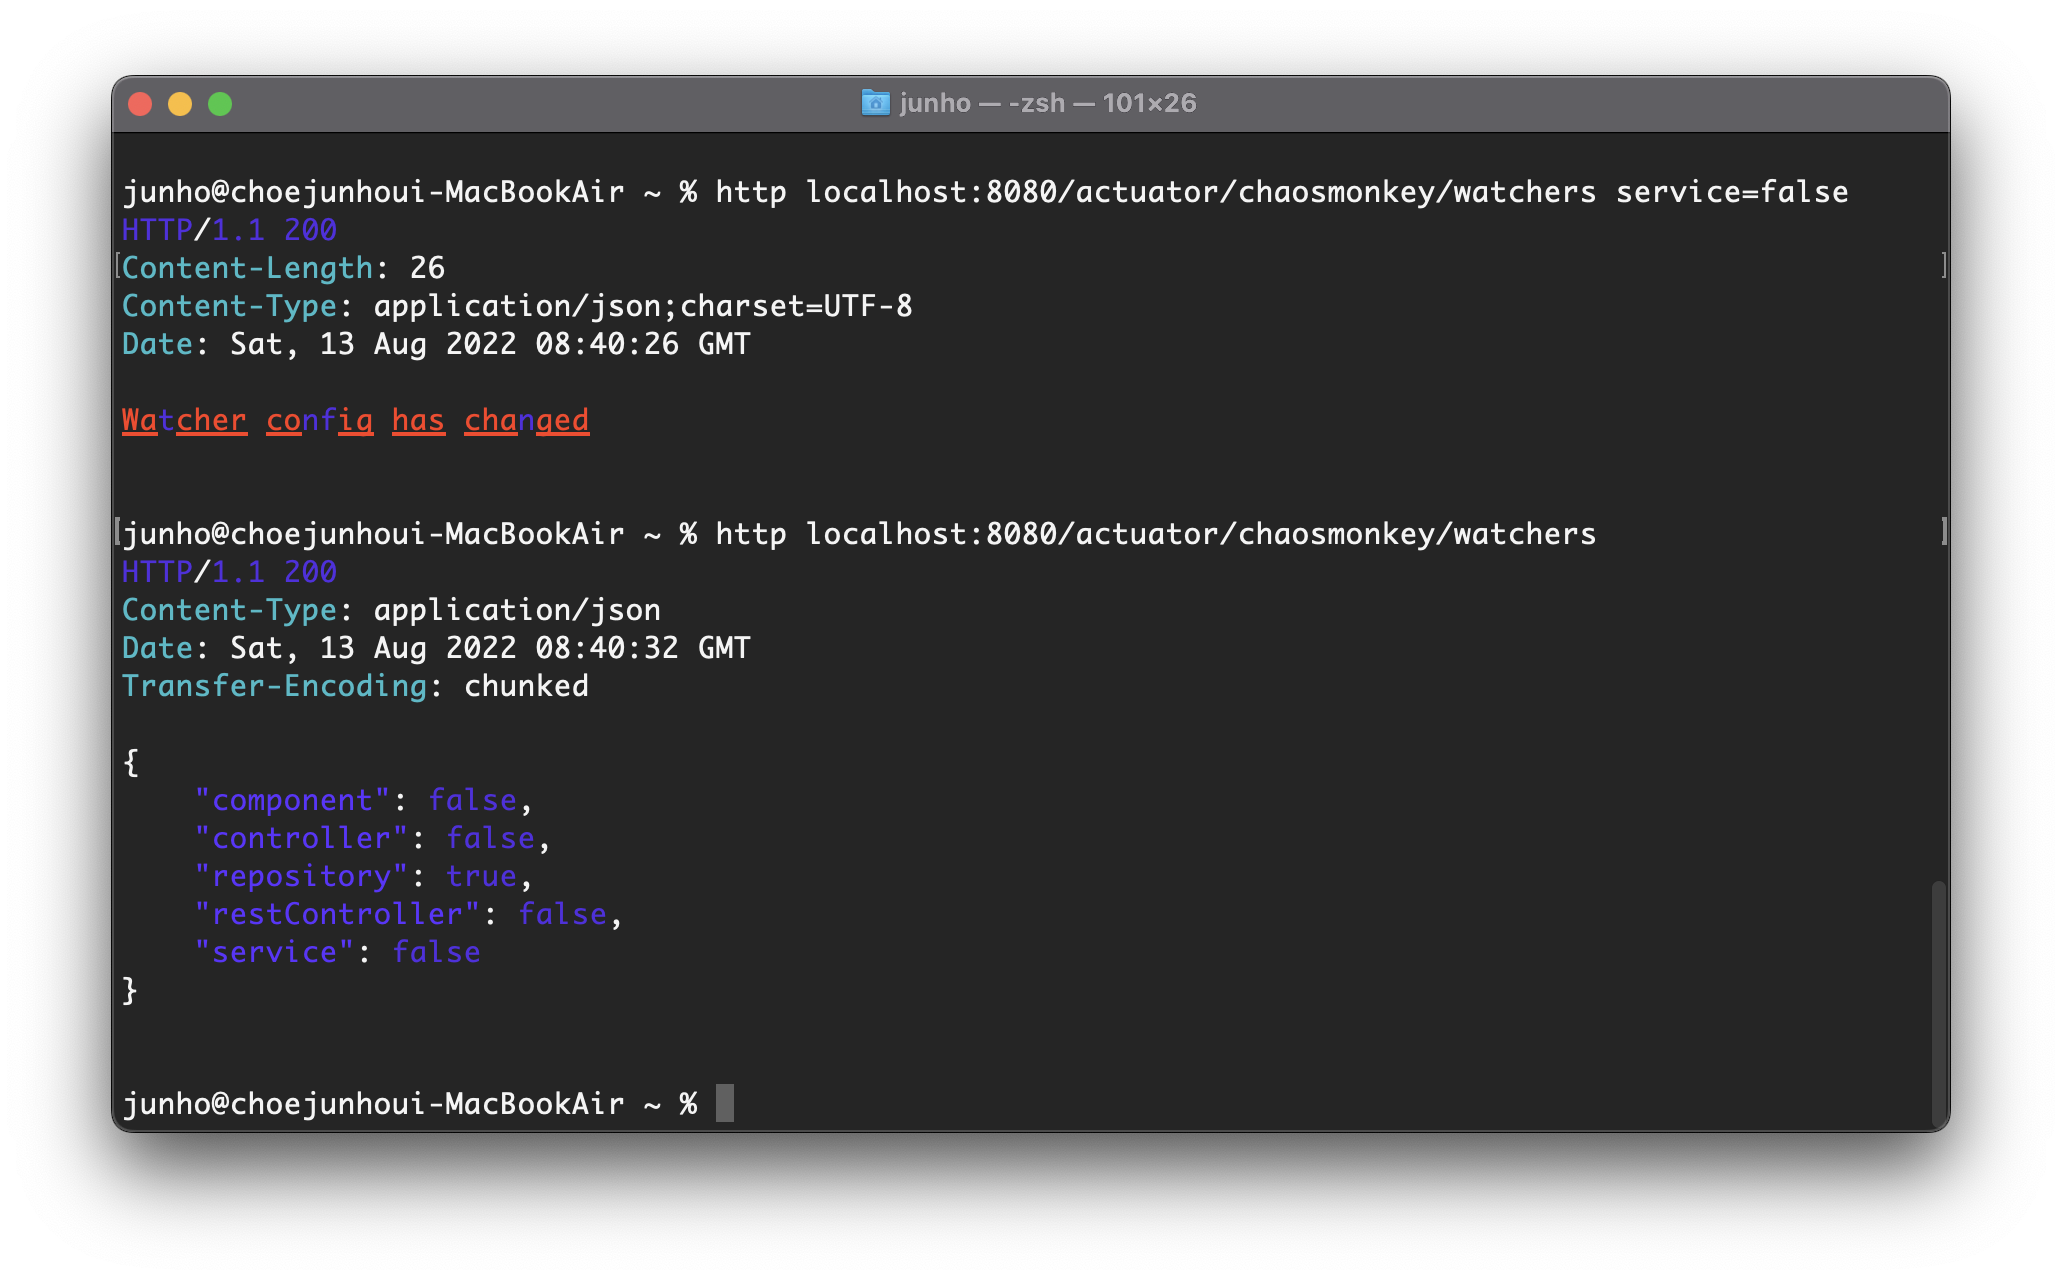
비활성화는 런타임중에 가능하지만 활성화는 Bean 생성 시 AOP를 이용해 프록시로 감싸야하기 때문에 불가능하다.
- 지연공격 설정 : http POST localhost:8080/actuator/chaosmonkey/assaults level=3 latencyRangeStart=2000 latencyRangeEnd=5000 latencyActive=true
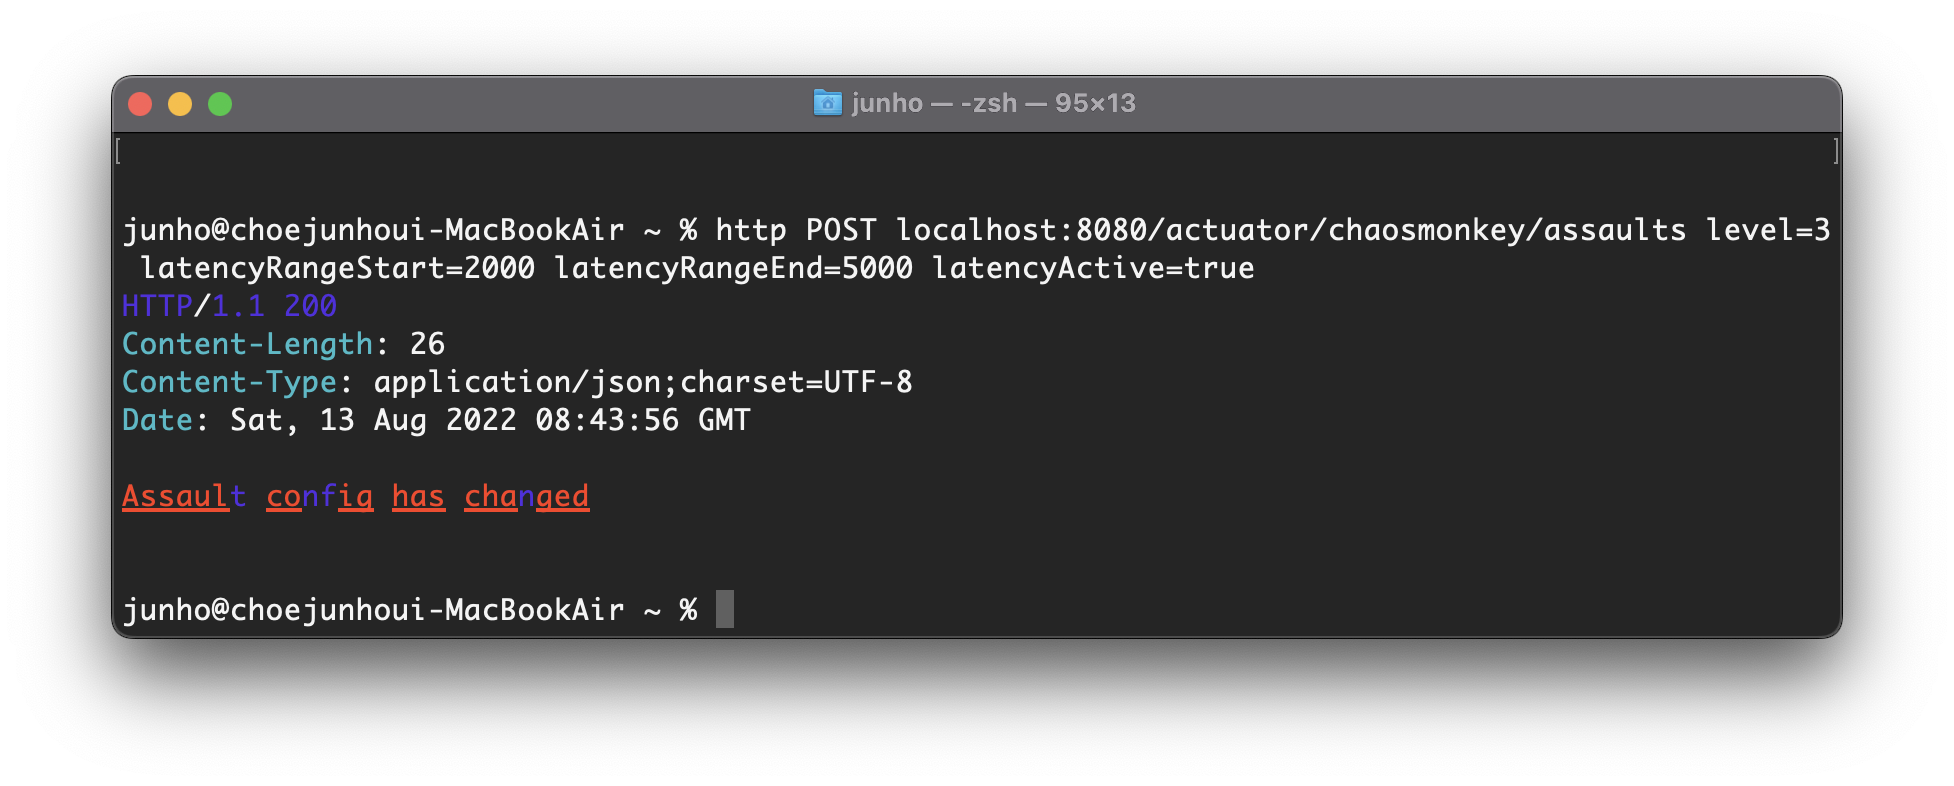
level=n : 요청을 n번 받았을 때 한번 실행
latencyRange : 2초 ~ 5초내로 응답을 지연시킨다.
latencyActive=true : 지연공격 활성화
해당 설정은 properties 파일에서 설정할 수 있다.
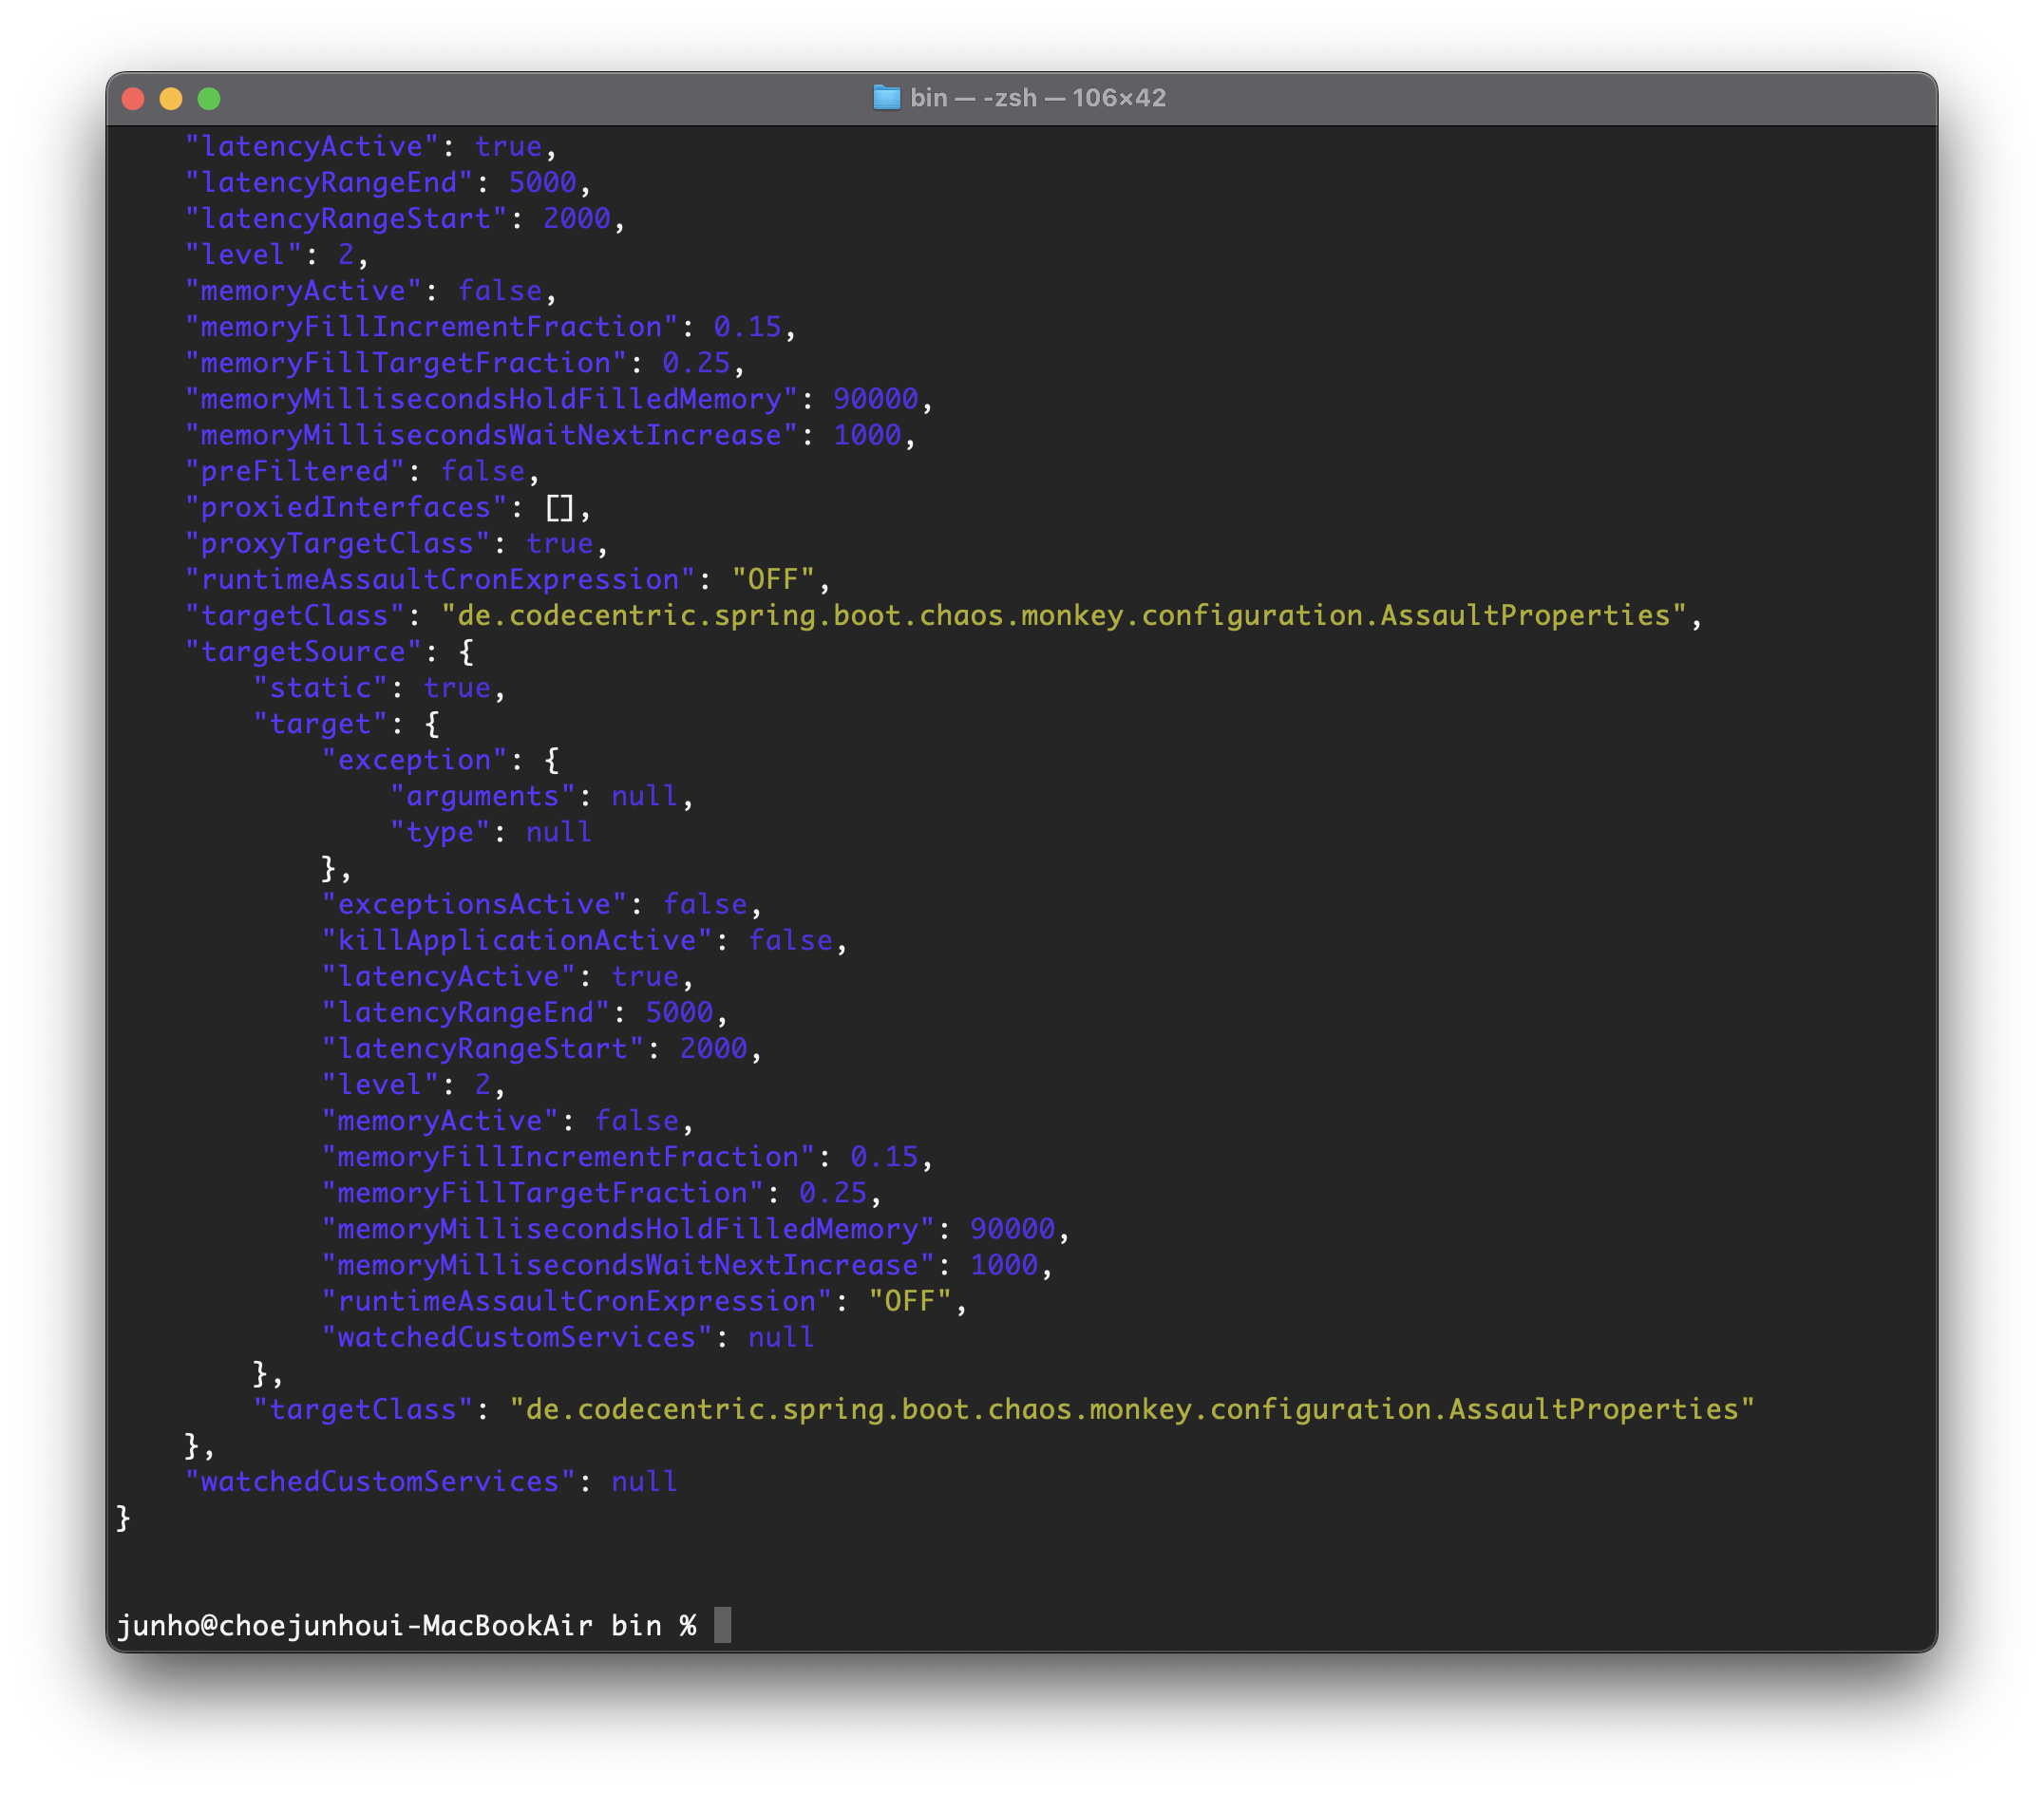
- 공격 활성화 확인 : http localhost:8080/actuator/chaosmonkey/assaults
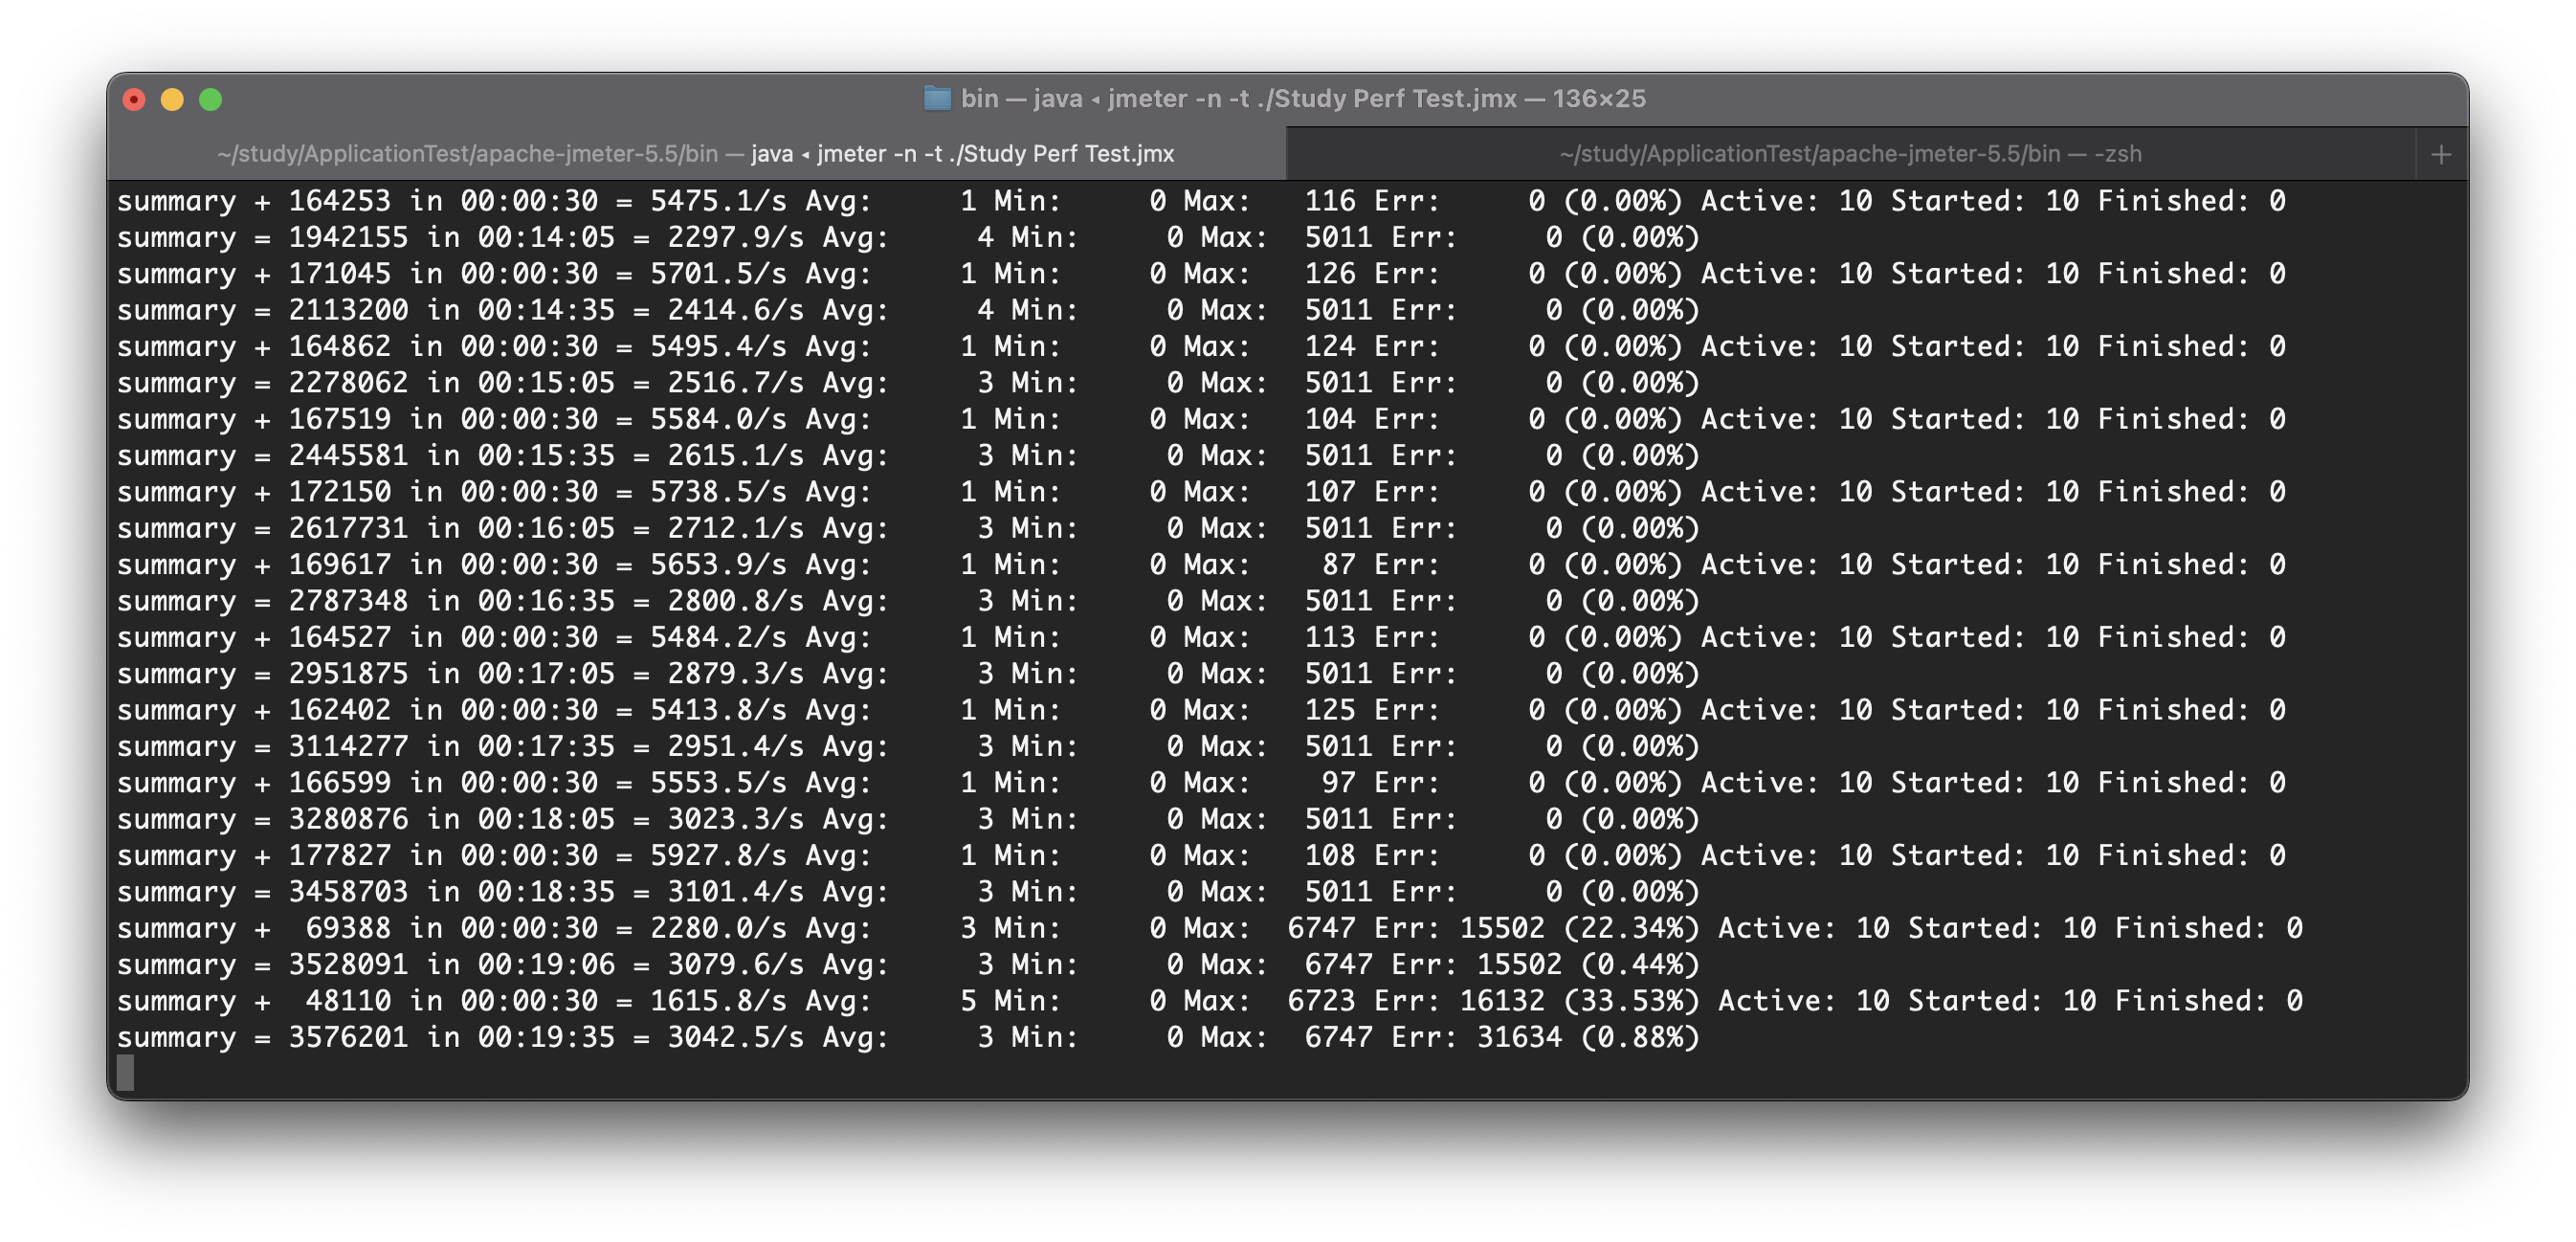
지난 시간에 학습한 JMeter를 이용해 요청 응답시간을 확인해보자.
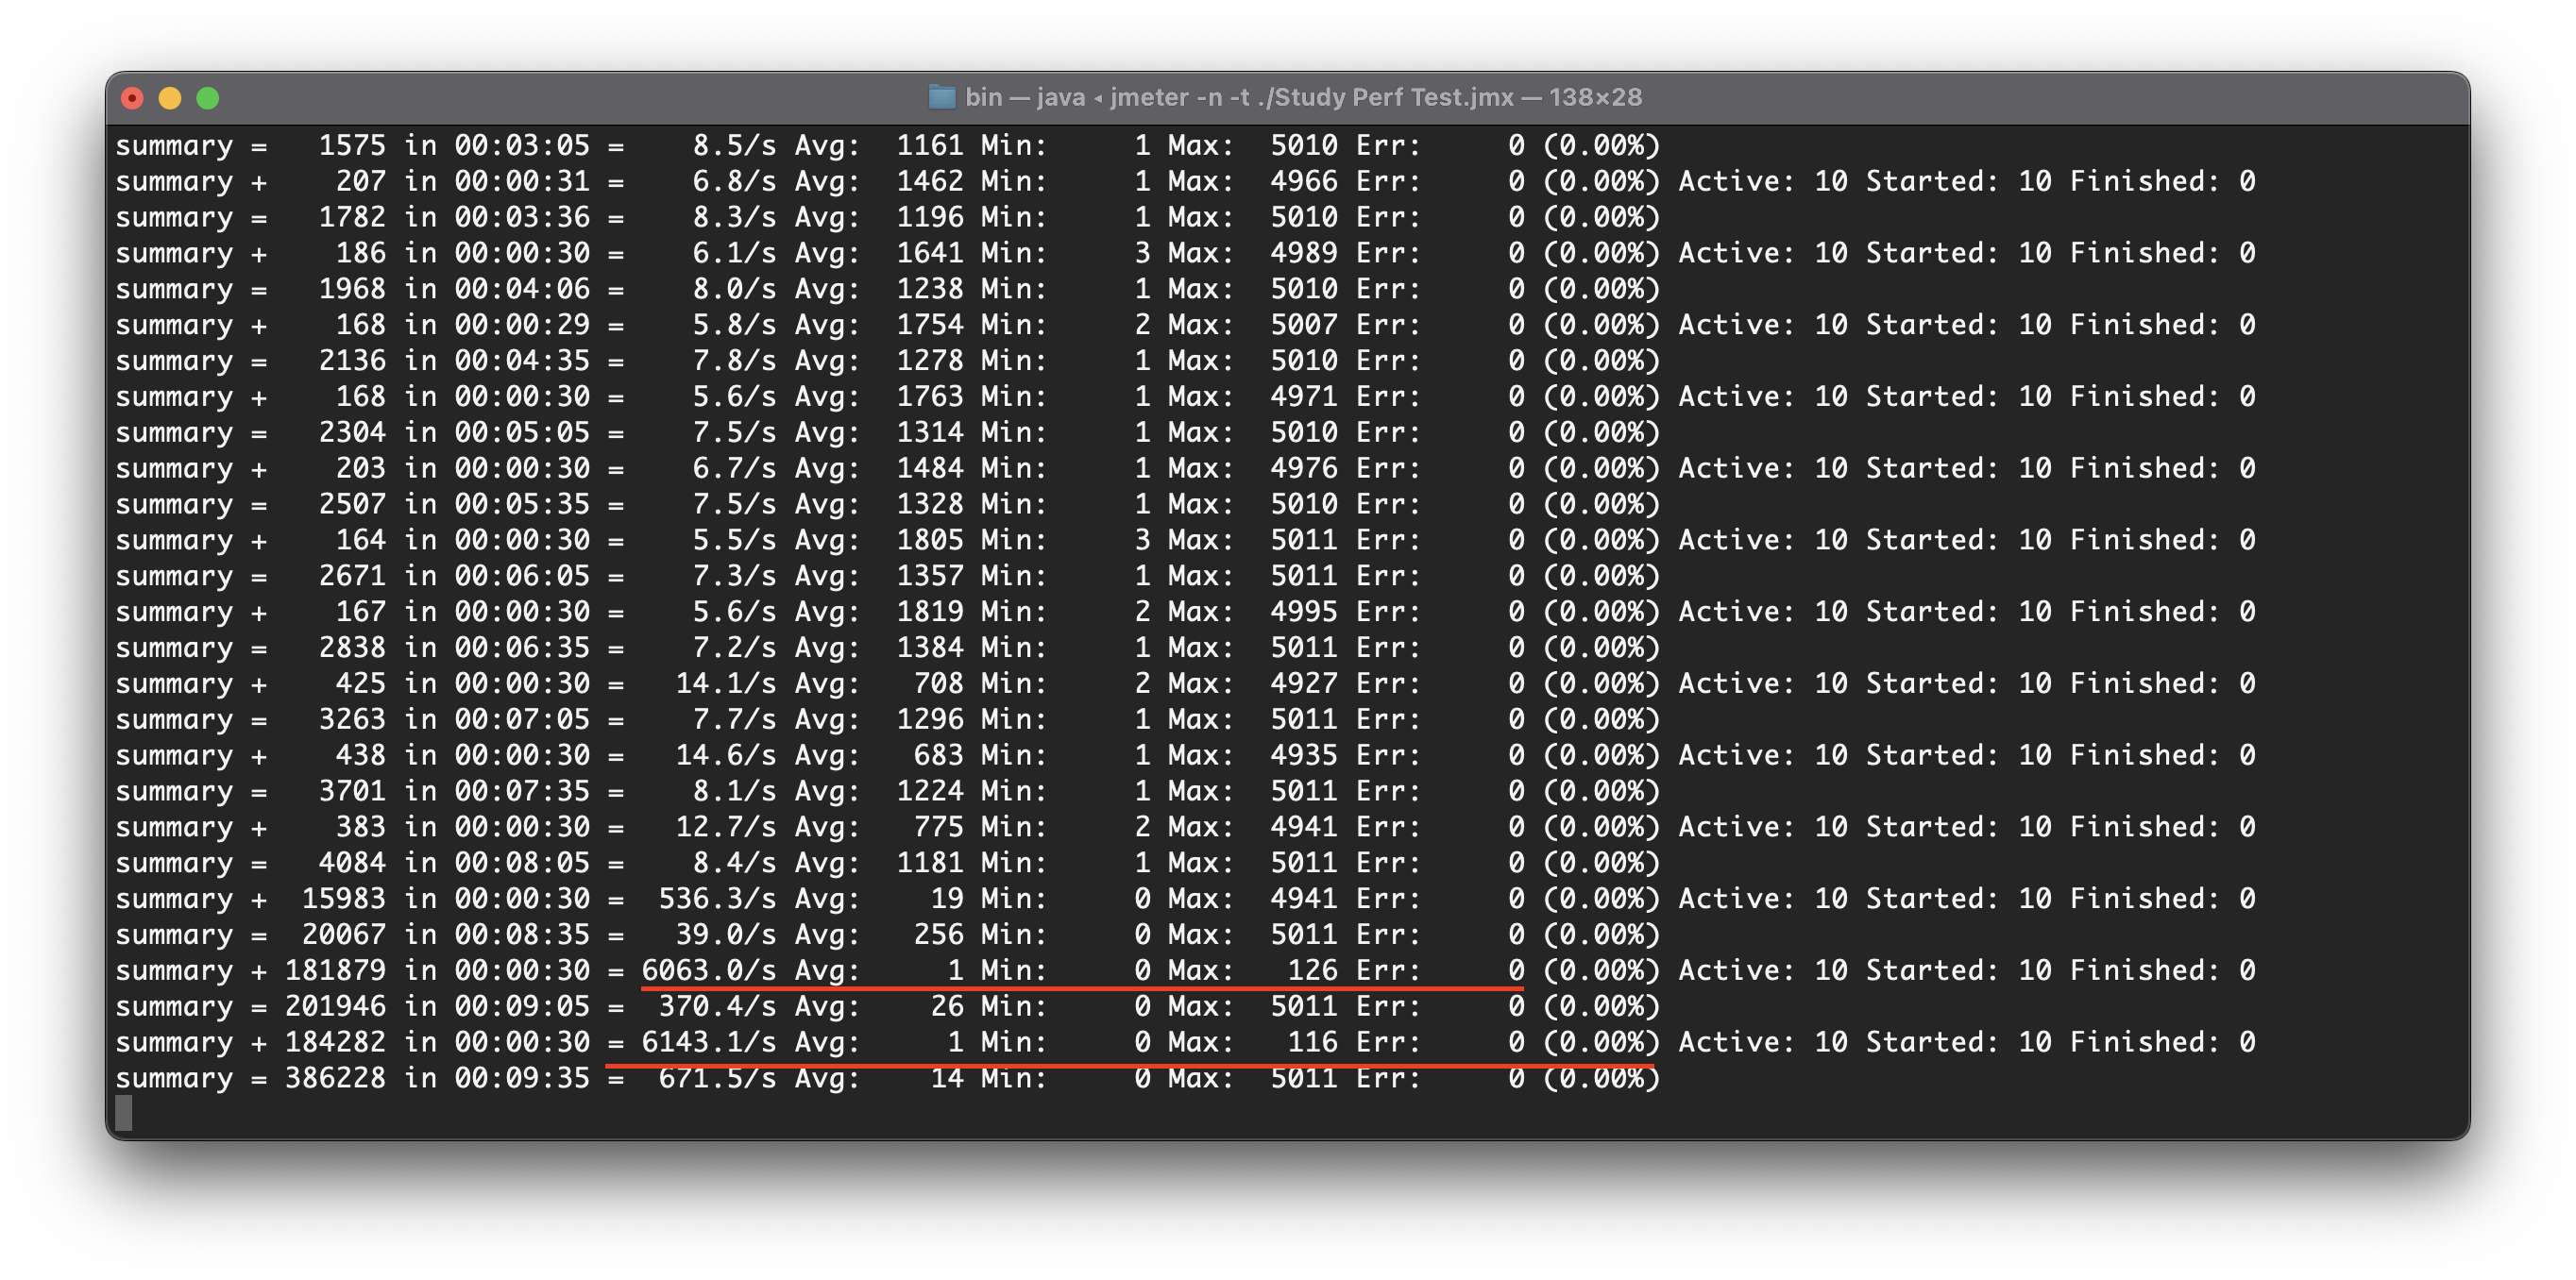
밑줄쳐진 부분은 chaos monkey의 assaults를 종료한 뒤 측정한 값이다.
MAX값 즉 최대 응답시간이 5초가 된것을 통해 지연응답이 적용되었음을 확인할 수 있다.
에러발생
- 에러발생 설정 : http POST localhost:8080/actuator/chaosmonkey/assaults level=3 exceptionsActive=ture exception.type=java.lang.RuntimeException
Reference

신기한게 많네