진행상황
- EKS환경 구축완료
- Prometheus & Grafana 모니터링 세팅 필요
Terraform으로 EKS를 전부 구축하는것을 해보다가 현재 프로젝트에서 우선순위인 모니터링부분을 먼저 하기로함
Prometheus & Grafana 환경 구축
kubectl 확인
### root key 입력 후 로그인
eyestalk1:~/environment $ export AWS_DEFAULT_REGION=ap-northeast-2
eyestalk1:~/environment $ export AWS_ACCESS_KEY_ID=AKIAZ2UUOMJ5C4YOFLUT
eyestalk1:~/environment $ export AWS_SECRET_ACCESS_KEY=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

eyestalk1:~/environment $ kubectl get no
NAME                                             STATUS   ROLES    AGE   VERSION
ip-10-0-18-177.ap-northeast-2.compute.internal   Ready    <none>   42h   v1.23.13-eks-fb459a0
ip-10-0-22-140.ap-northeast-2.compute.internal   Ready    <none>   42h   v1.23.13-eks-fb459a0
ip-10-0-25-194.ap-northeast-2.compute.internal   Ready    <none>   42h   v1.23.13-eks-fb459a0
ip-10-0-28-81.ap-northeast-2.compute.internal    Ready    <none>   42h   v1.23.13-eks-fb459a0
helm 설치
'Kubernetes 패키지 관리'를 도와주는 툴
### helm 설치
eyestalk1:~/environment $ curl -sSL https://raw.githubusercontent.com/helm/helm/master/scripts/get-helm-3 | bash
Downloading https://get.helm.sh/helm-v3.10.2-linux-amd64.tar.gz
Verifying checksum... Done.
Preparing to install helm into /usr/local/bin
helm installed into /usr/local/bin/helm

### helm version 확인
eyestalk1:~/environment $ helm version --short
v3.10.2+g50f003e
메트릭 서버 설치
eyestalk1:~/environment $ kubectl apply -f https://github.com/kubernetes-sigs/metrics-server/releases/latest/download/components.yaml
serviceaccount/metrics-server unchanged
clusterrole.rbac.authorization.k8s.io/system:aggregated-metrics-reader unchanged
clusterrole.rbac.authorization.k8s.io/system:metrics-server unchanged
rolebinding.rbac.authorization.k8s.io/metrics-server-auth-reader unchanged
clusterrolebinding.rbac.authorization.k8s.io/metrics-server:system:auth-delegator unchanged
clusterrolebinding.rbac.authorization.k8s.io/system:metrics-server unchanged
service/metrics-server unchanged
deployment.apps/metrics-server configured
apiservice.apiregistration.k8s.io/v1beta1.metrics.k8s.io unchanged
eyestalk1:~/environment $
설치확인
- Deploy가 뜬 것을 확인 할 수 있다
eyestalk1:~/environment $ kubectl get deployment metrics-server -n kube-system
NAME             READY   UP-TO-DATE   AVAILABLE   AGE
metrics-server 1/1 1 1 21h- cluster의 metric 정보를 확인
kubectl get --raw /metricshelm을 이용한 prometheus 설치
- prometheus namespace 생성 및 helm repo에 prometheus 추가
kubectl create namespace prometheus
helm repo add prometheus-community https://prometheus-community.github.io/helm-charts
Prometheus 설치시 volume 옵션을 해제해줘야함 → 아니면 pendding 상태가 유지됨
eyestalk1:~/environment $ helm upgrade -i prometheus prometheus-community/prometheus \
> --namespace prometheus \
> --set alertmanager.persistentVolume.enabled=false,server.persistentVolume.enabled=false
Release "prometheus" does not exist. Installing it now.
NAME: prometheus
LAST DEPLOYED: Sat Nov 26 02:35:00 2022
NAMESPACE: prometheus
STATUS: deployed
REVISION: 1
NOTES:
The Prometheus server can be accessed via port 80 on the following DNS name from within your cluster:
prometheus-server.prometheus.svc.cluster.local

Get the Prometheus server URL by running these commands in the same shell:
  export POD_NAME=$(kubectl get pods --namespace prometheus -l "app=prometheus,component=server" -o jsonpath="{.items[0].metadata.name}")
  kubectl --namespace prometheus port-forward $POD_NAME 9090
#################################################################################
######   WARNING: Persistence is disabled!!! You will lose your data when   #####
######            the Server pod is terminated.                             #####
#################################################################################

The Prometheus alertmanager can be accessed via port  on the following DNS name from within your cluster:
prometheus-%!s(<nil>).prometheus.svc.cluster.local

Get the Alertmanager URL by running these commands in the same shell:
  export POD_NAME=$(kubectl get pods --namespace prometheus -l "app=prometheus,component=" -o jsonpath="{.items[0].metadata.name}")
  kubectl --namespace prometheus port-forward $POD_NAME 9093
#################################################################################
######   WARNING: Pod Security Policy has been disabled by default since    #####
######            it deprecated after k8s 1.25+. use                        #####
######            (index .Values "prometheus-node-exporter" "rbac"          #####
###### .          "pspEnabled") with (index .Values                         #####
######            "prometheus-node-exporter" "rbac" "pspAnnotations")       #####
######            in case you still need it.                                #####
#################################################################################

The Prometheus PushGateway can be accessed via port 9091 on the following DNS name from within your cluster:
prometheus-prometheus-pushgateway.prometheus.svc.cluster.local

Get the PushGateway URL by running these commands in the same shell:
  export POD_NAME=$(kubectl get pods --namespace prometheus -l "app=prometheus-pushgateway,component=pushgateway" -o jsonpath="{.items[0].metadata.name}")
  kubectl --namespace prometheus port-forward $POD_NAME 9091

For more information on running Prometheus, visit:
https://prometheus.io/
접속
eyestalk1:~/environment $ kubectl --namespace=prometheus port-forward deploy/prometheus-server 8080:9090
Forwarding from 127.0.0.1:8080 -> 9090
Forwarding from [::1]:8080 -> 9090https://2d40801881c741c5a5b9c40c77b81e43.vfs.cloud9.ap-northeast-2.amazonaws.com/graph?g0.expr=&g0.tab=1&g0.stacked=0&g0.show_exemplars=0&g0.range_input=1h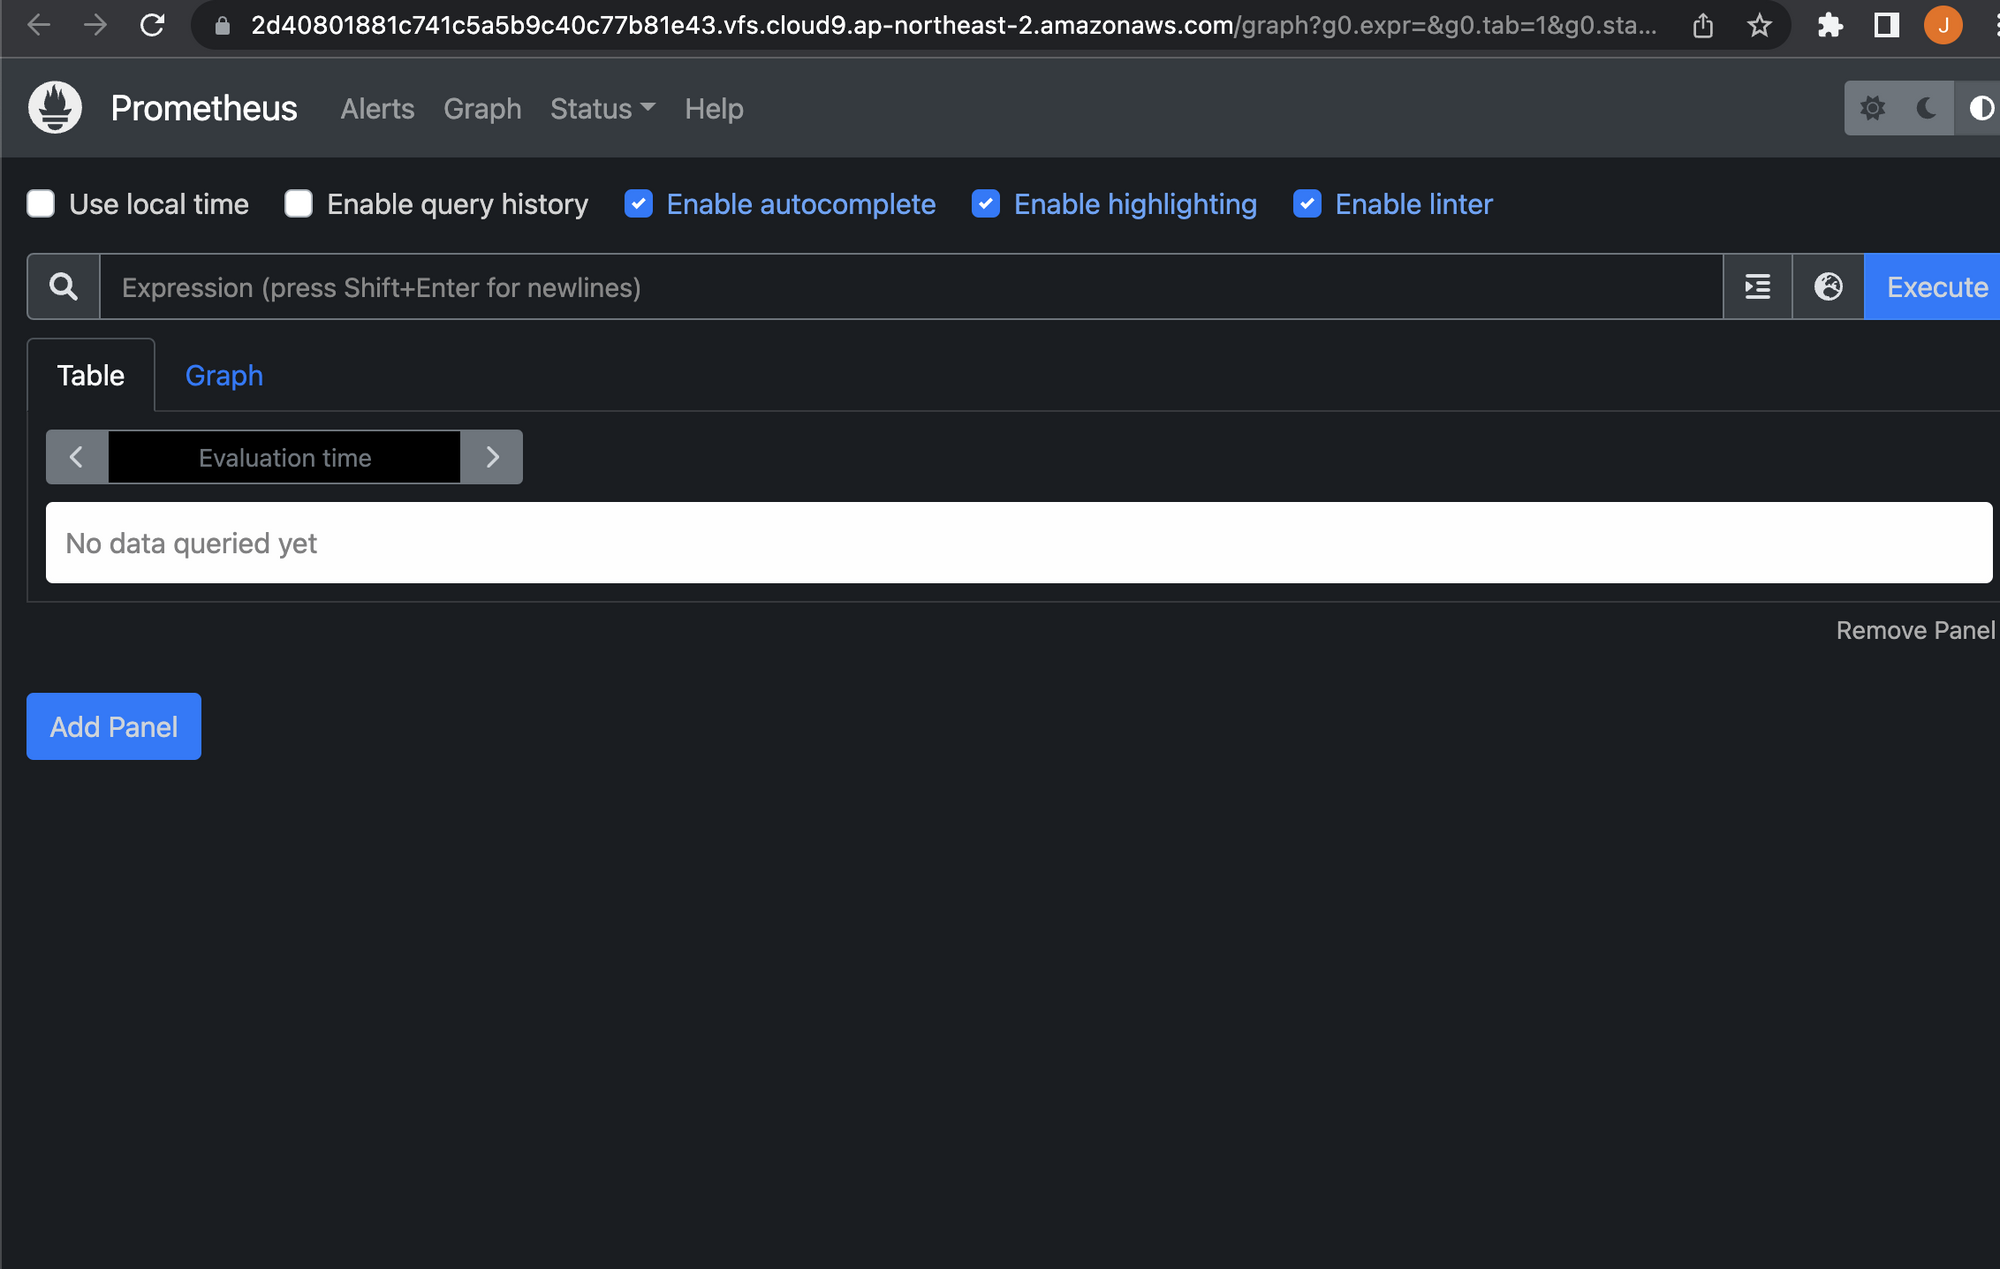
- promethus 확인
eyestalk1:~/environment $ kubectl get deploy -n prometheusNAME                                READY   UP-TO-DATE   AVAILABLE   AGE
prometheus-kube-state-metrics       1/1     1            1           8m1s
prometheus-prometheus-pushgateway   1/1     1            1           8m1s
prometheus-server                   1/1     1            1           8m1s
Dashboard
Server Version: v1.23.13-eks-fb459a0
eyestalk1:~/environment $ kubectl apply -f https://raw.githubusercontent.com/kubernetes/dashboard/v2.5.1/aio/deploy/recommended.yaml
namespace/kubernetes-dashboard created
serviceaccount/kubernetes-dashboard created
service/kubernetes-dashboard created
secret/kubernetes-dashboard-certs created
secret/kubernetes-dashboard-csrf created
secret/kubernetes-dashboard-key-holder created
configmap/kubernetes-dashboard-settings created
role.rbac.authorization.k8s.io/kubernetes-dashboard created
clusterrole.rbac.authorization.k8s.io/kubernetes-dashboard created
rolebinding.rbac.authorization.k8s.io/kubernetes-dashboard created
clusterrolebinding.rbac.authorization.k8s.io/kubernetes-dashboard created
deployment.apps/kubernetes-dashboard created
service/dashboard-metrics-scraper created
deployment.apps/dashboard-metrics-scraper created
Distro 설치
AWS Distro는 메트릭 로그를 AWS CloudWatch에 자동으로 수집하는 데 도움이 되며 나중에 Container Insights를 사용하여 배포된 애플리케이션의 성능을 모니터링 가능하다.
eyestalk1:~/environment $ curl https://raw.githubusercontent.com/aws-observability/aws-otel-collector/main/deployment-template/eks/otel-container-insights-infra.yaml | kubectl apply -f -
% Total % Received % Xferd Average Speed Time Time Time Current
Dload Upload Total Spent Left Speed % Total % Received % Xferd Average Speed Time Time Time Current
Dload Upload Total Spent Left Speed
0 0 0 0 0 0 0 0 --:--:-- --:--:-- --:--:-- 0
100 7548 100 7548 0 0 22949 0 --:--:-- --:--:-- --:--:-- 22942
65 7548 65 4964 0 0 13682 0 --:--:-- --:--:-- --:--:-- 13674
curl: (23) Failure writing output to destination
namespace/aws-otel-eks created
serviceaccount/aws-otel-sa created
clusterrole.rbac.authorization.k8s.io/aoc-agent-role created
clusterrolebinding.rbac.authorization.k8s.io/aoc-agent-role-binding created
configmap/otel-agent-conf created
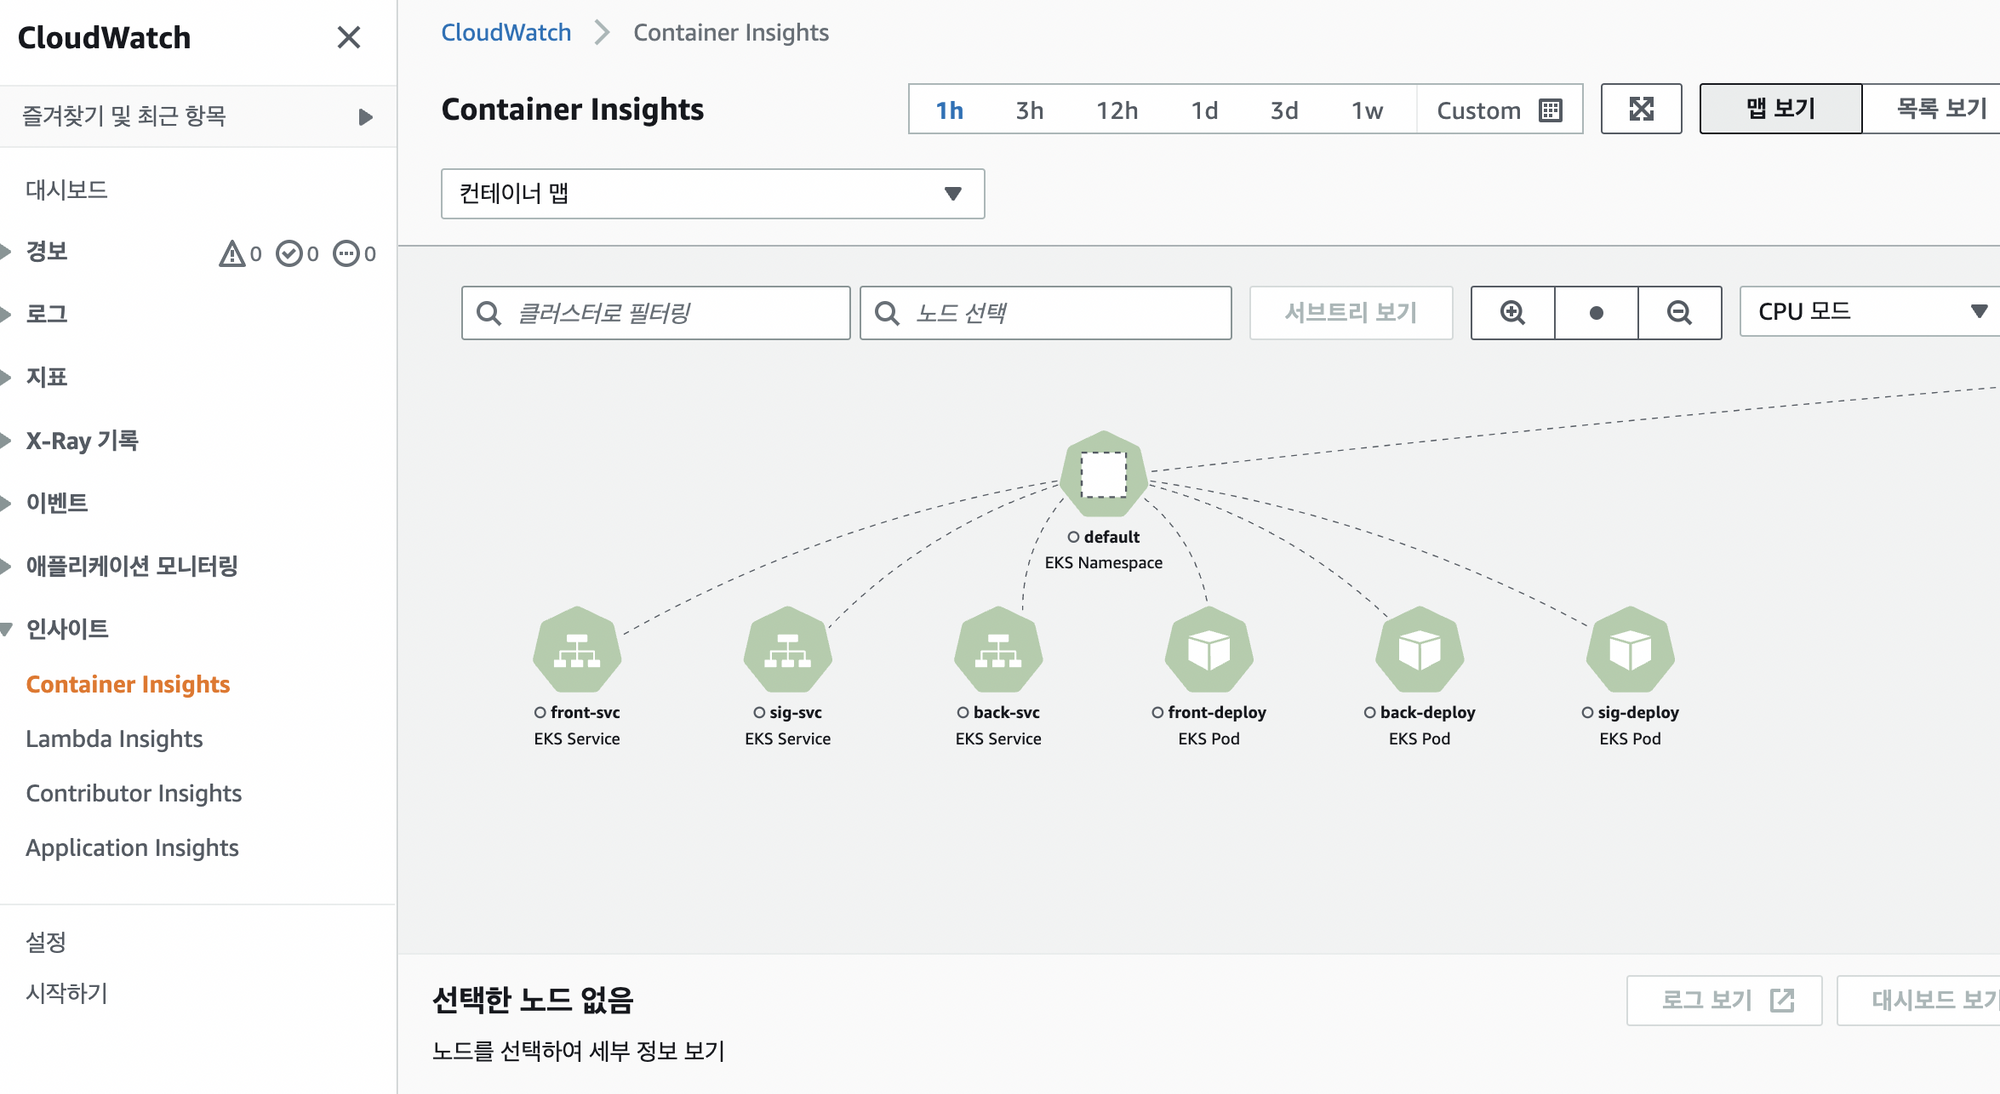
daemonset.apps/aws-otel-eks-ci createdCloud watch 에서 확인
- 인사이트 → container Insights → 토글 컨테이너 맵 넣기
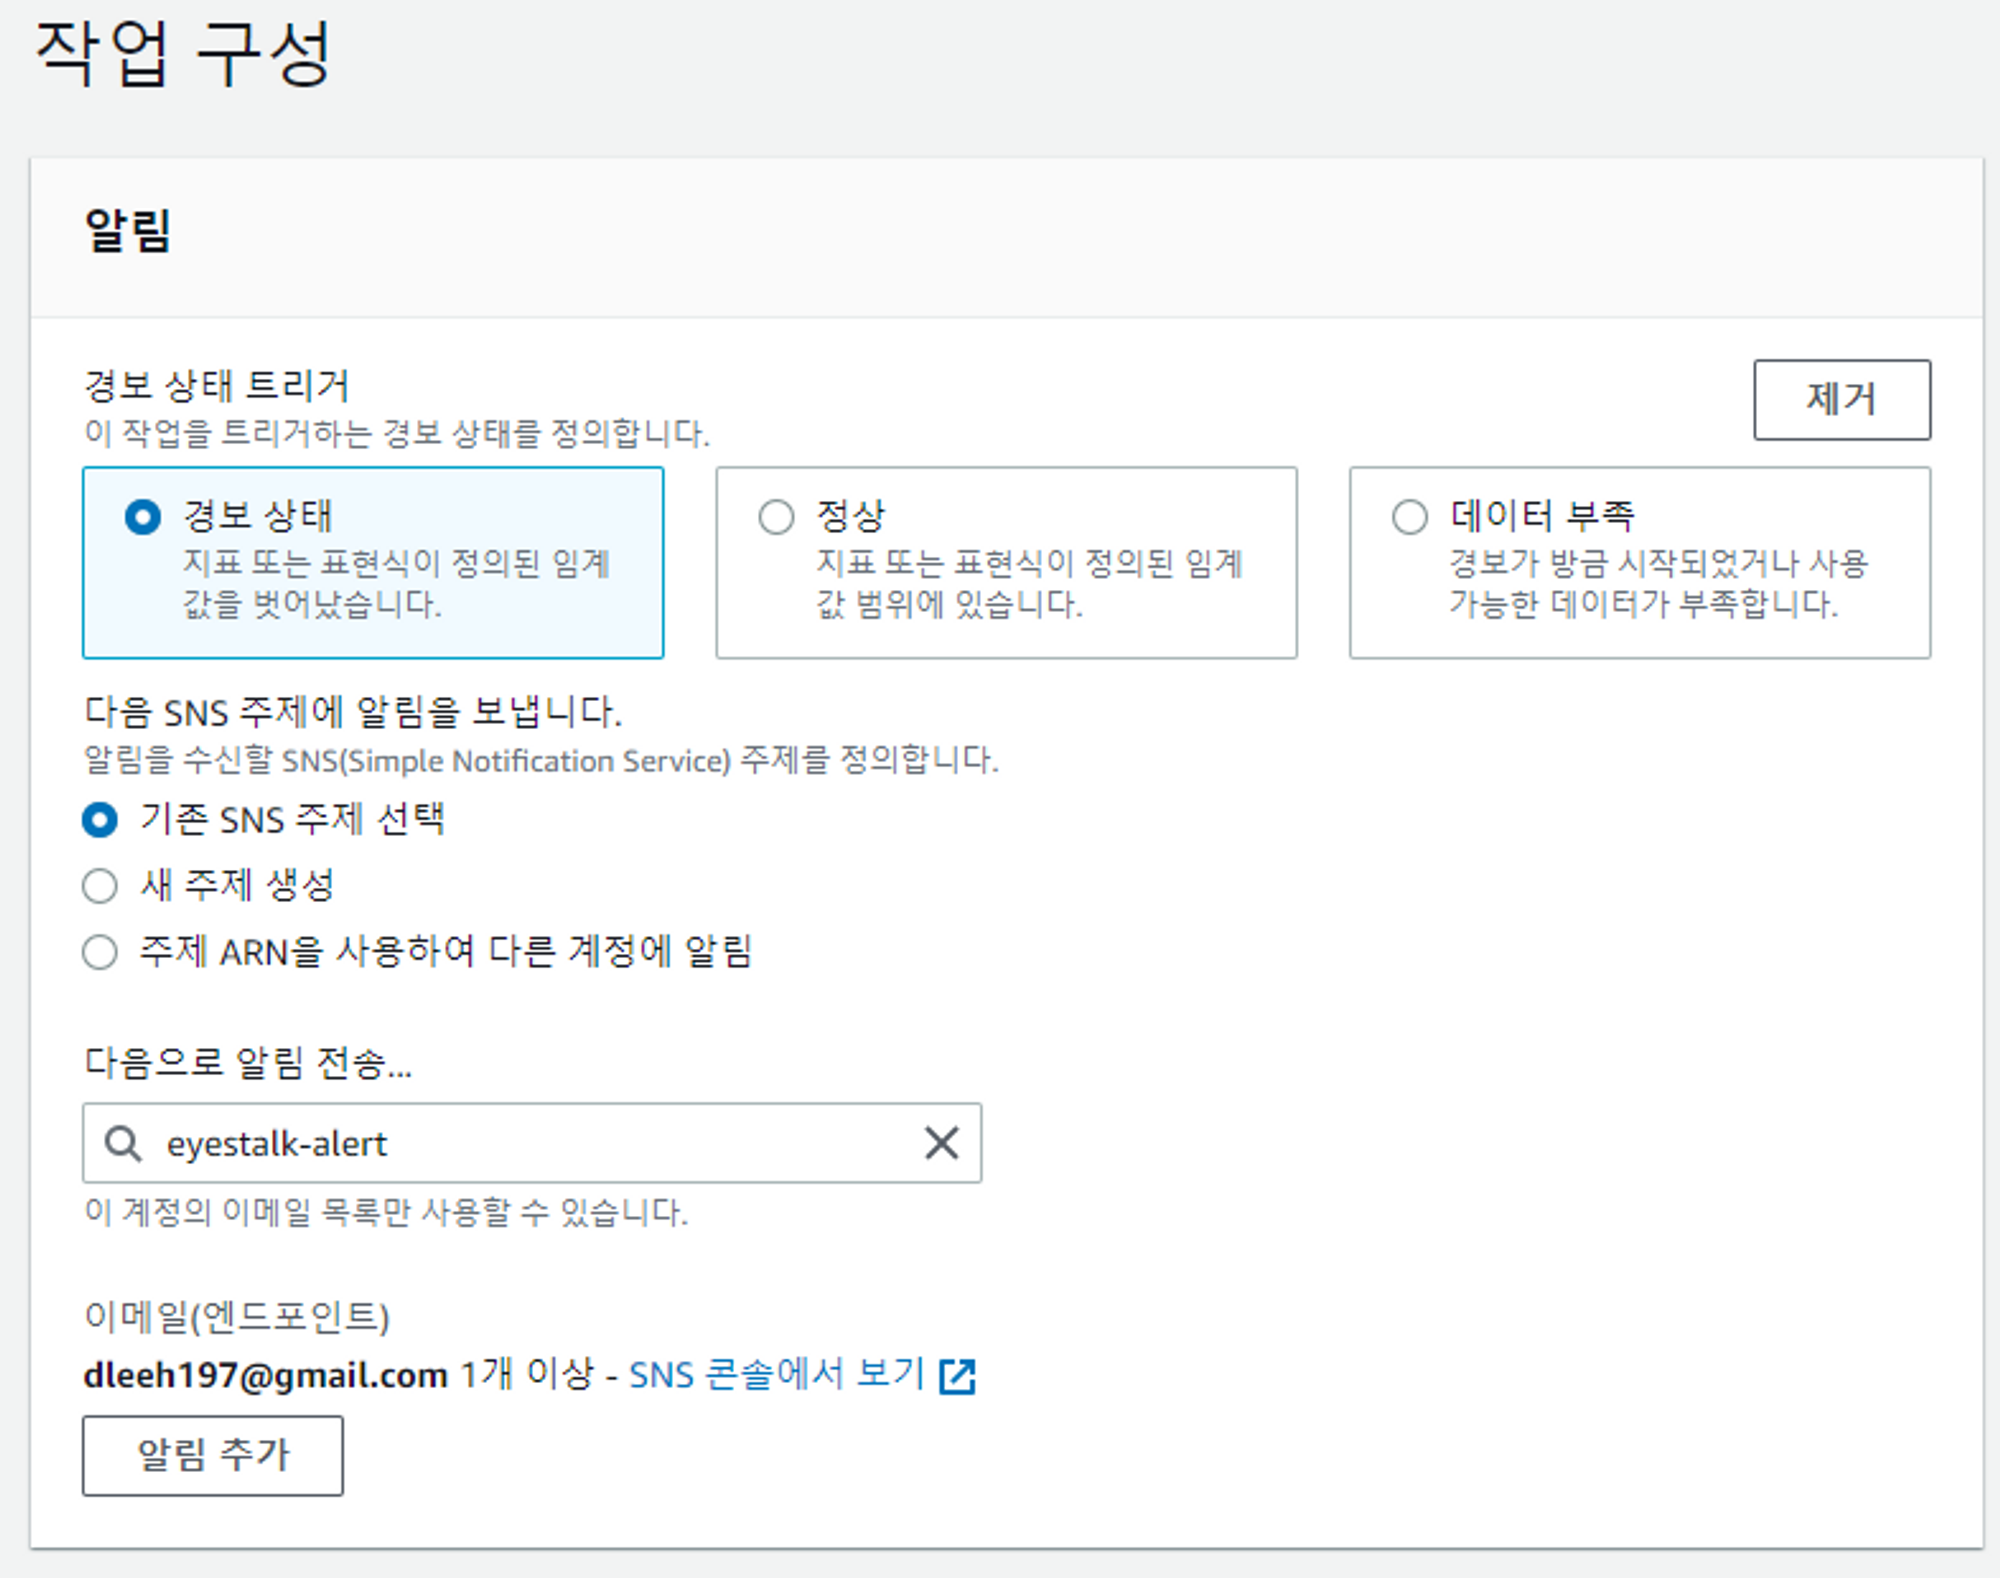
Amazon SNS Alert 설치
CPU사용량에 따라 기준치가 넘으면 자동으로 경고 알림이 오도록 하자
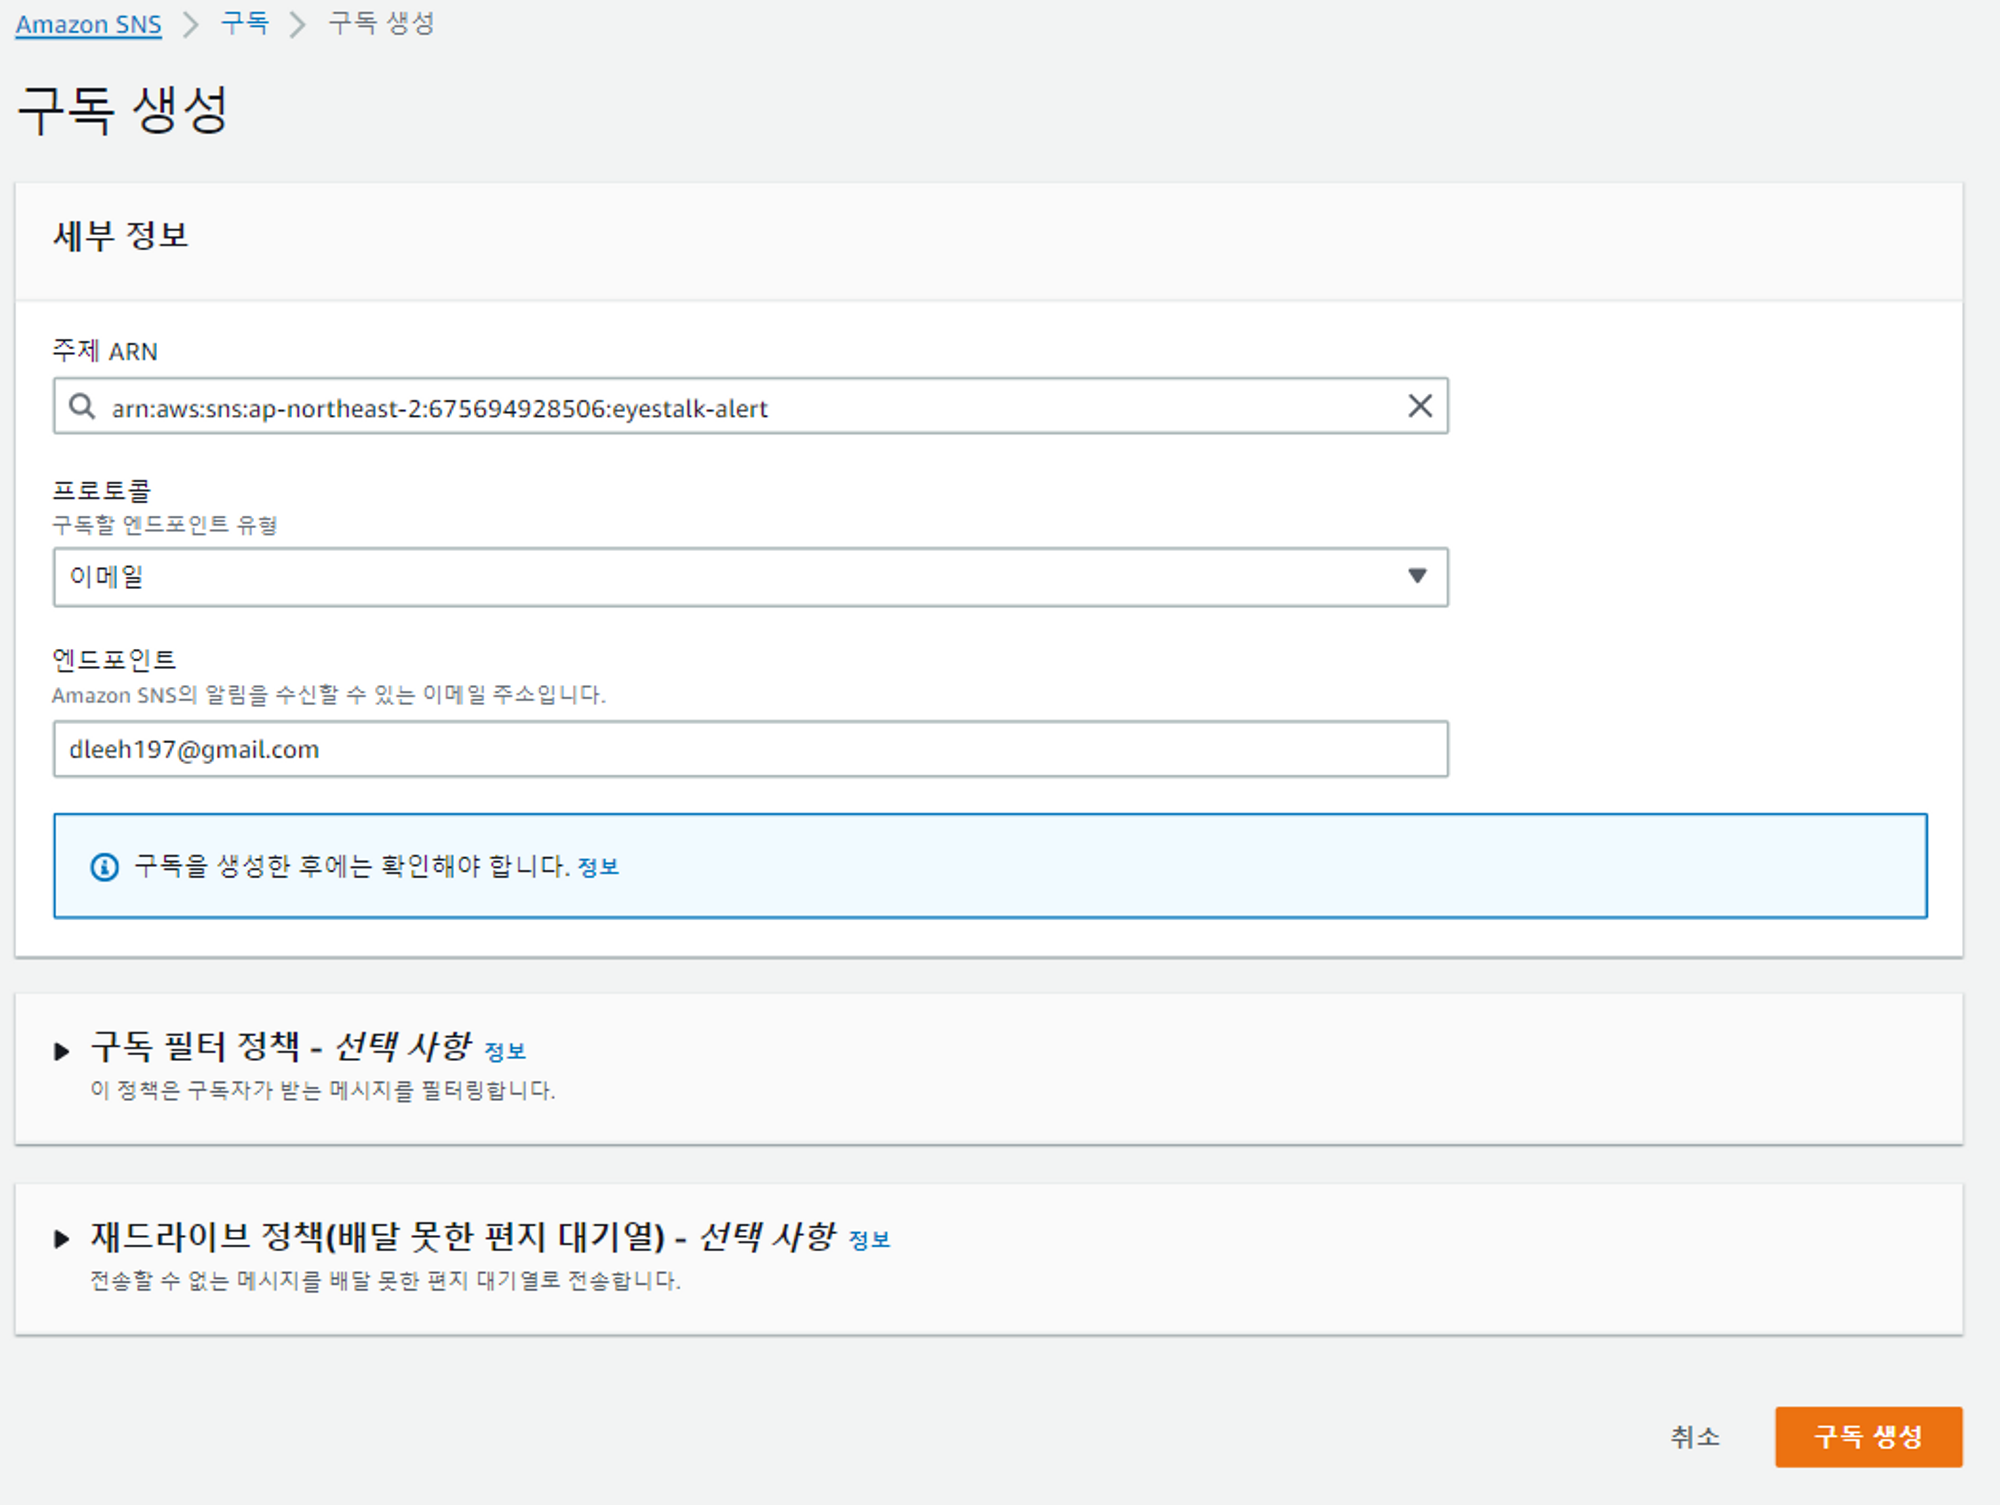
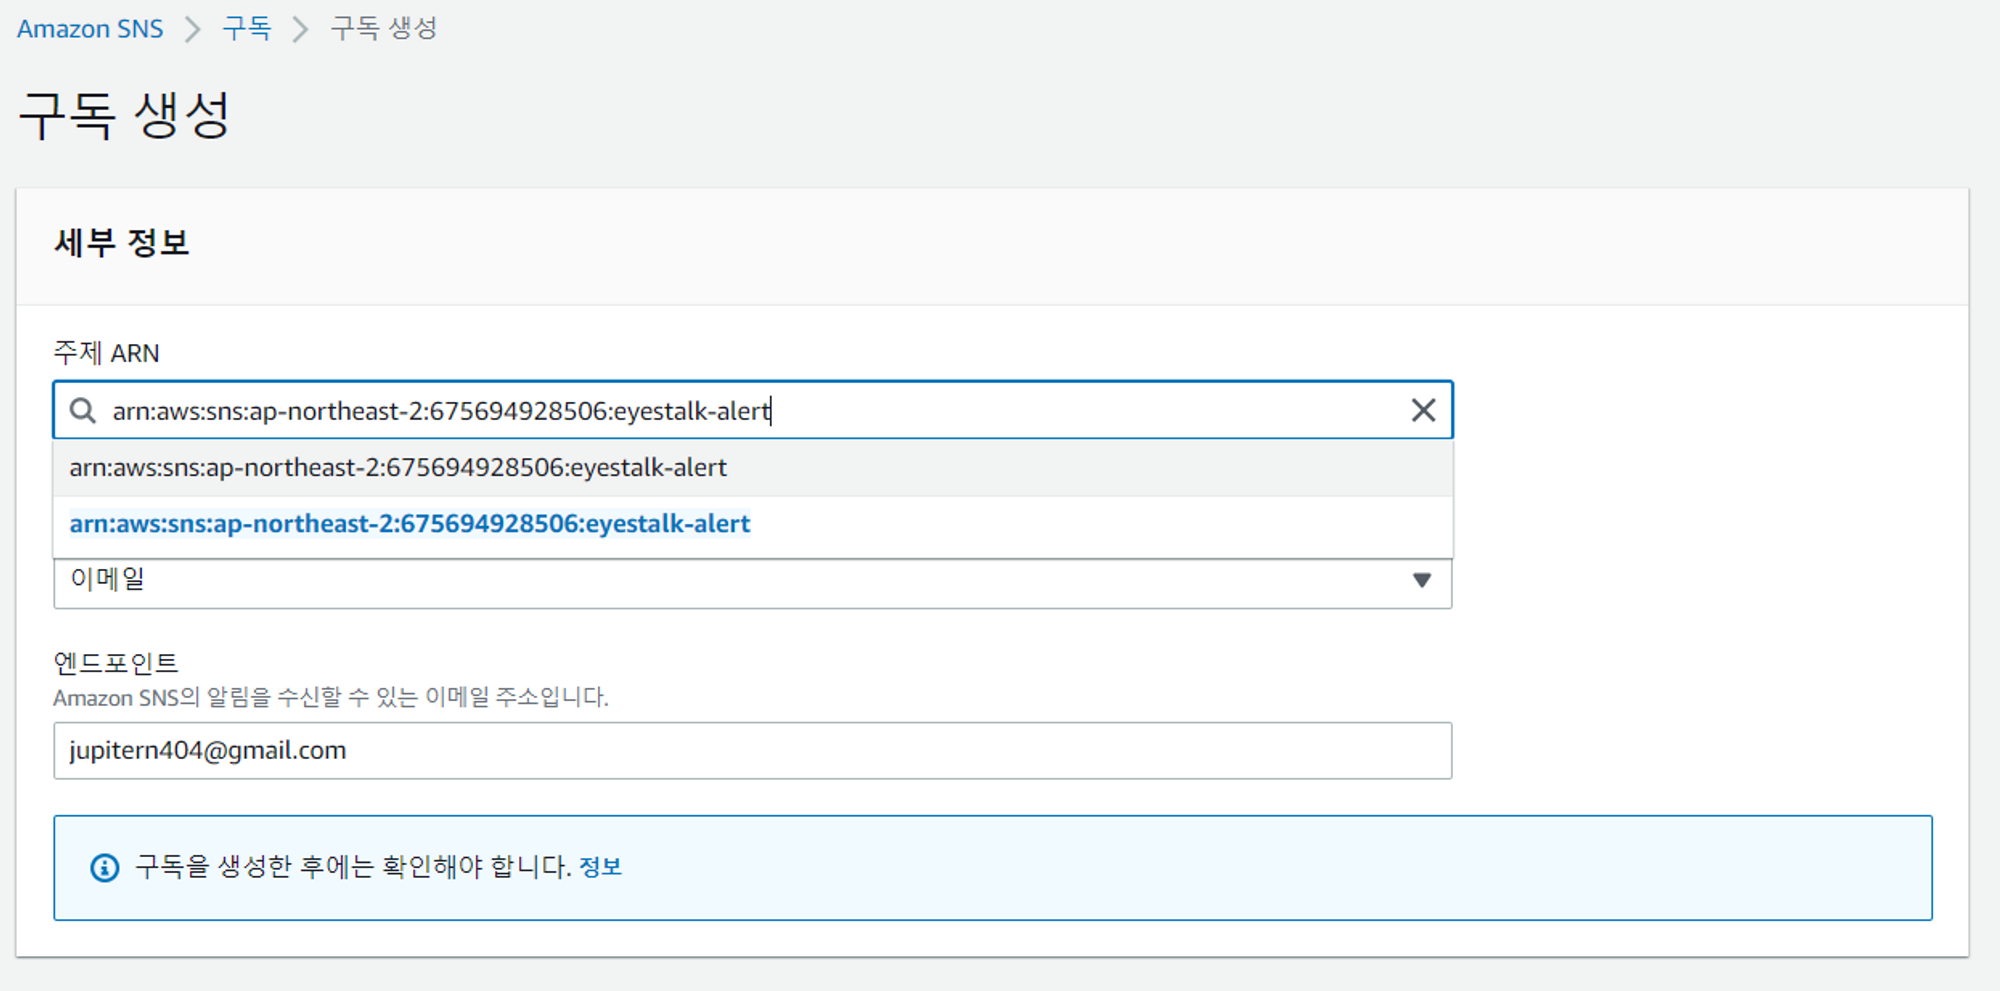
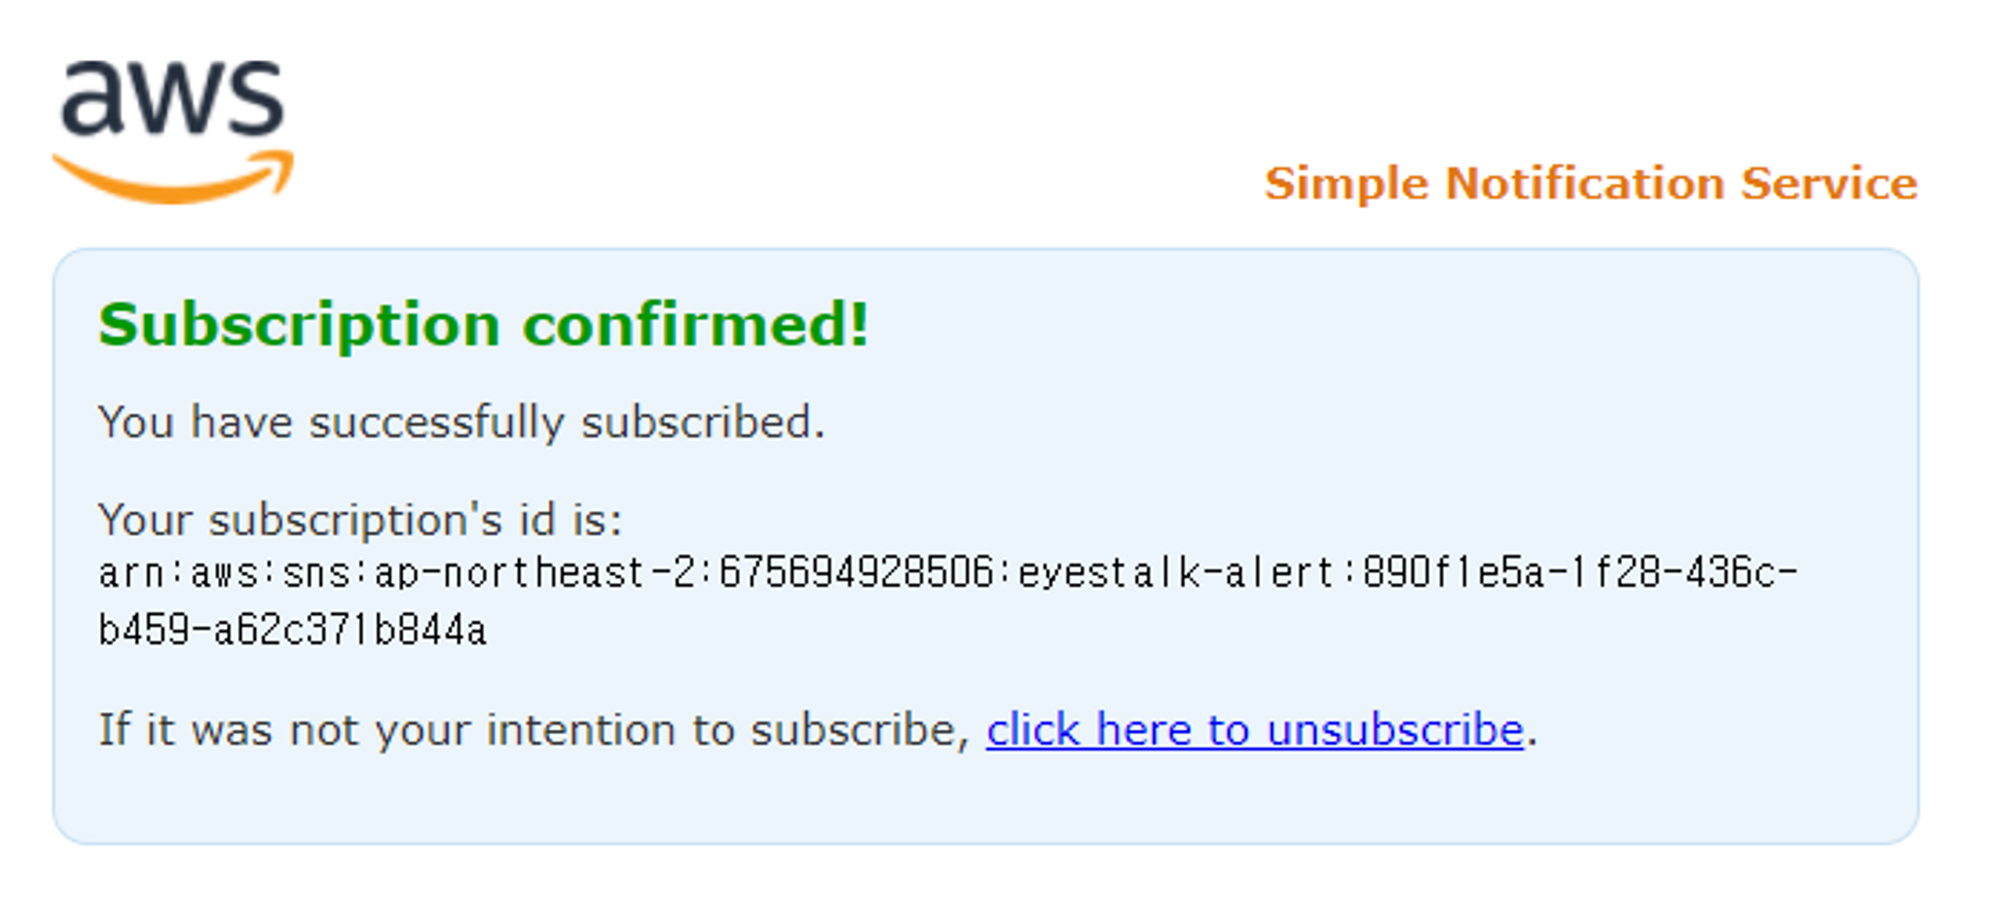
알림 서비스 신청
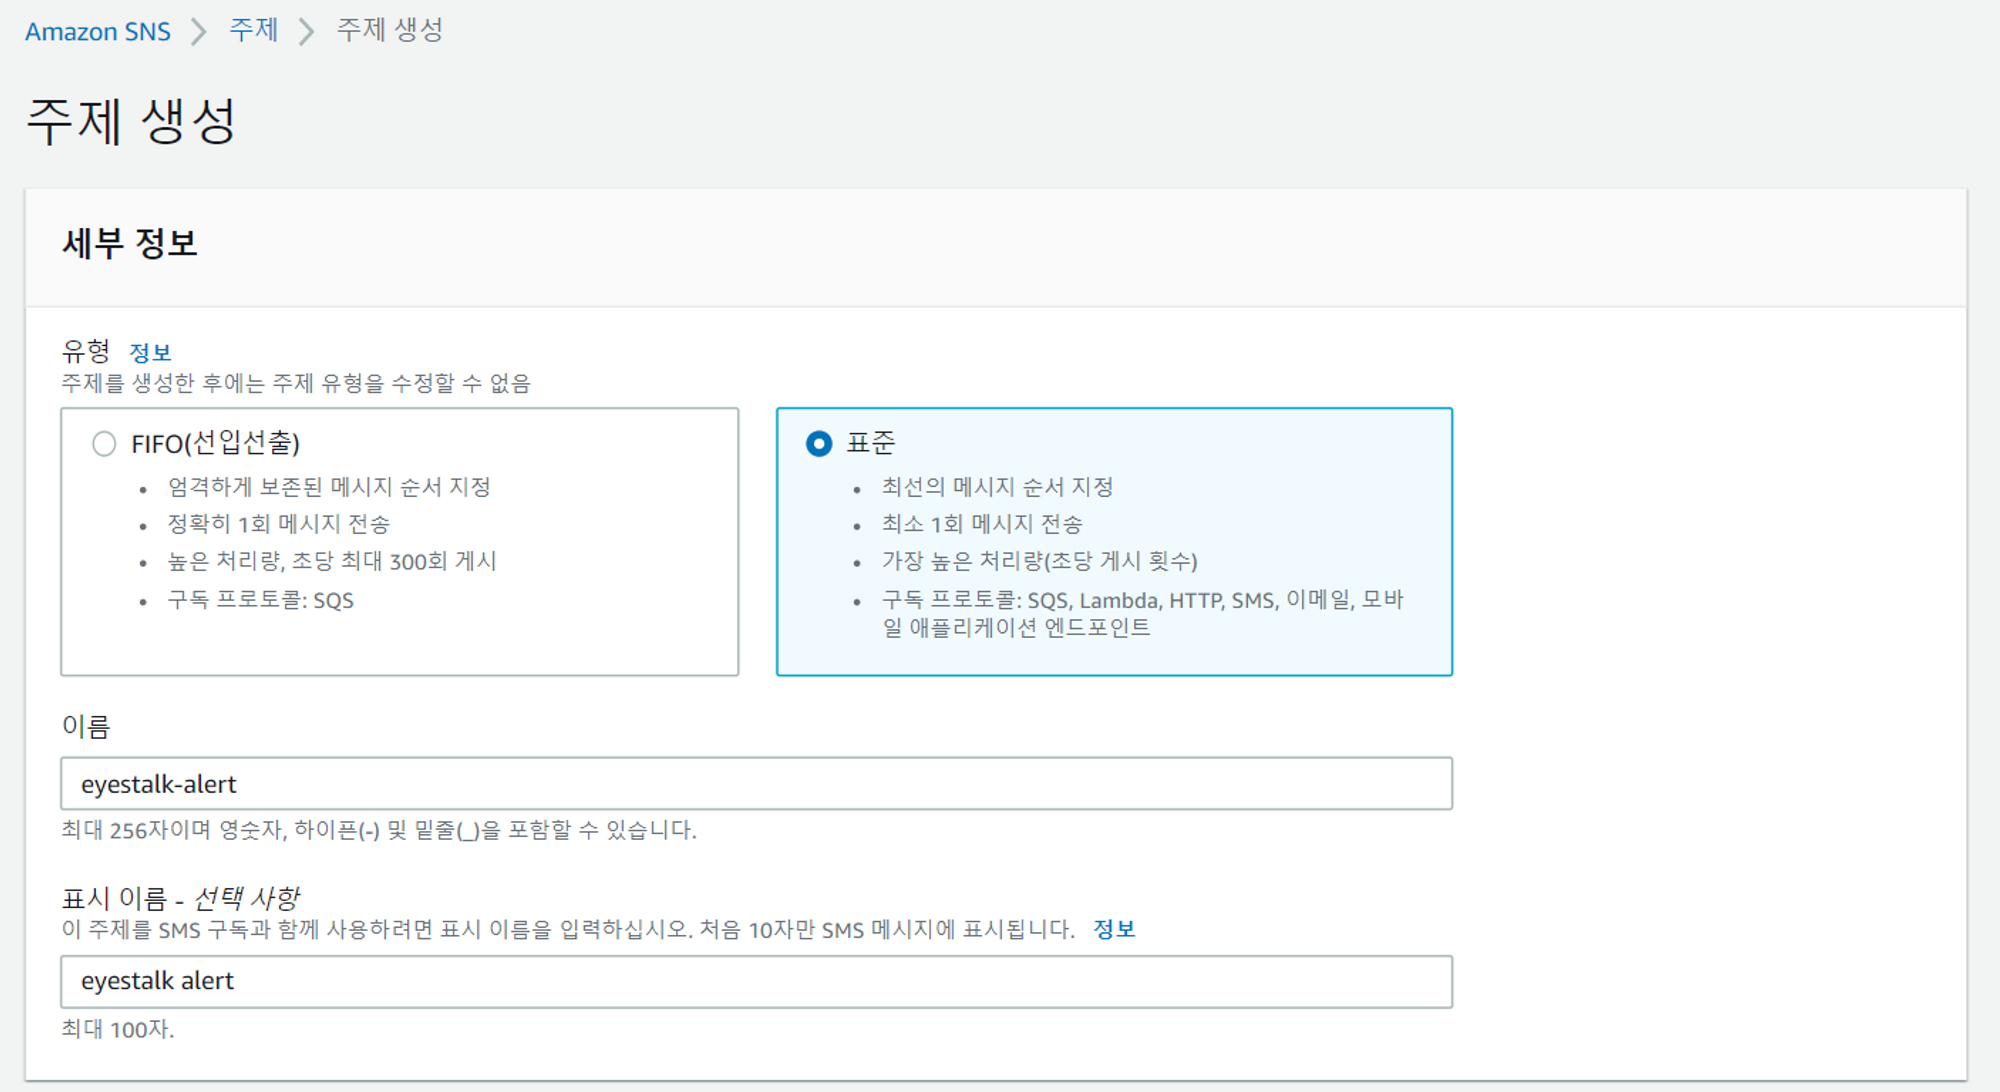
- 알림이 올 메일을 등록
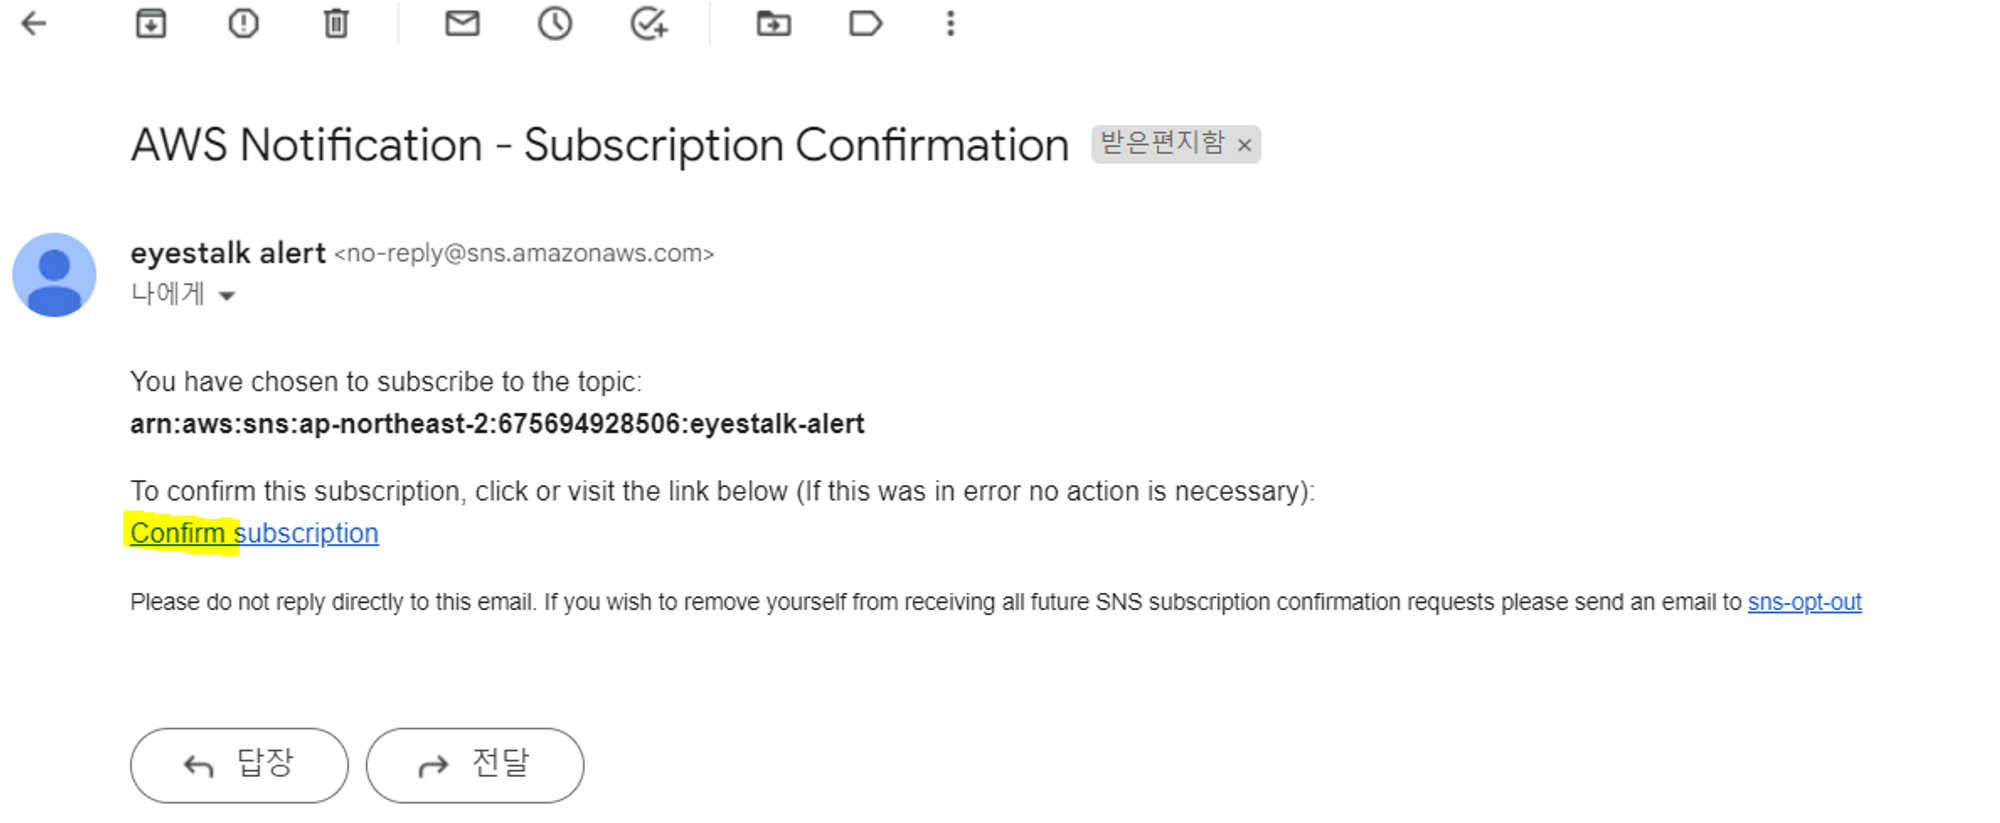
- 확인 메일이 오면 클릭하고 인증
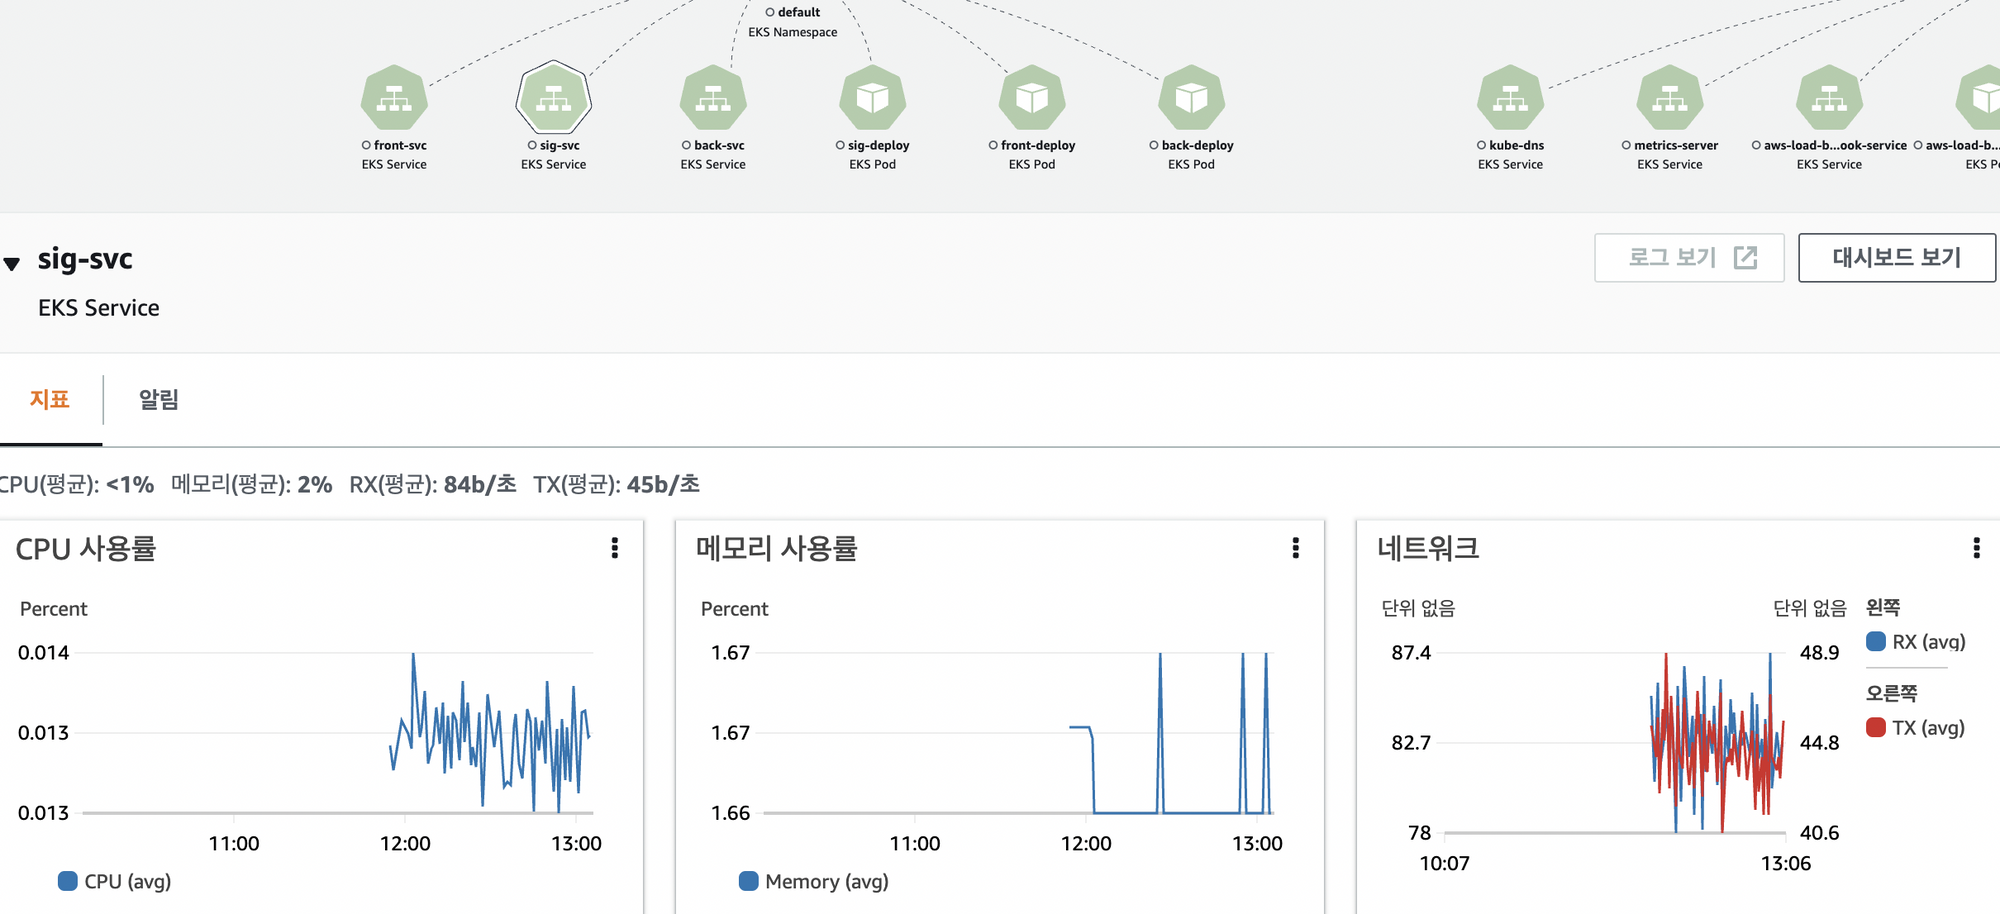
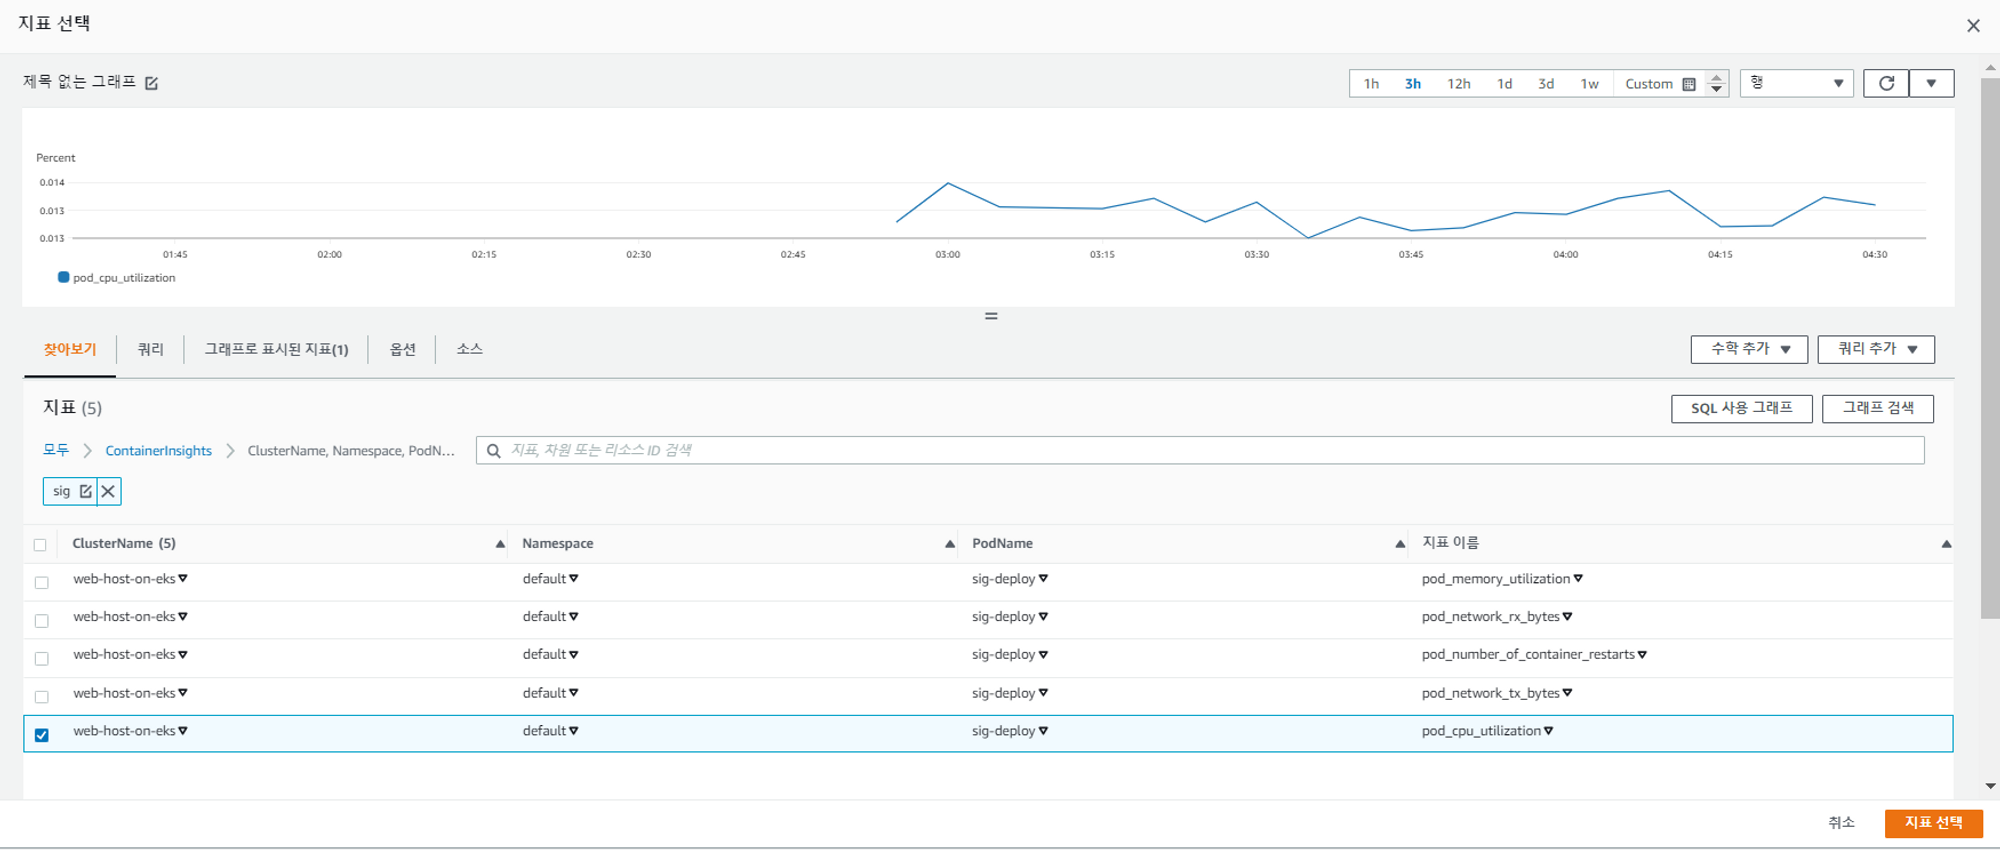
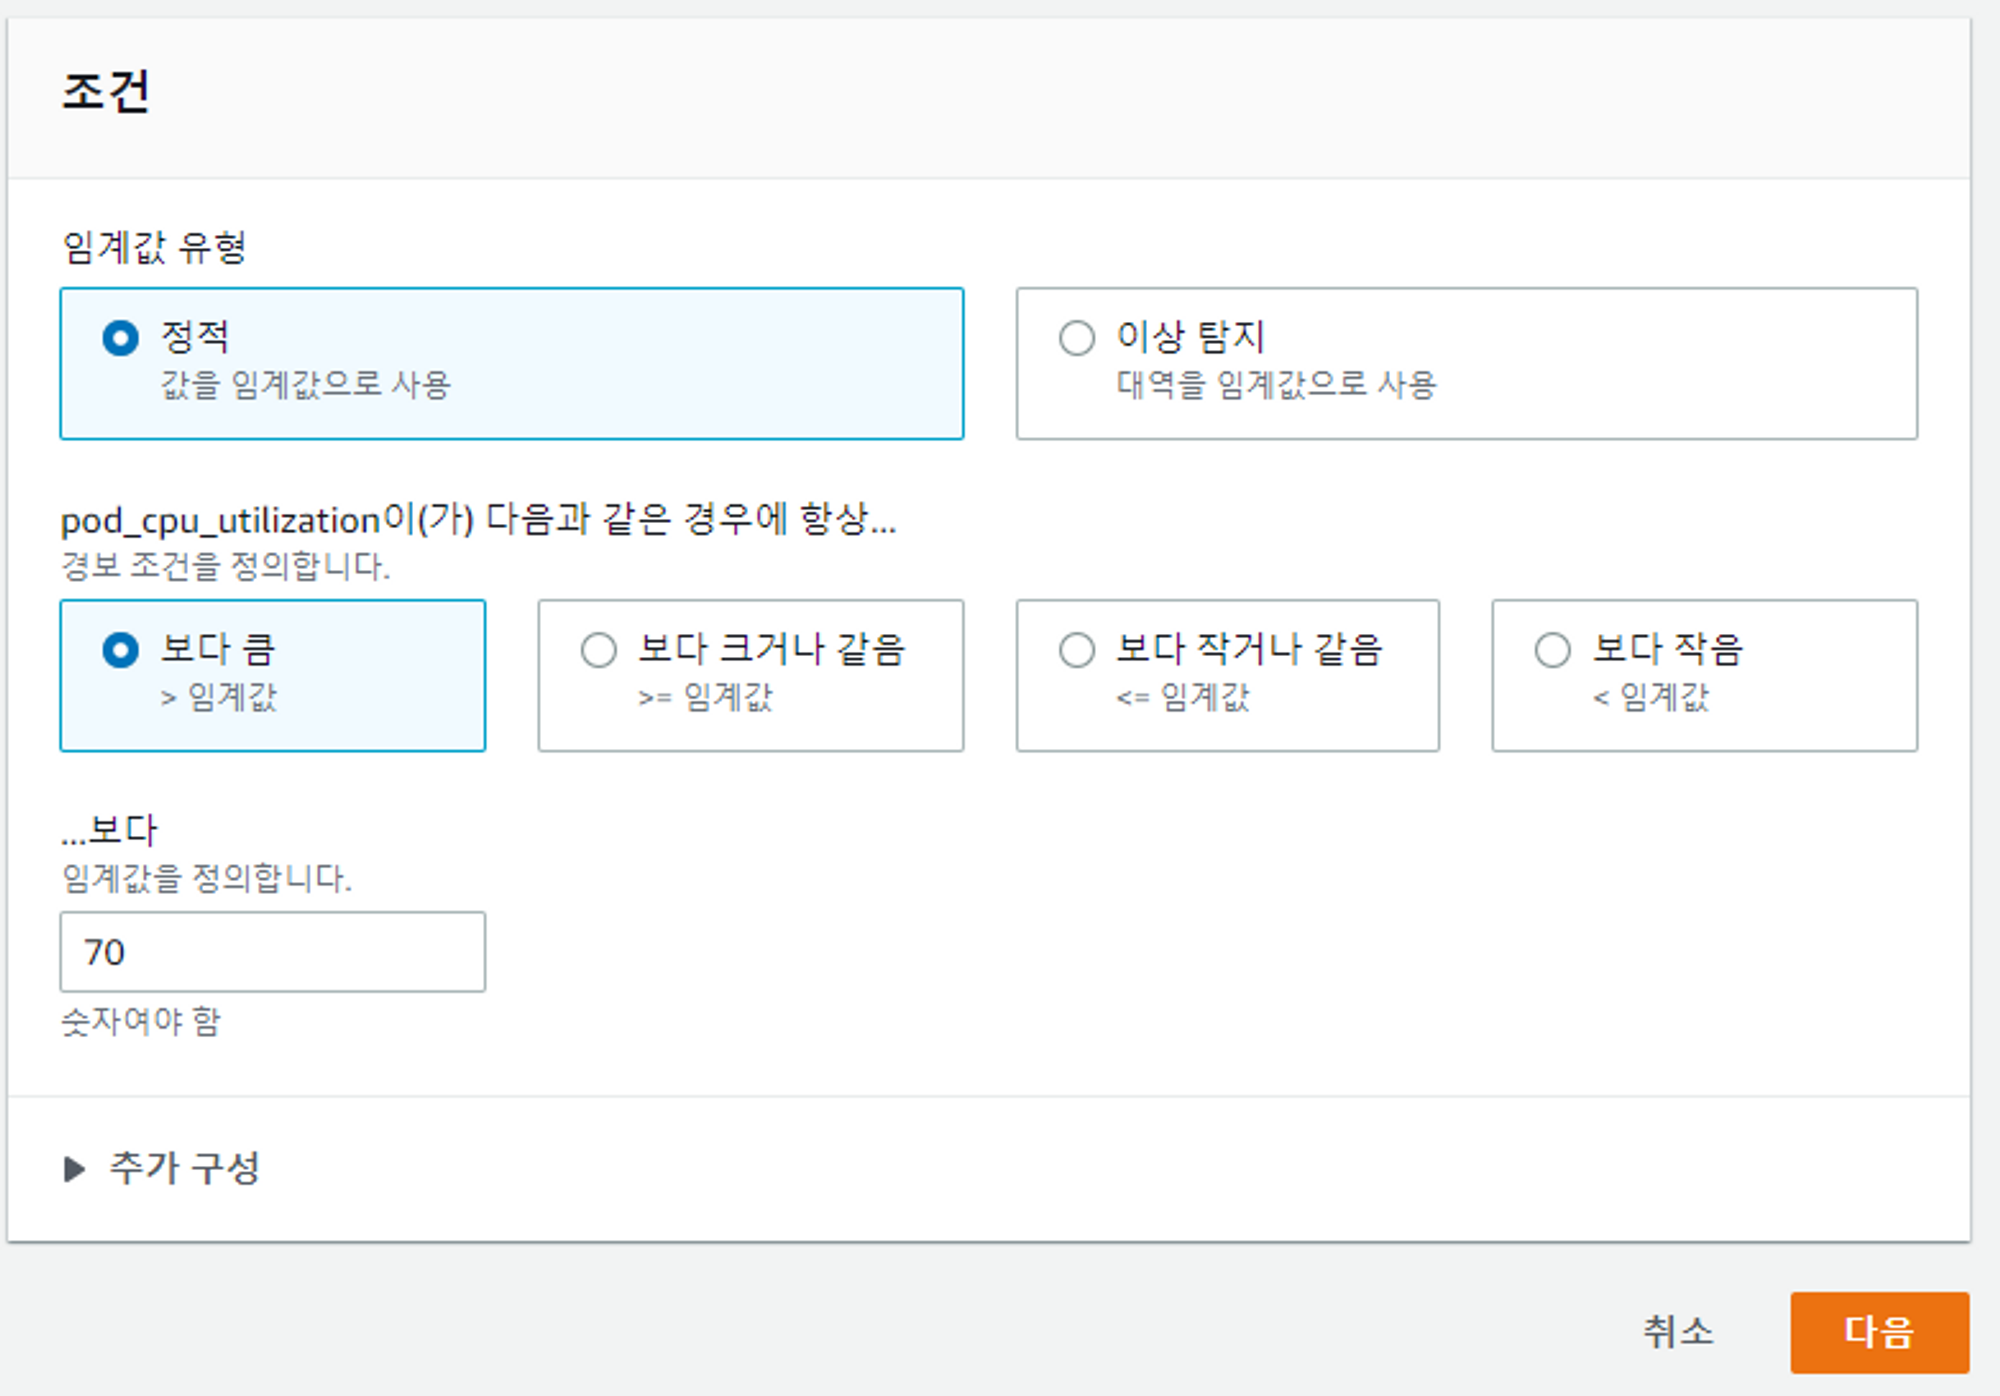
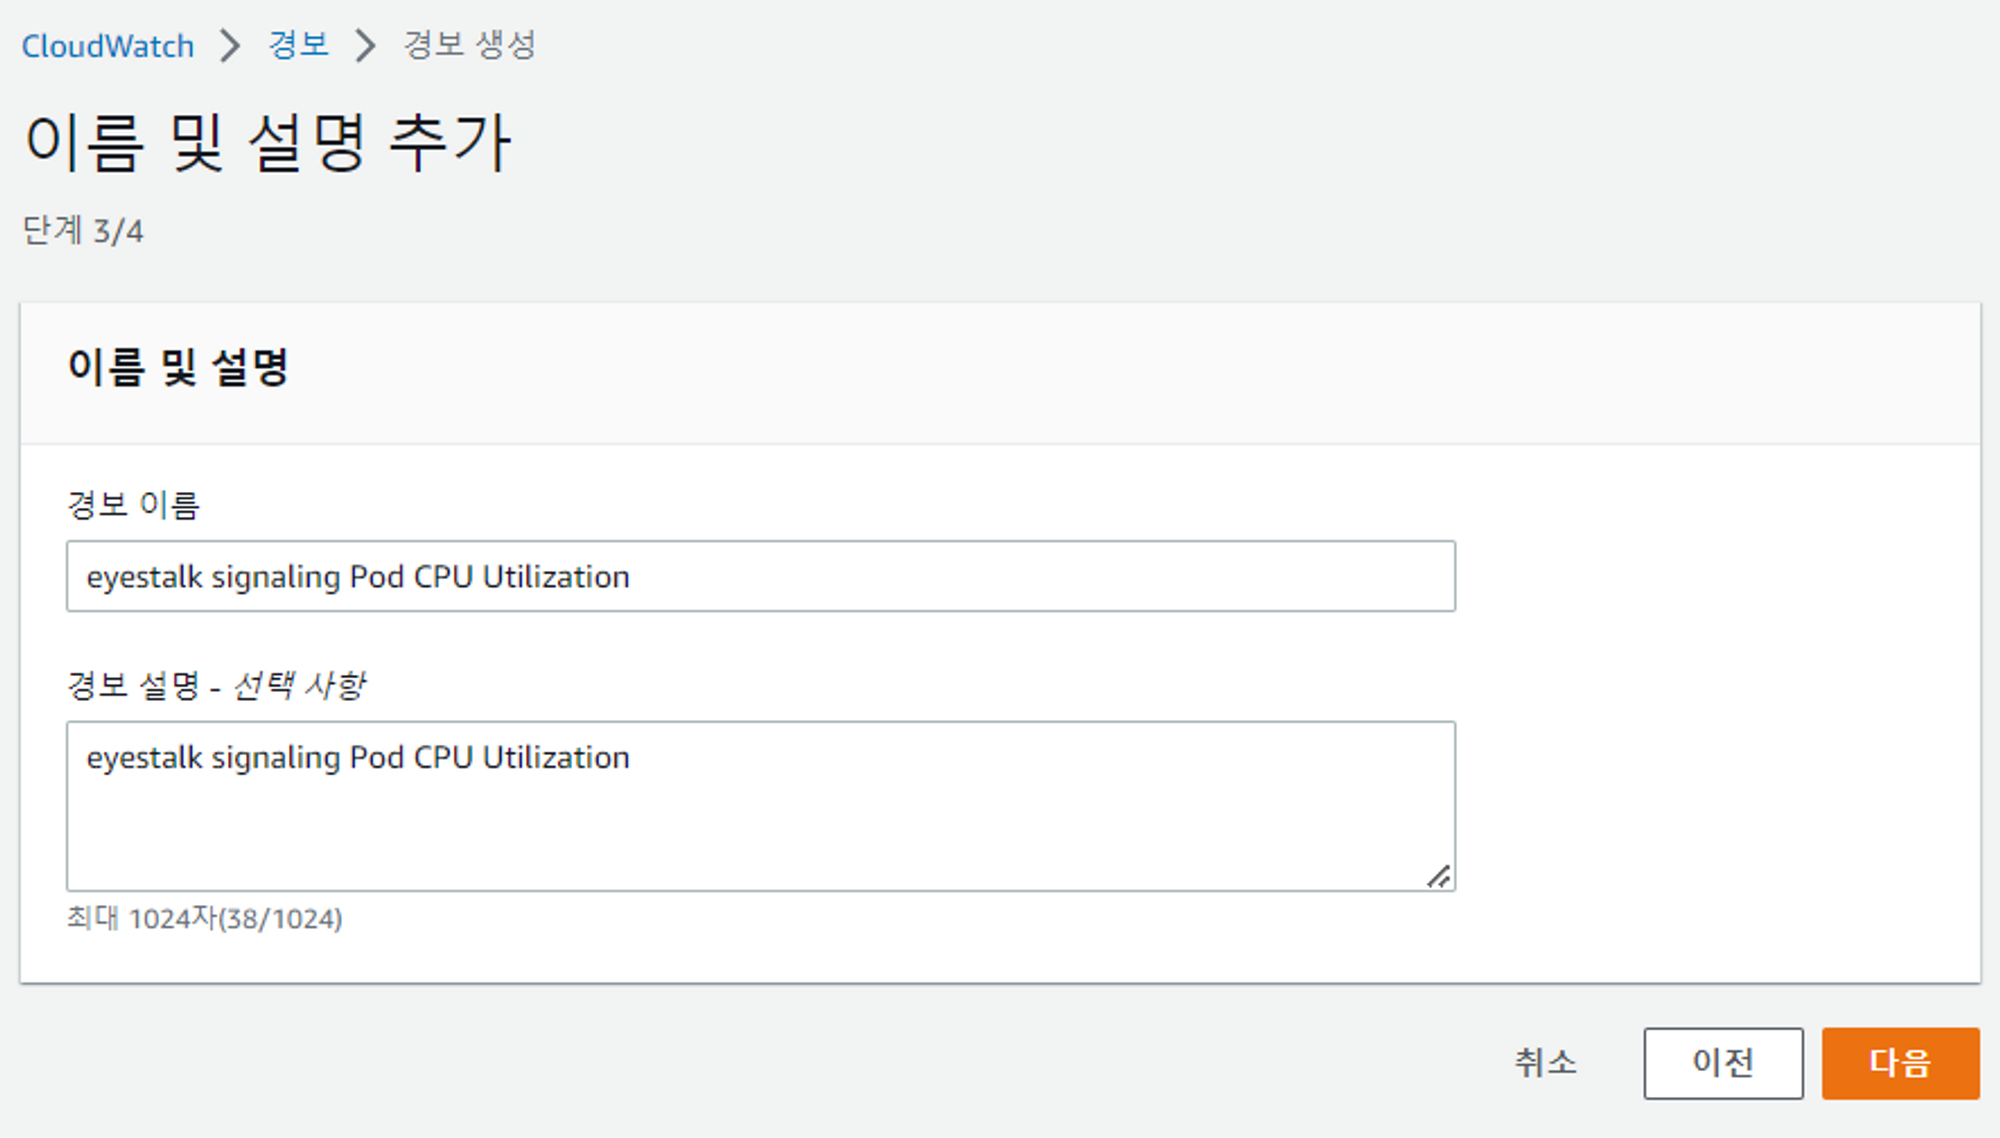
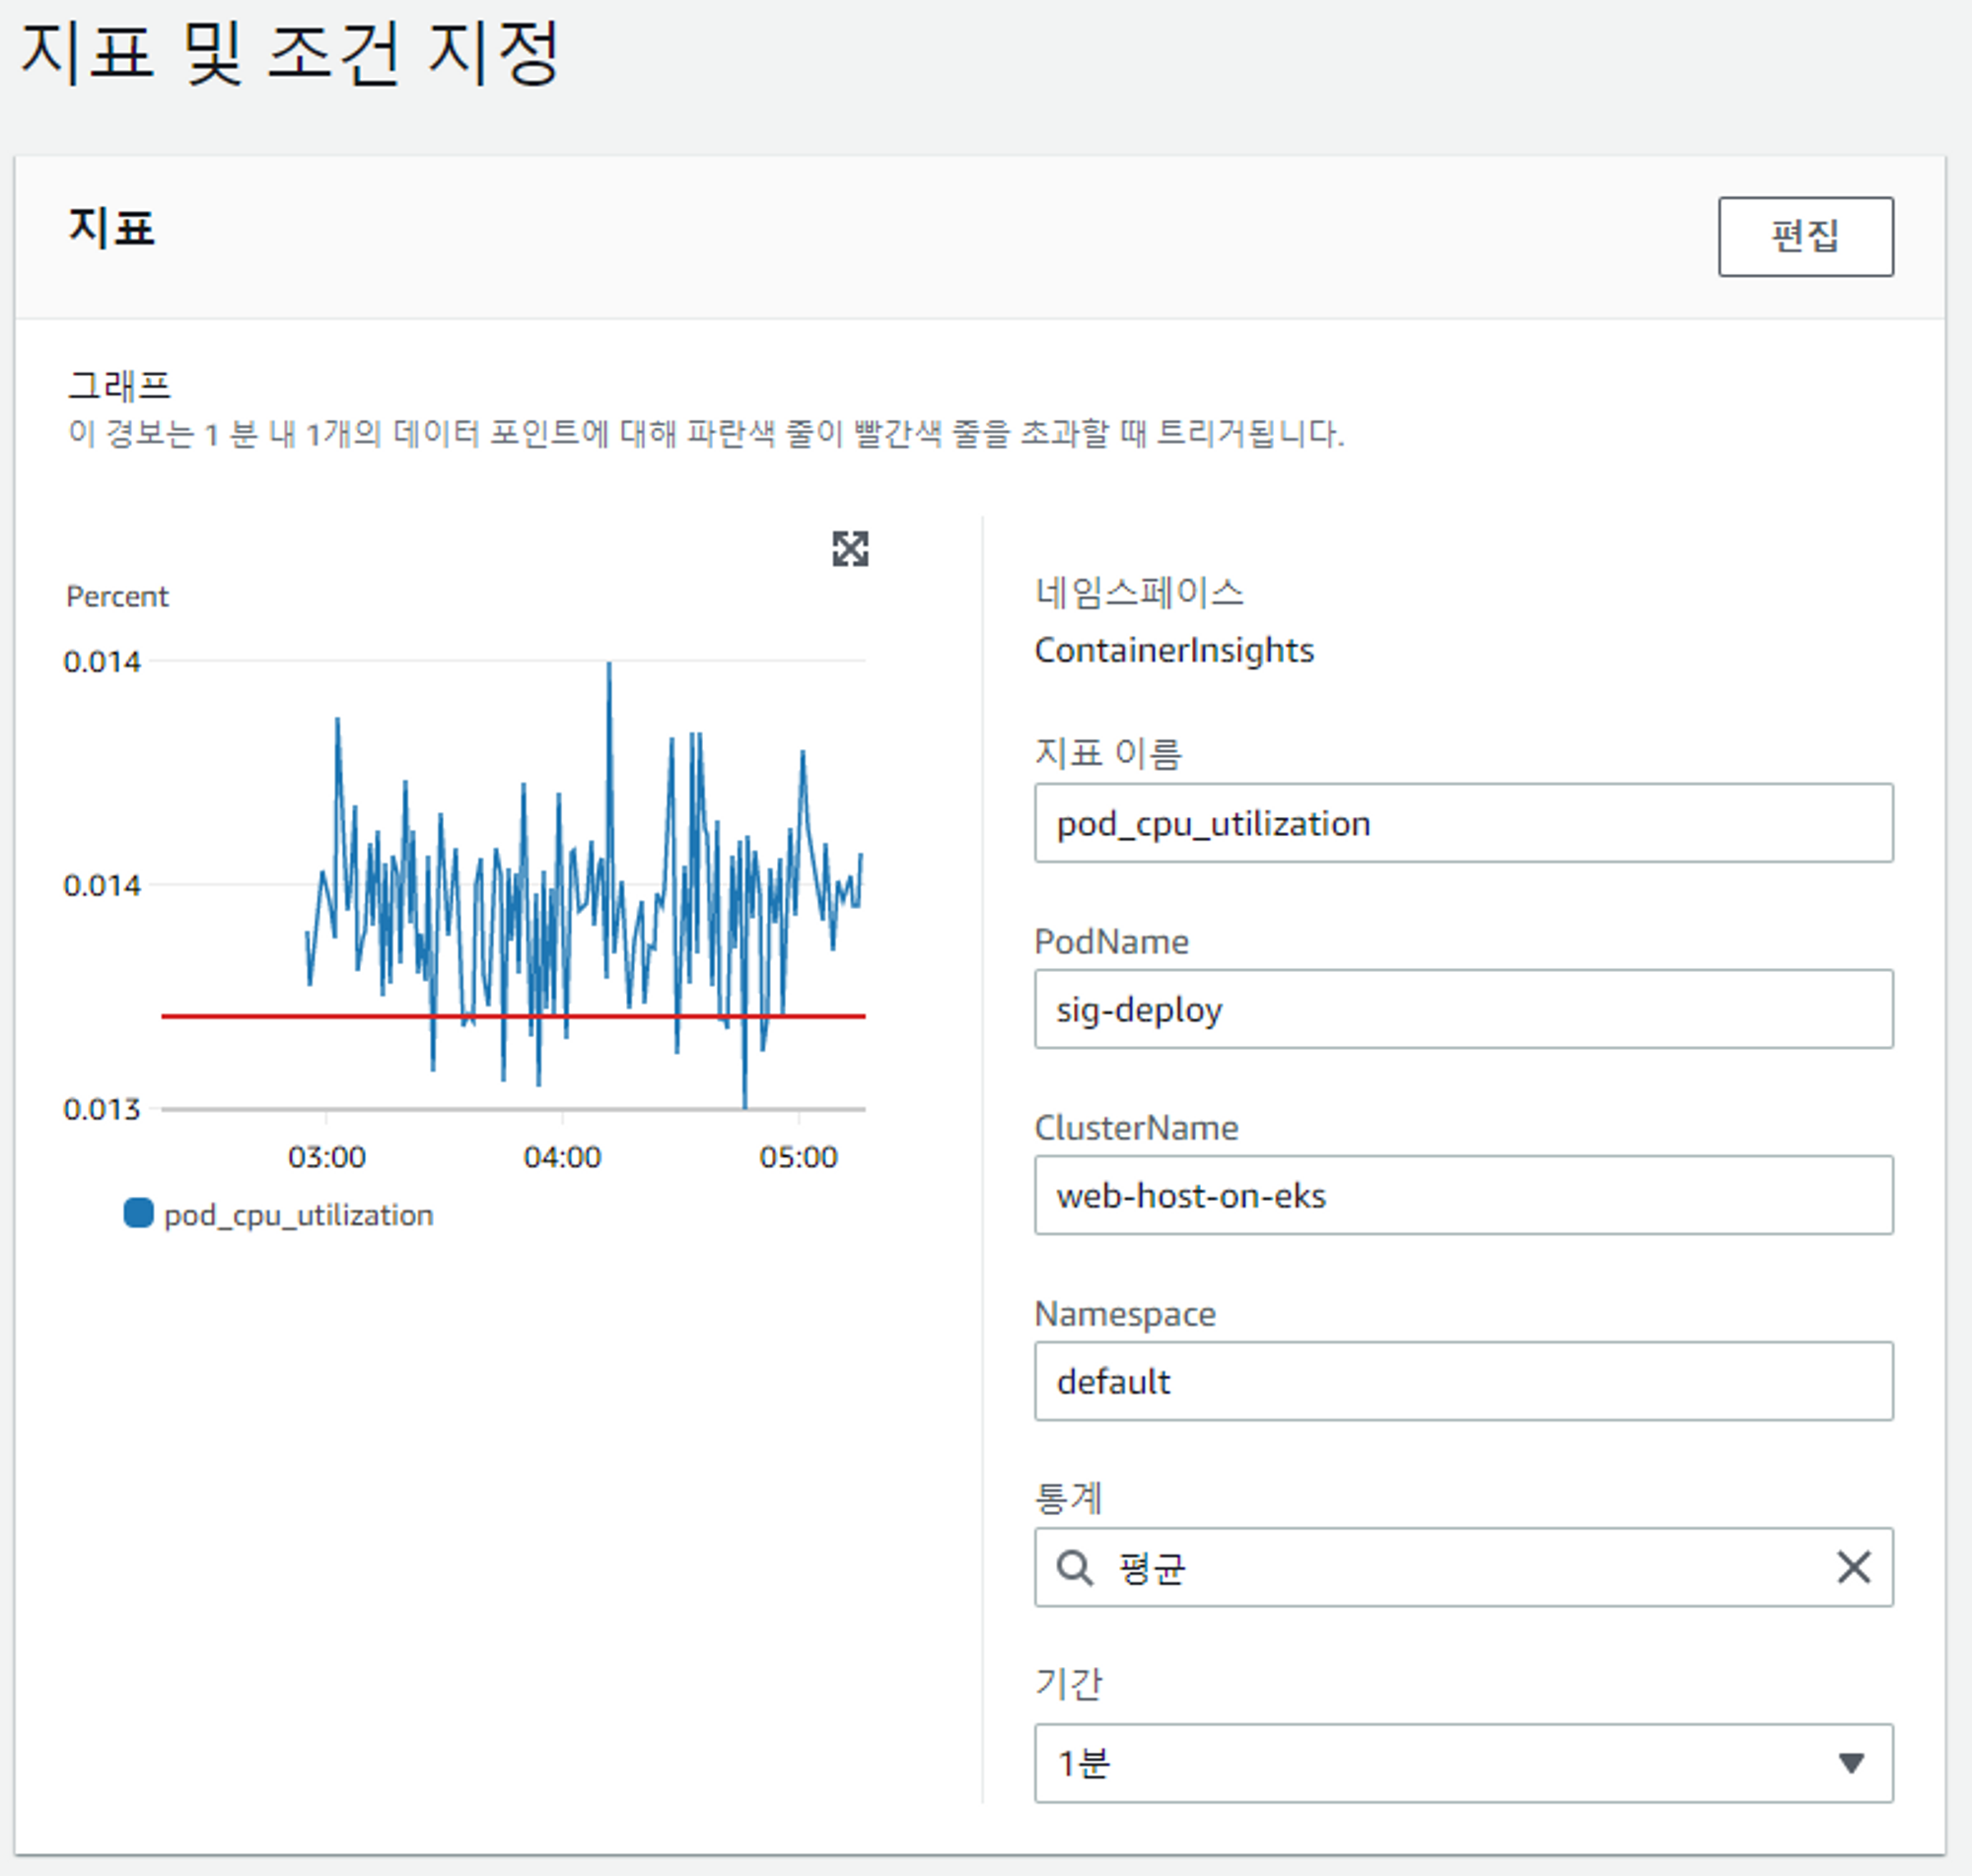
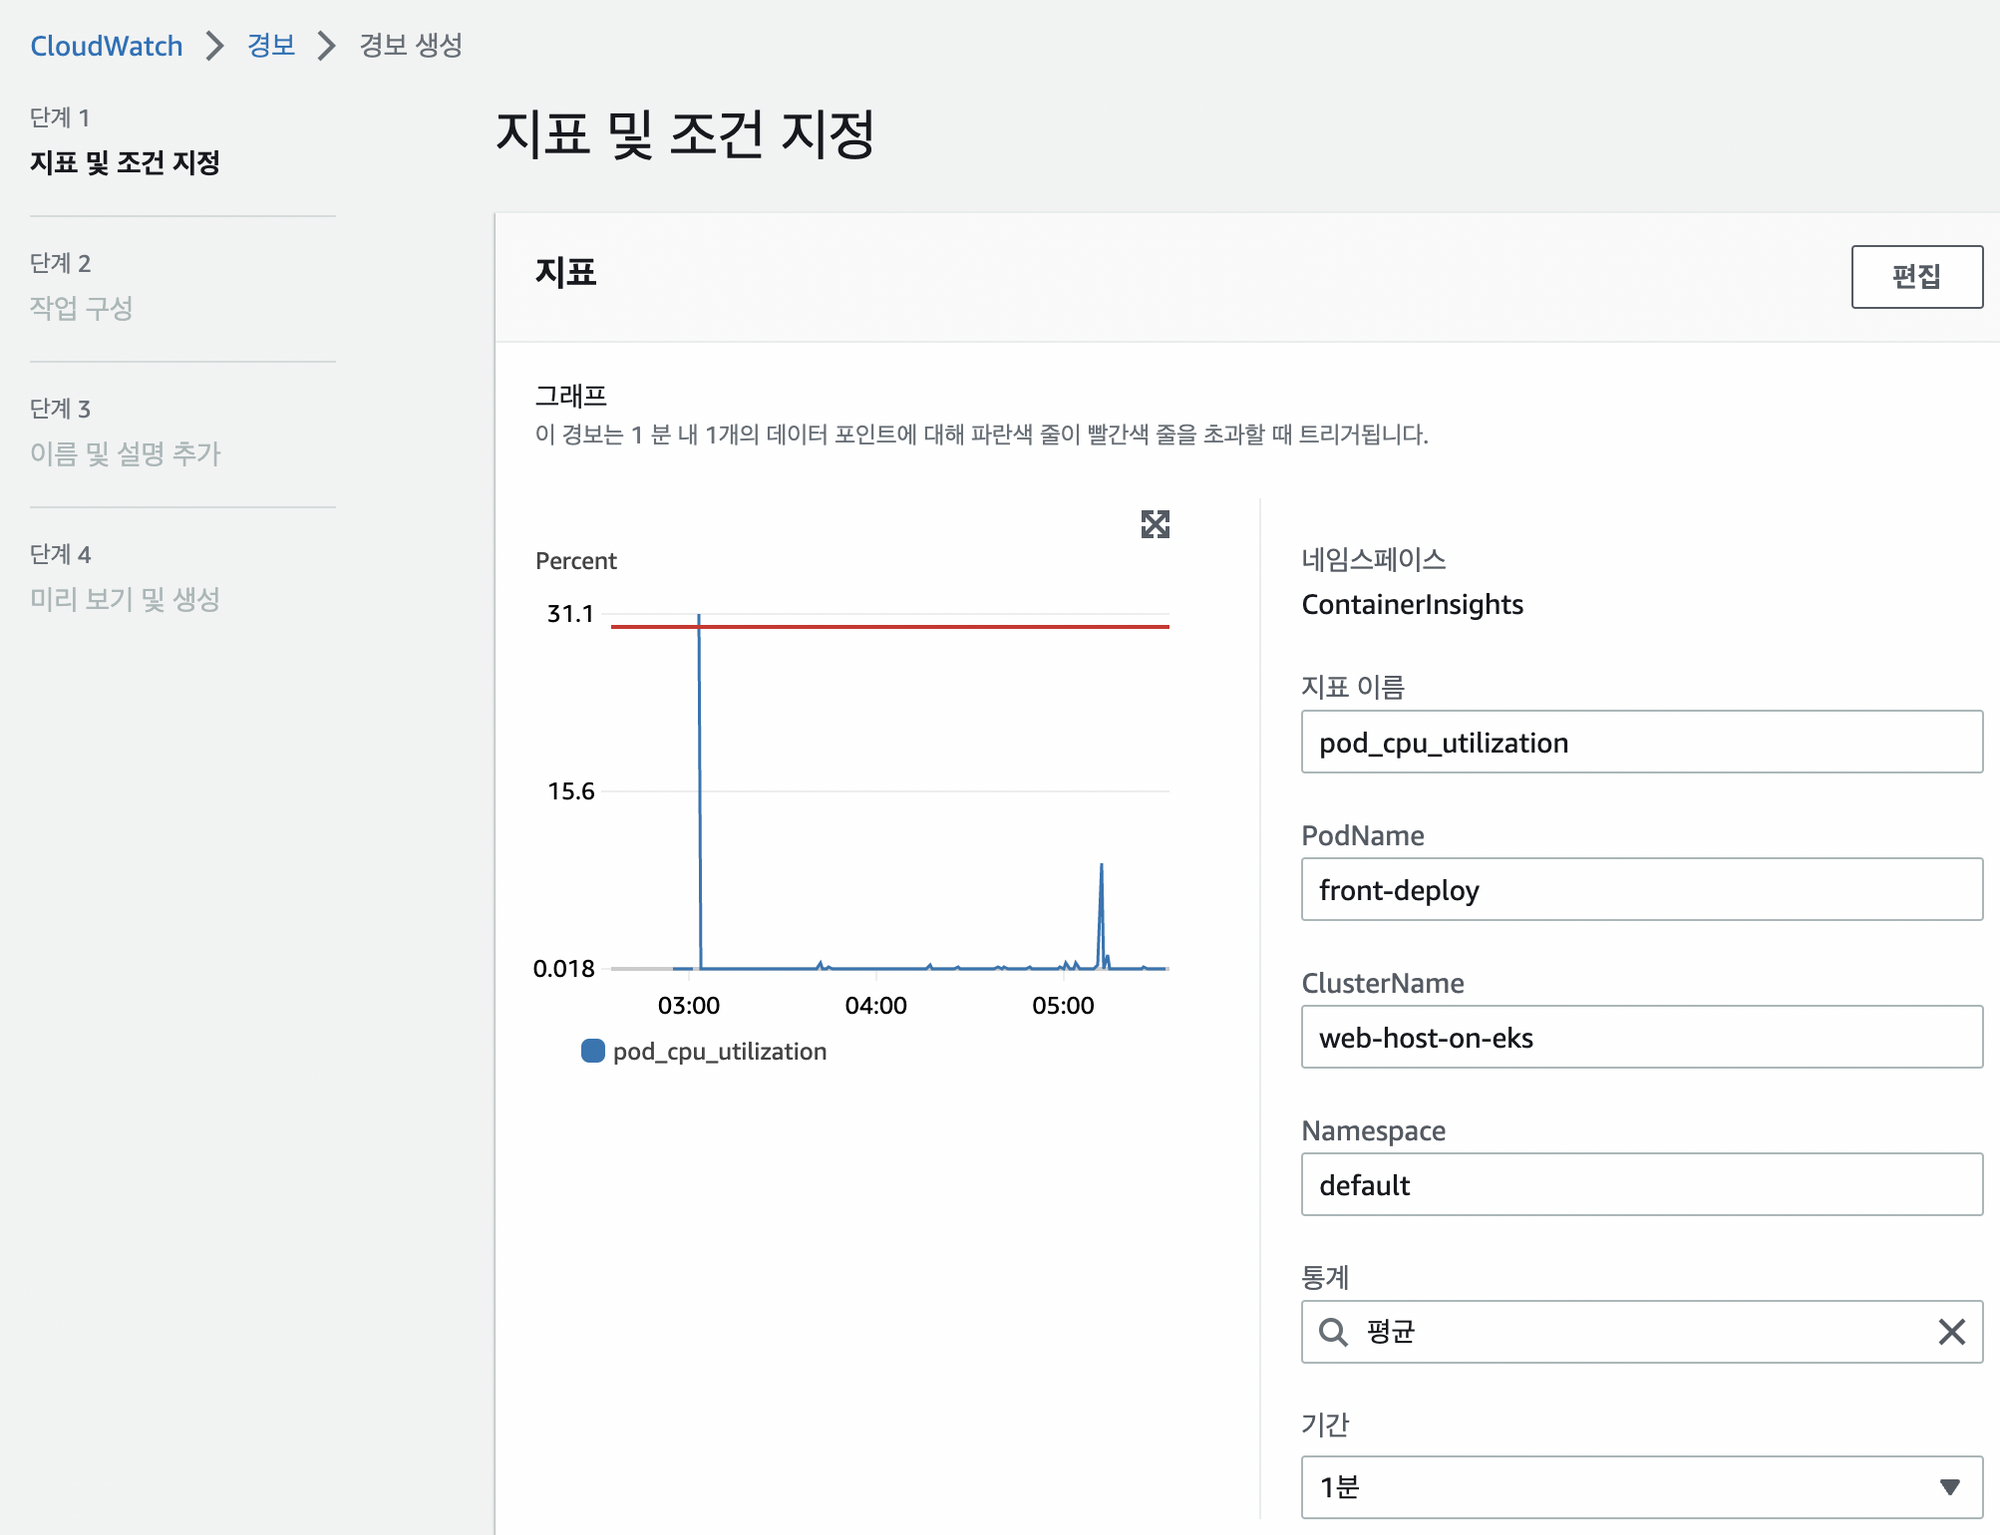
CPU사용량에 따른 모니터링 설정
- signarling deploy를 선택해서 모니터링을 하고자 함
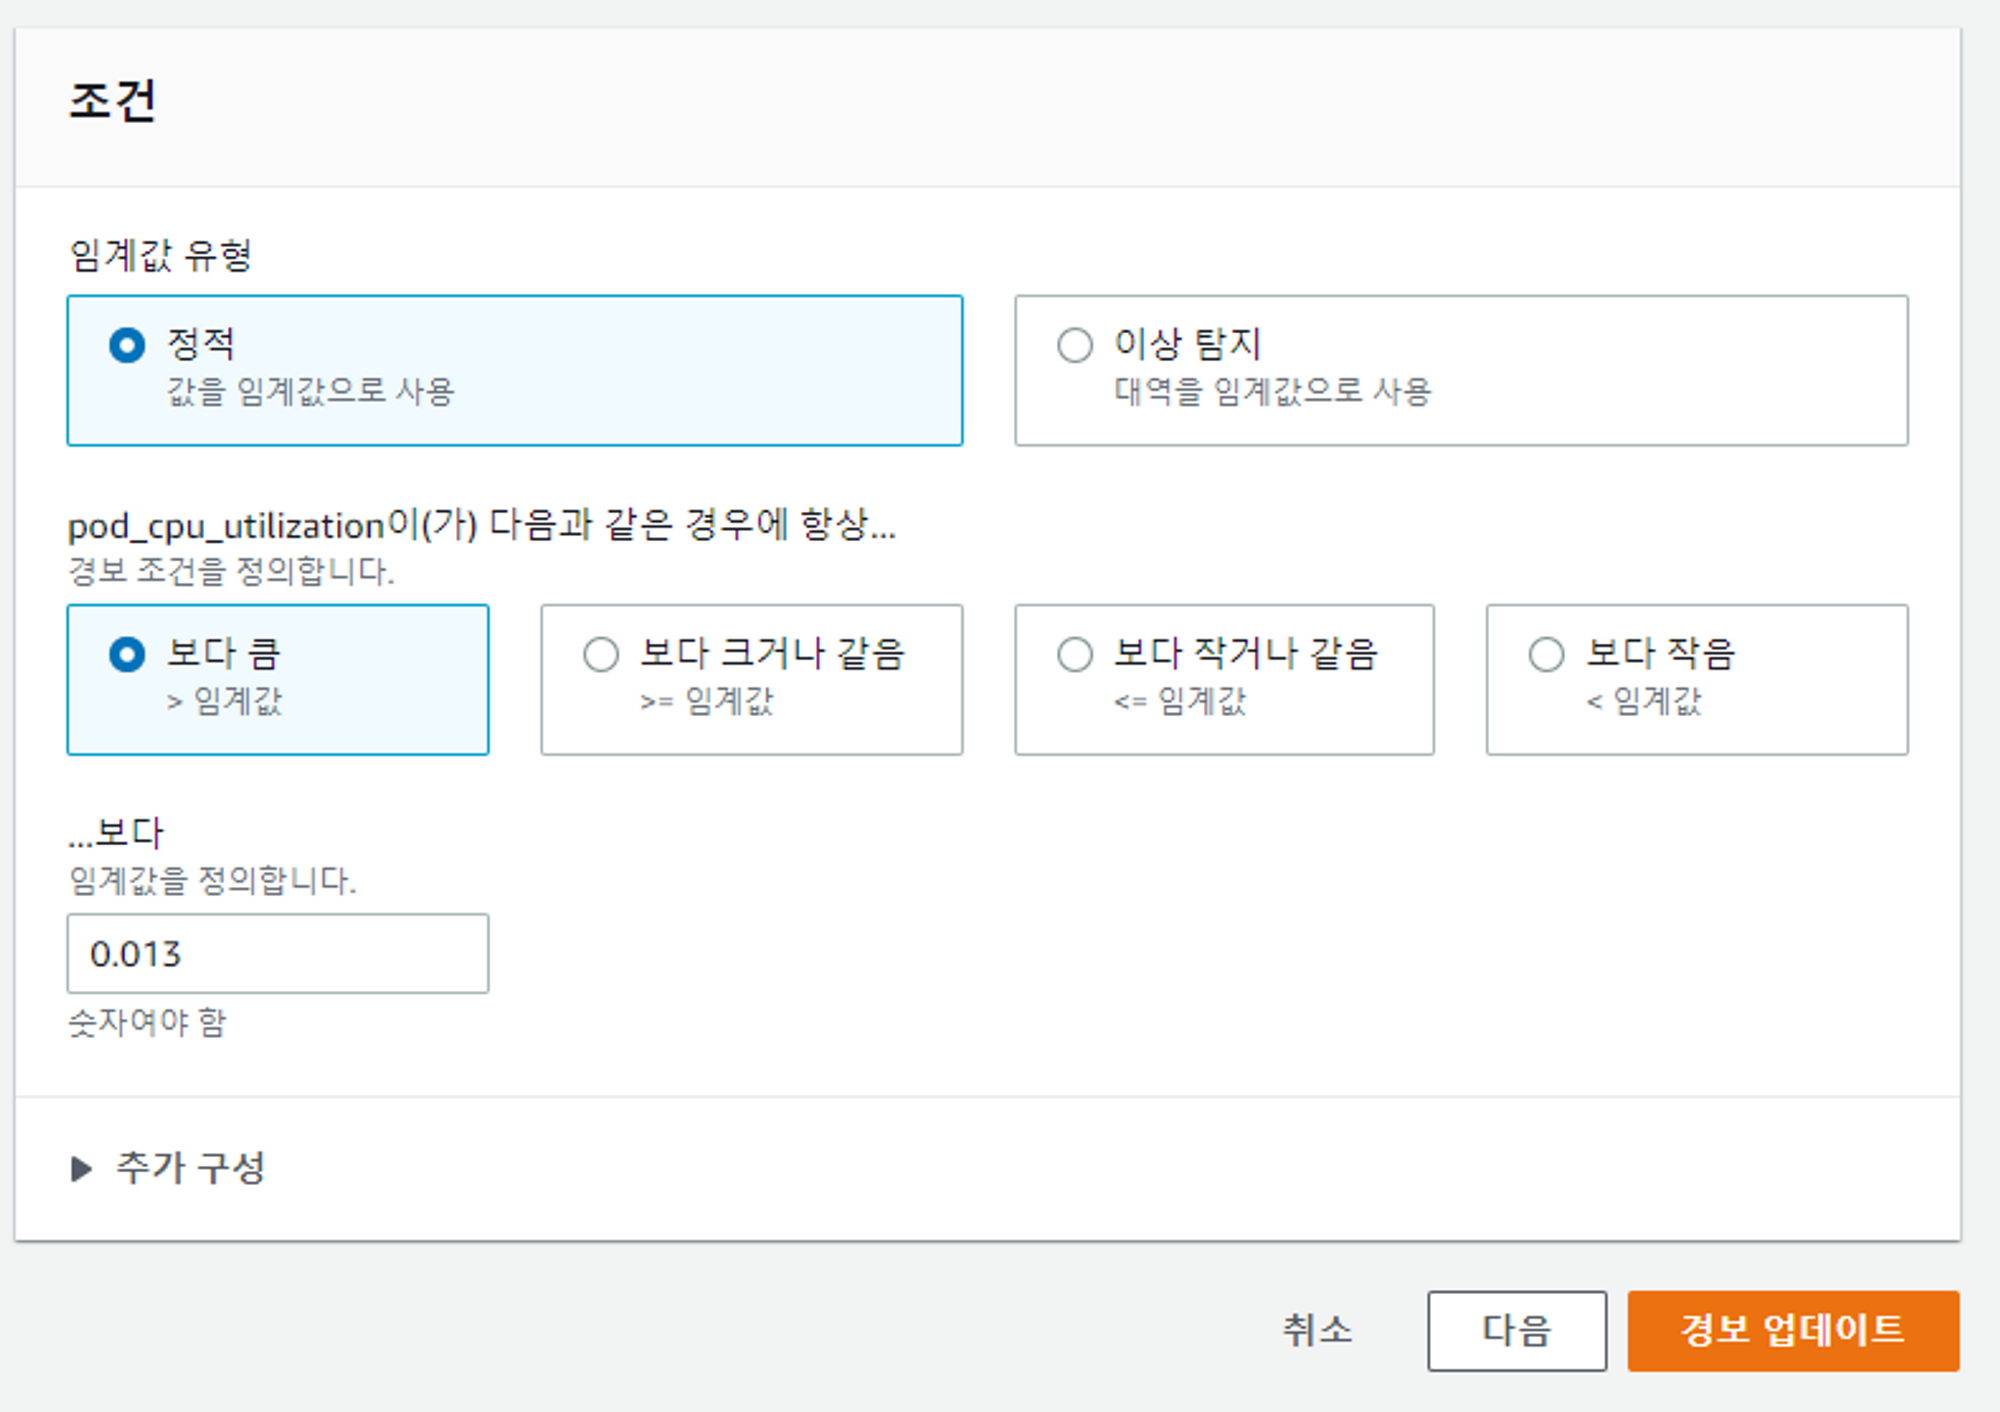
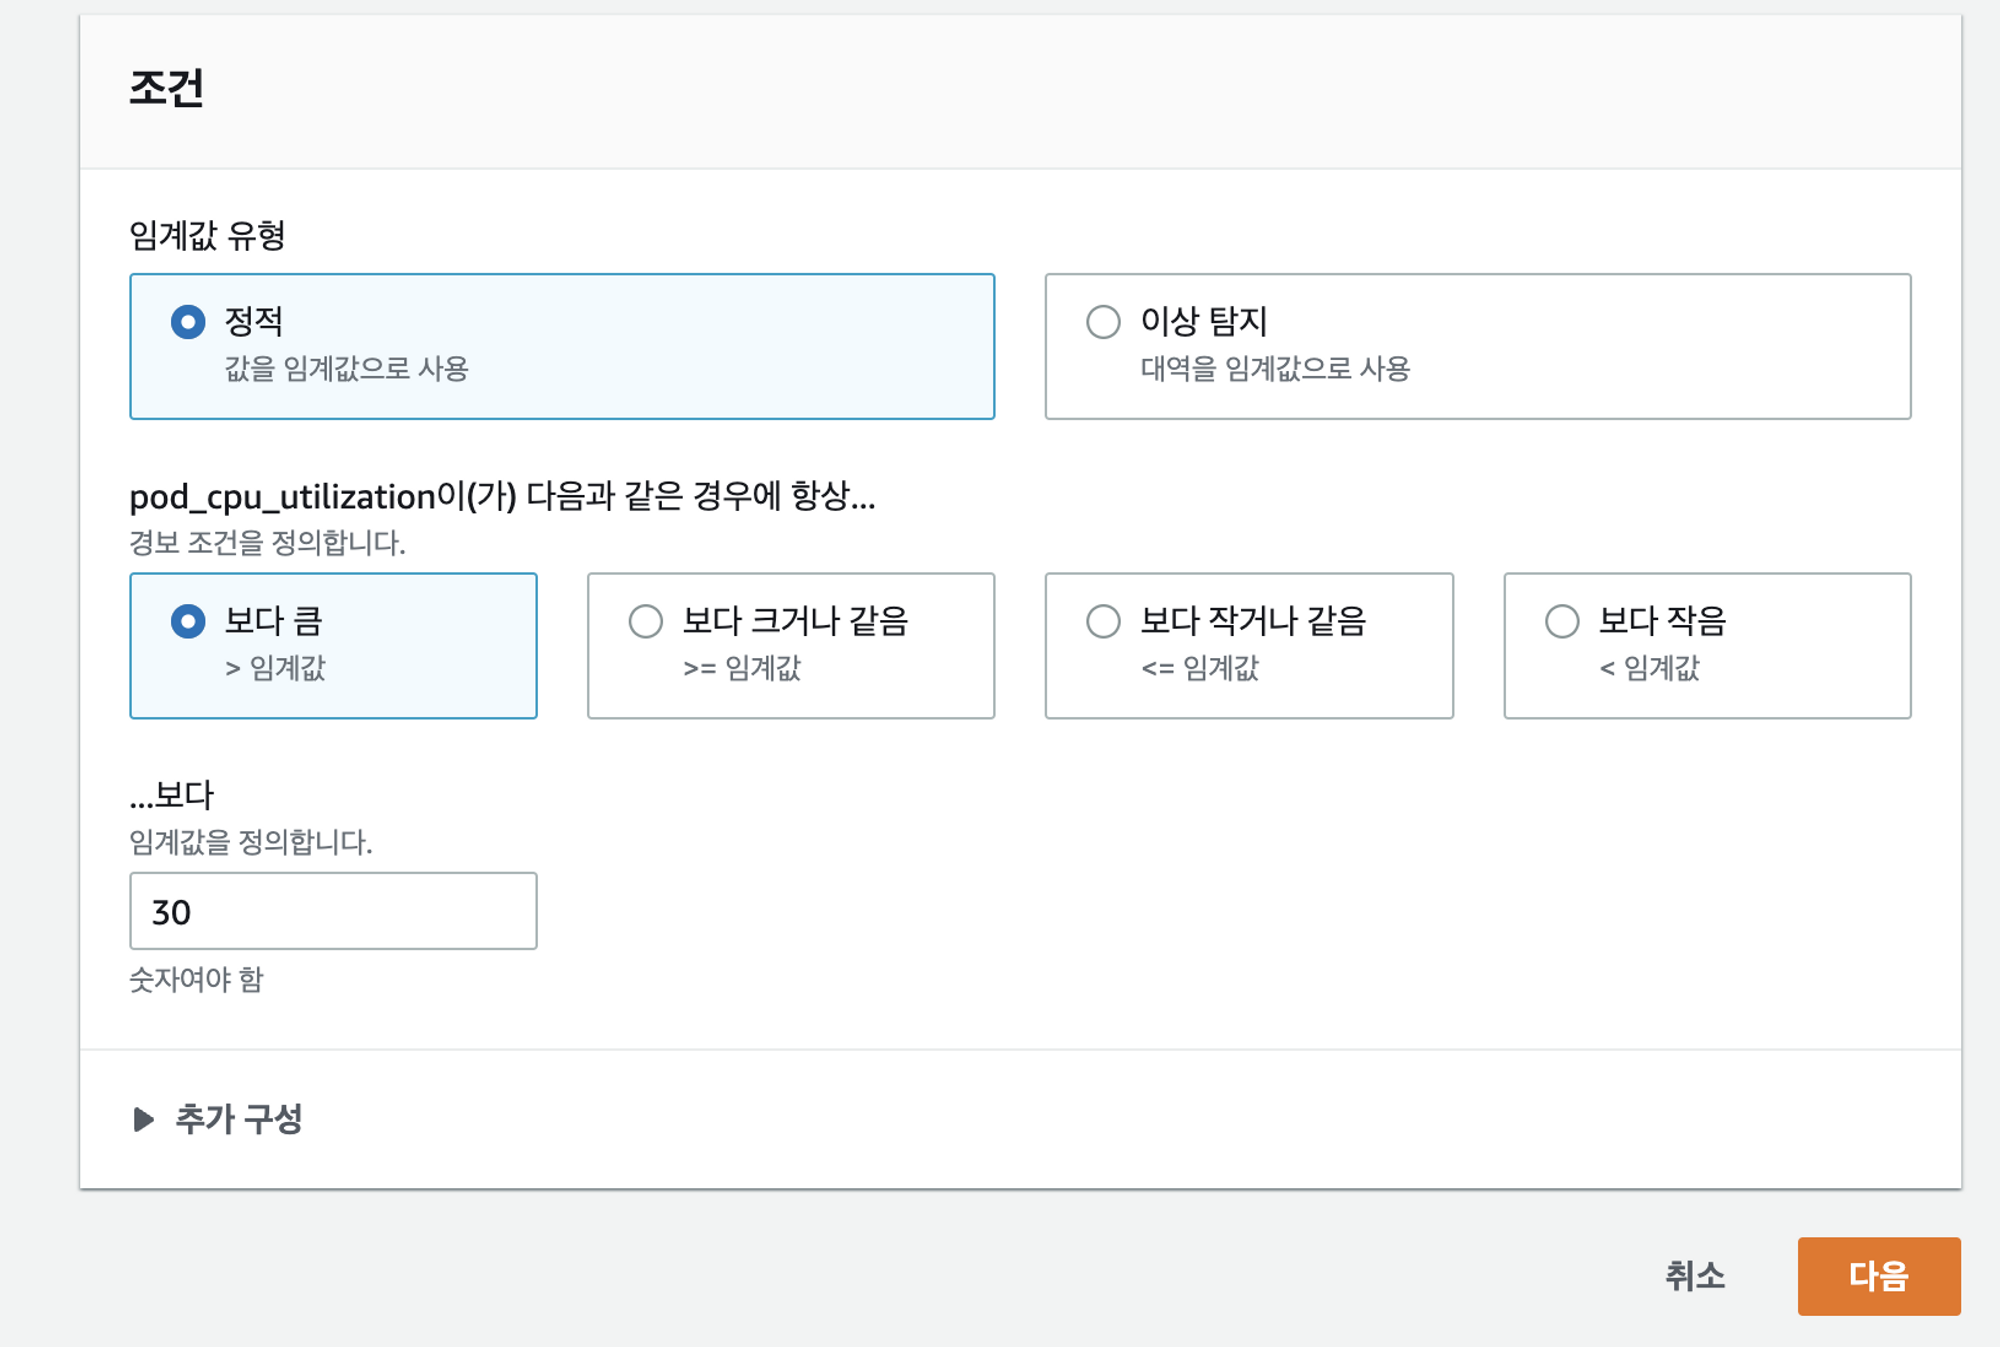
- 임계값 지정하기
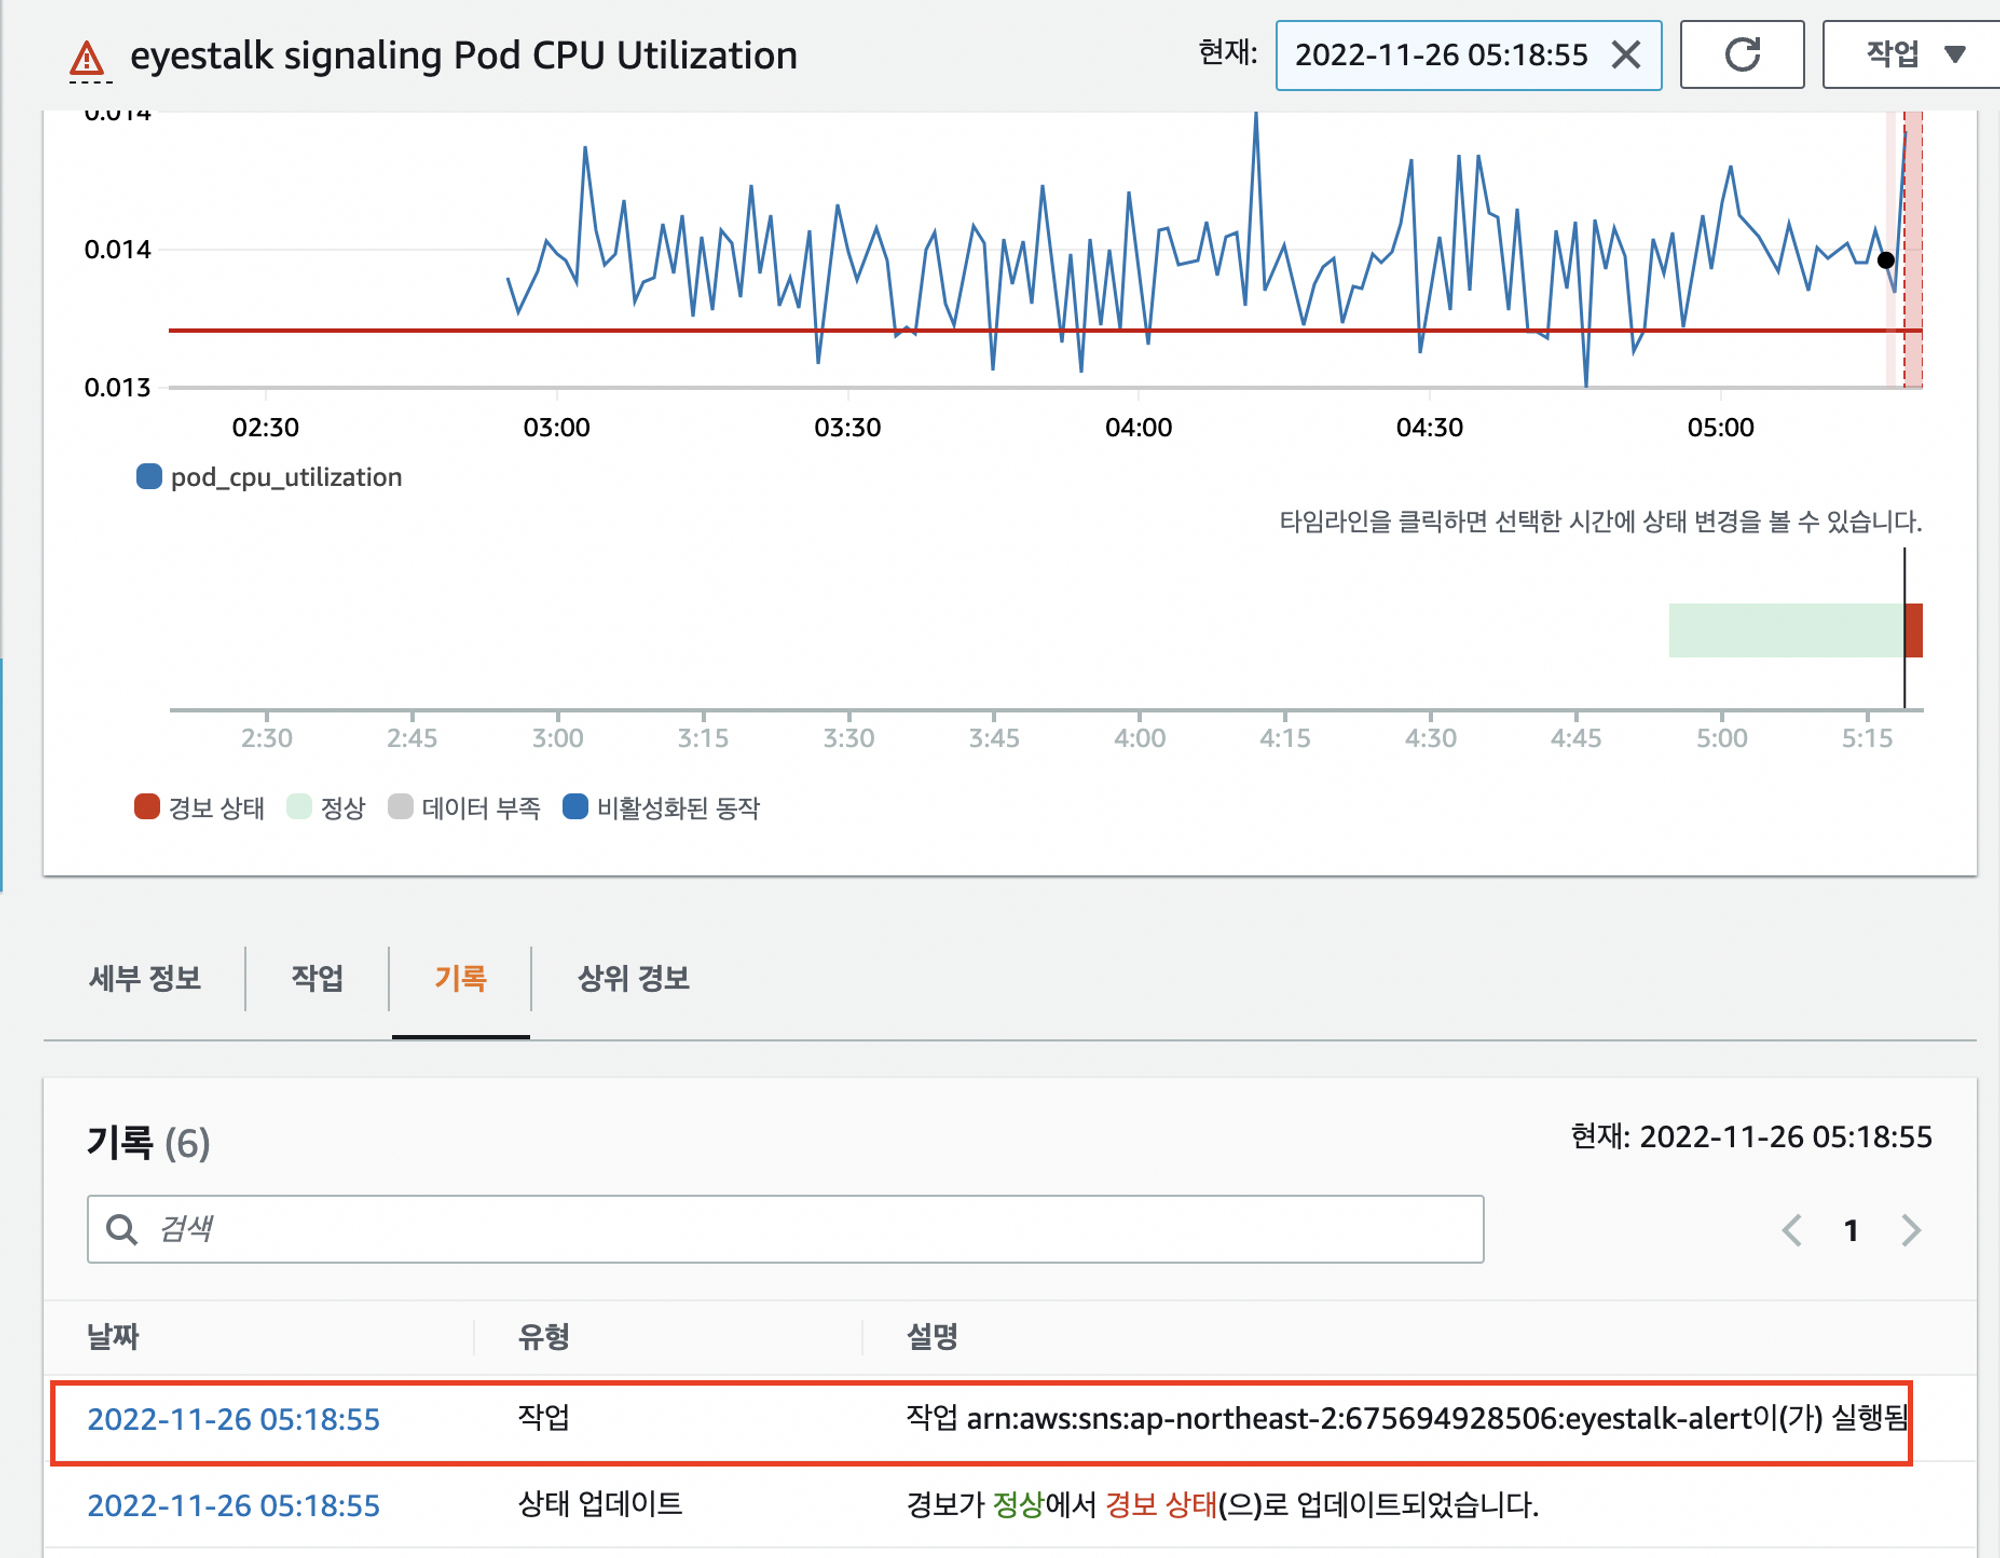
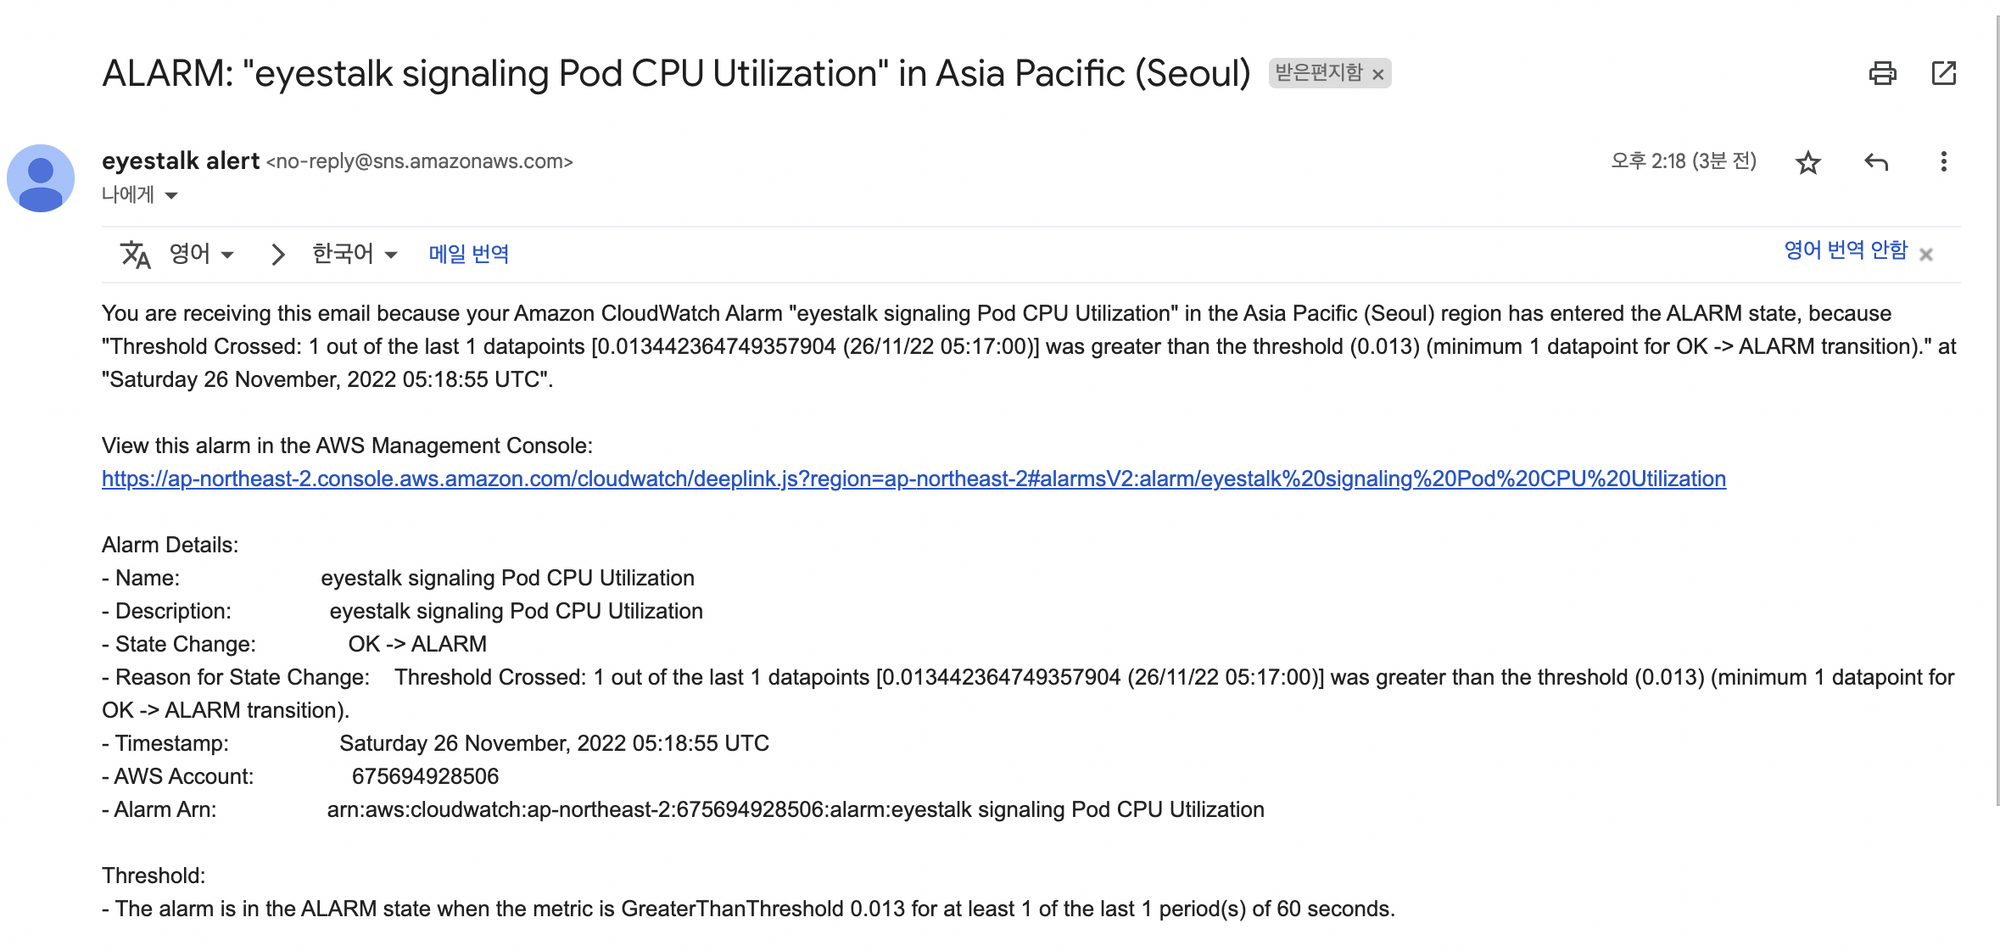
알림 확인
아직 메인서비스를 연결하고 있는 단계라 사용량을 테스트하기에는 임계값이 너무 높았다. 값을 낮춰서 테스팅하도록하자
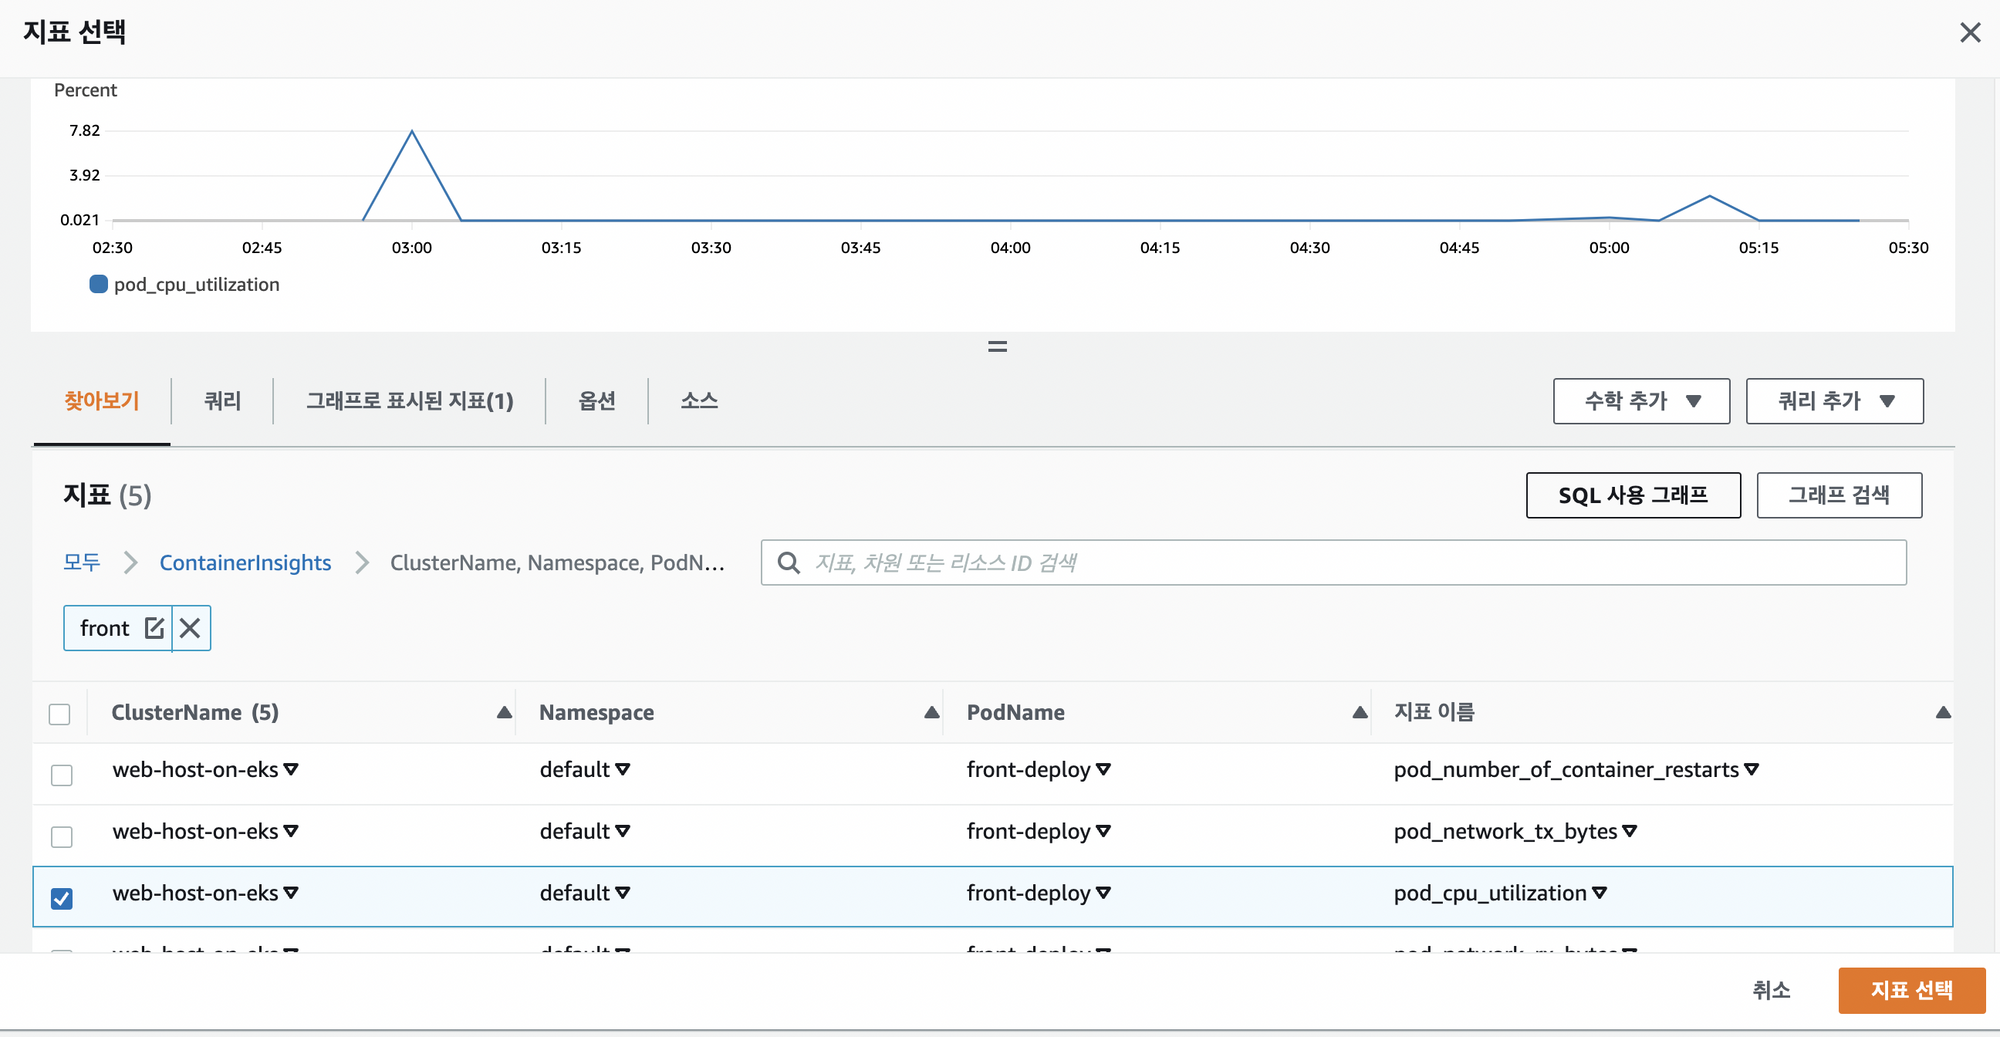
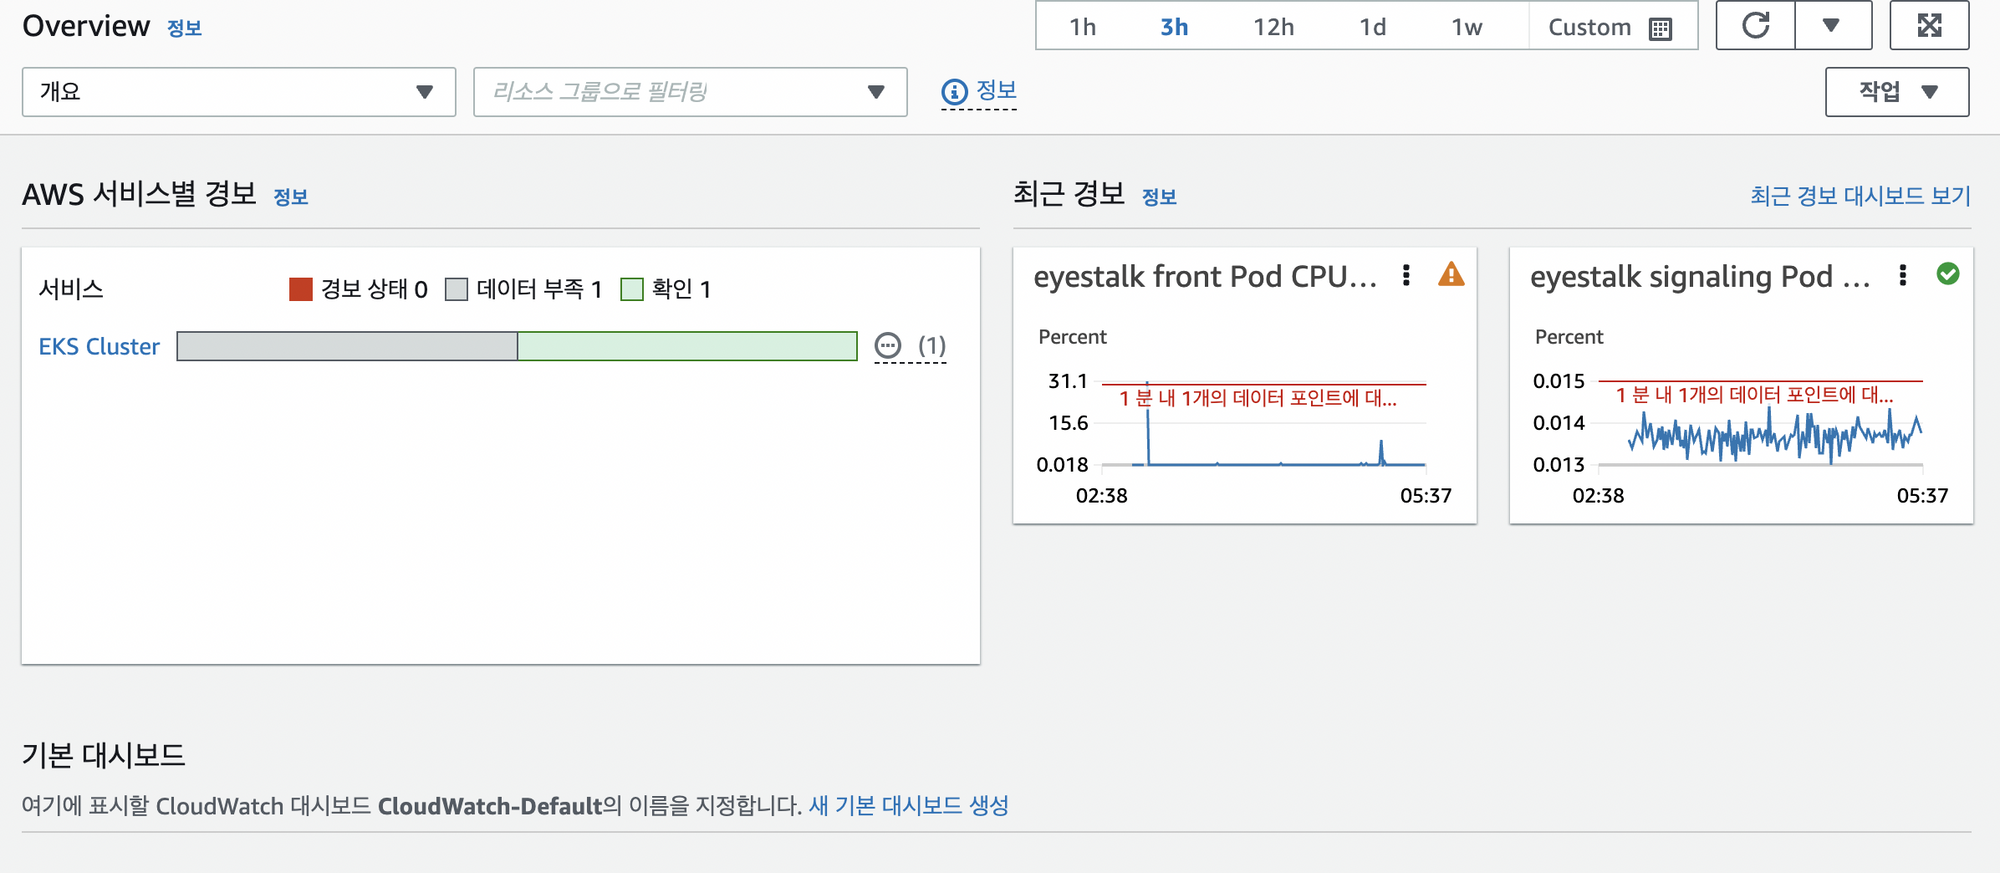
Front Deploy 사용량 Dashboard 만들기
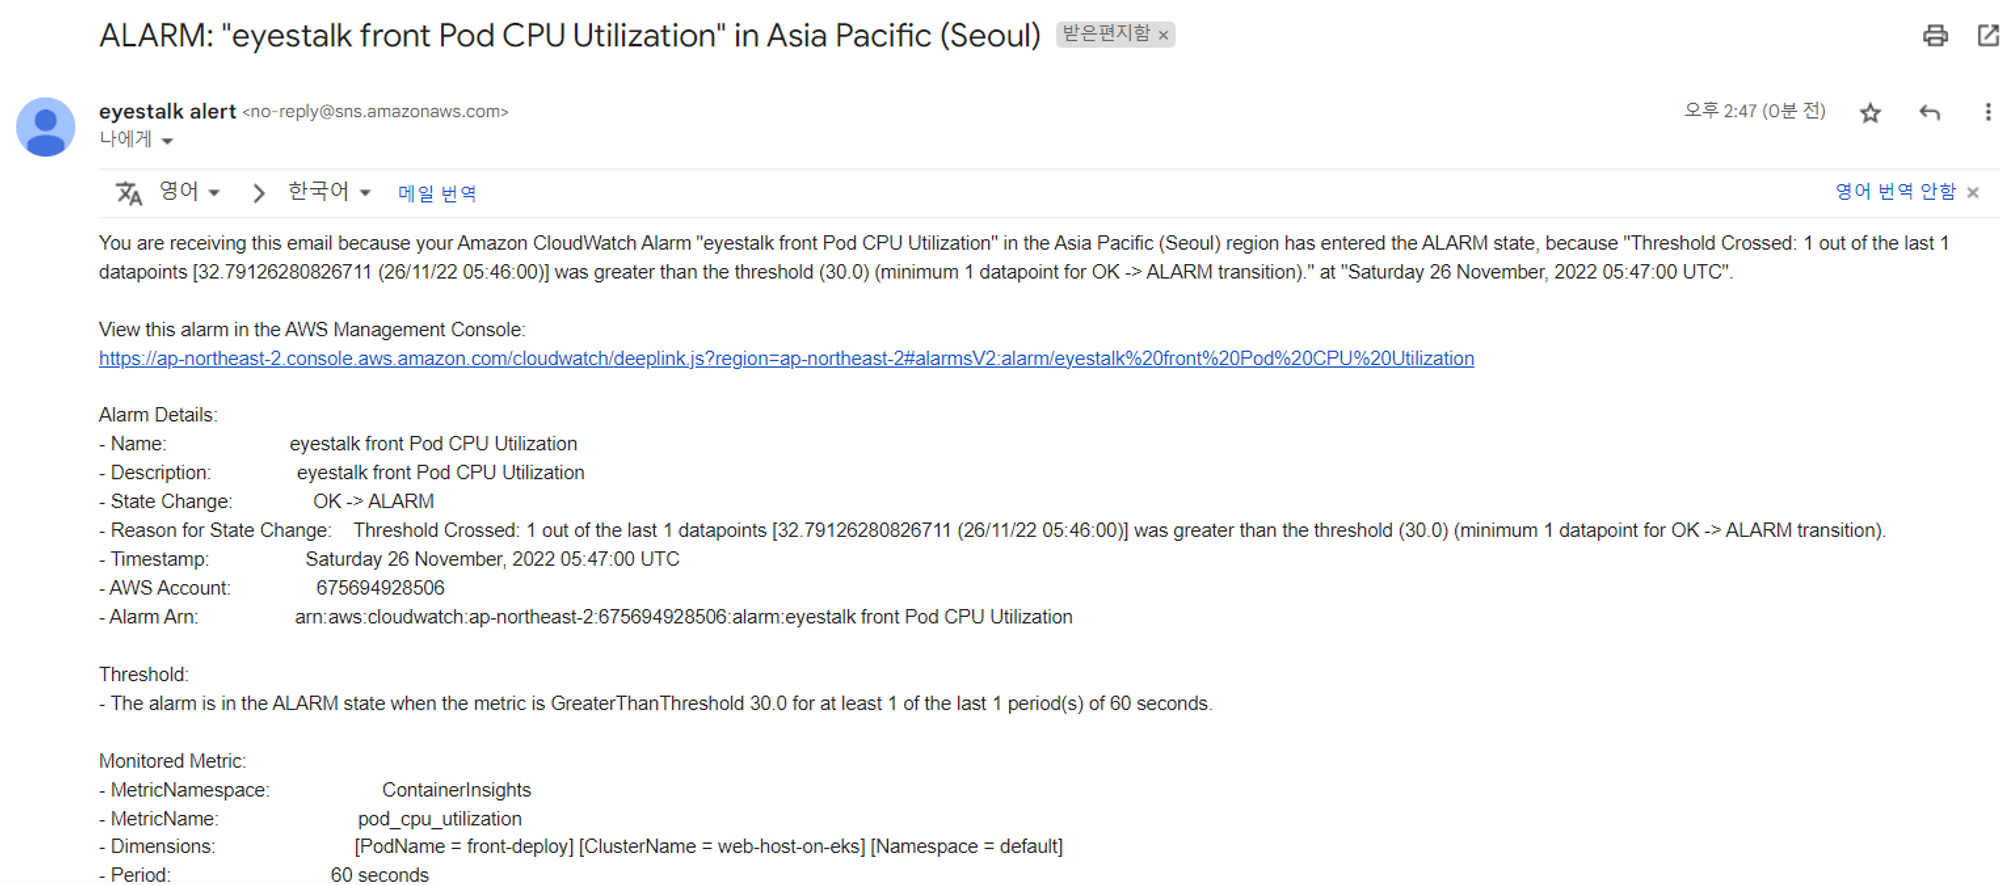
커넥션 테스트 중이기에 Signarling서비스쪽의 CPU테스트를 확인하기 어려웠다 가장 먼저 트래픽이 몰리는 front Deploy쪽을 추가하기로 함
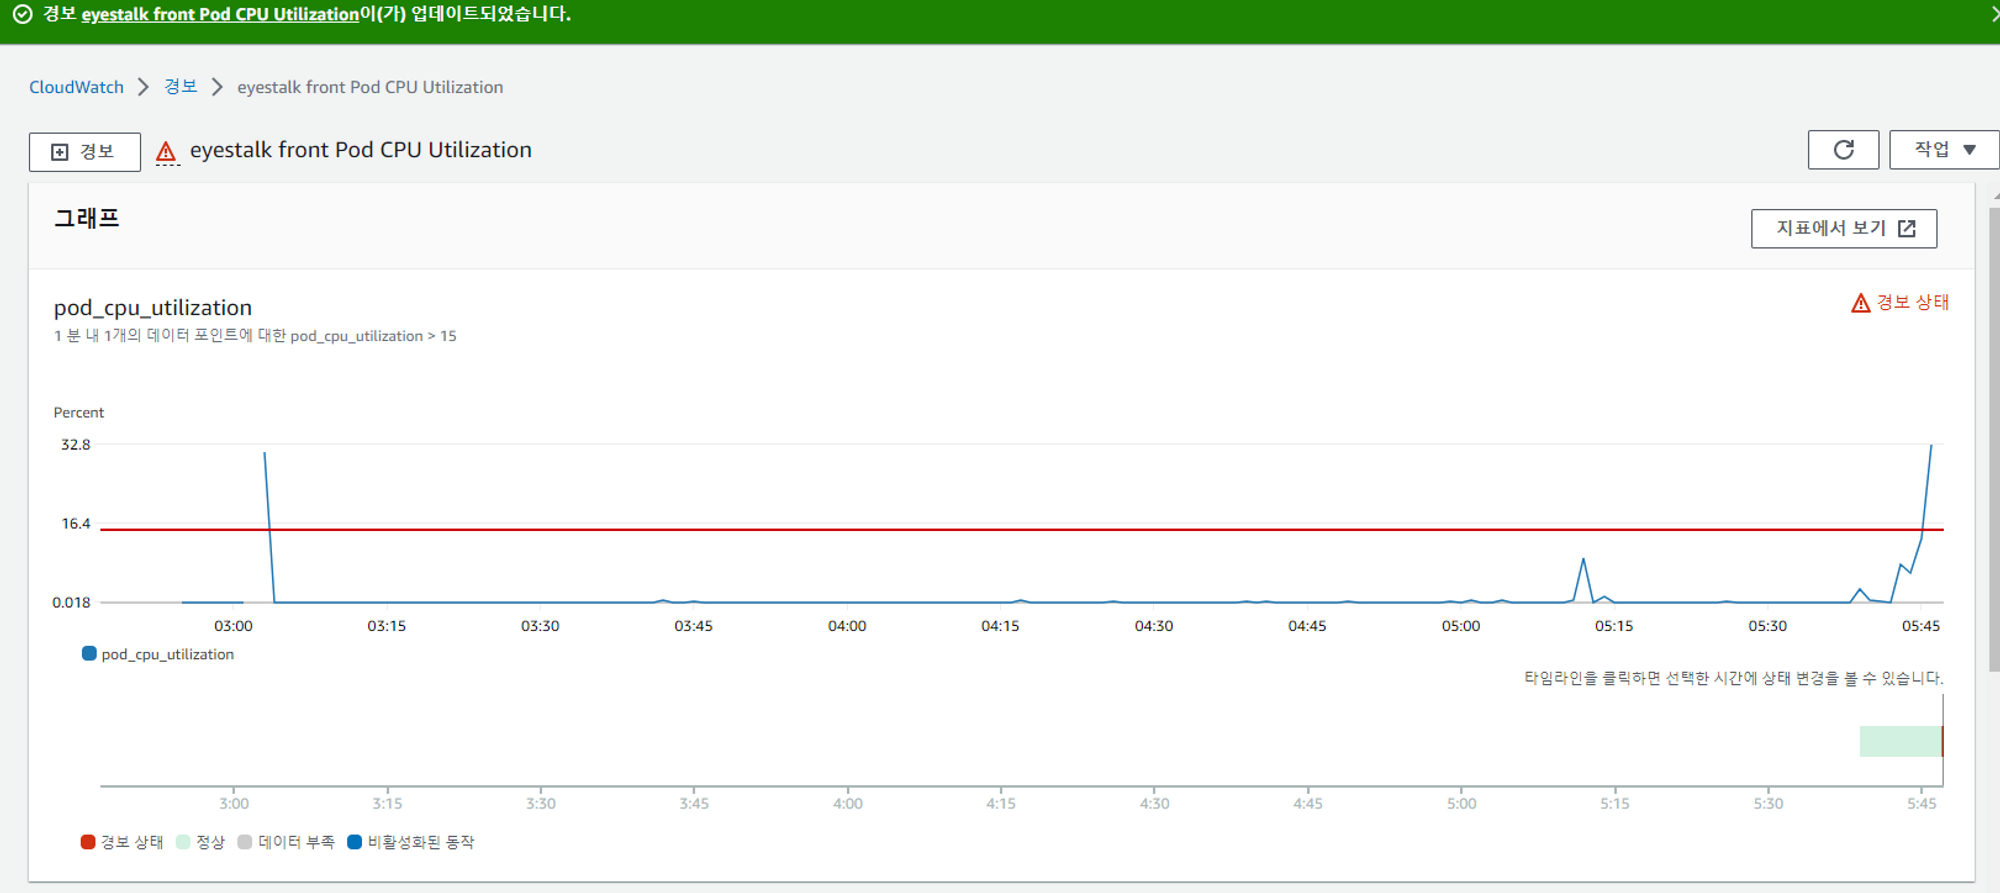
- 알림 메일 확인

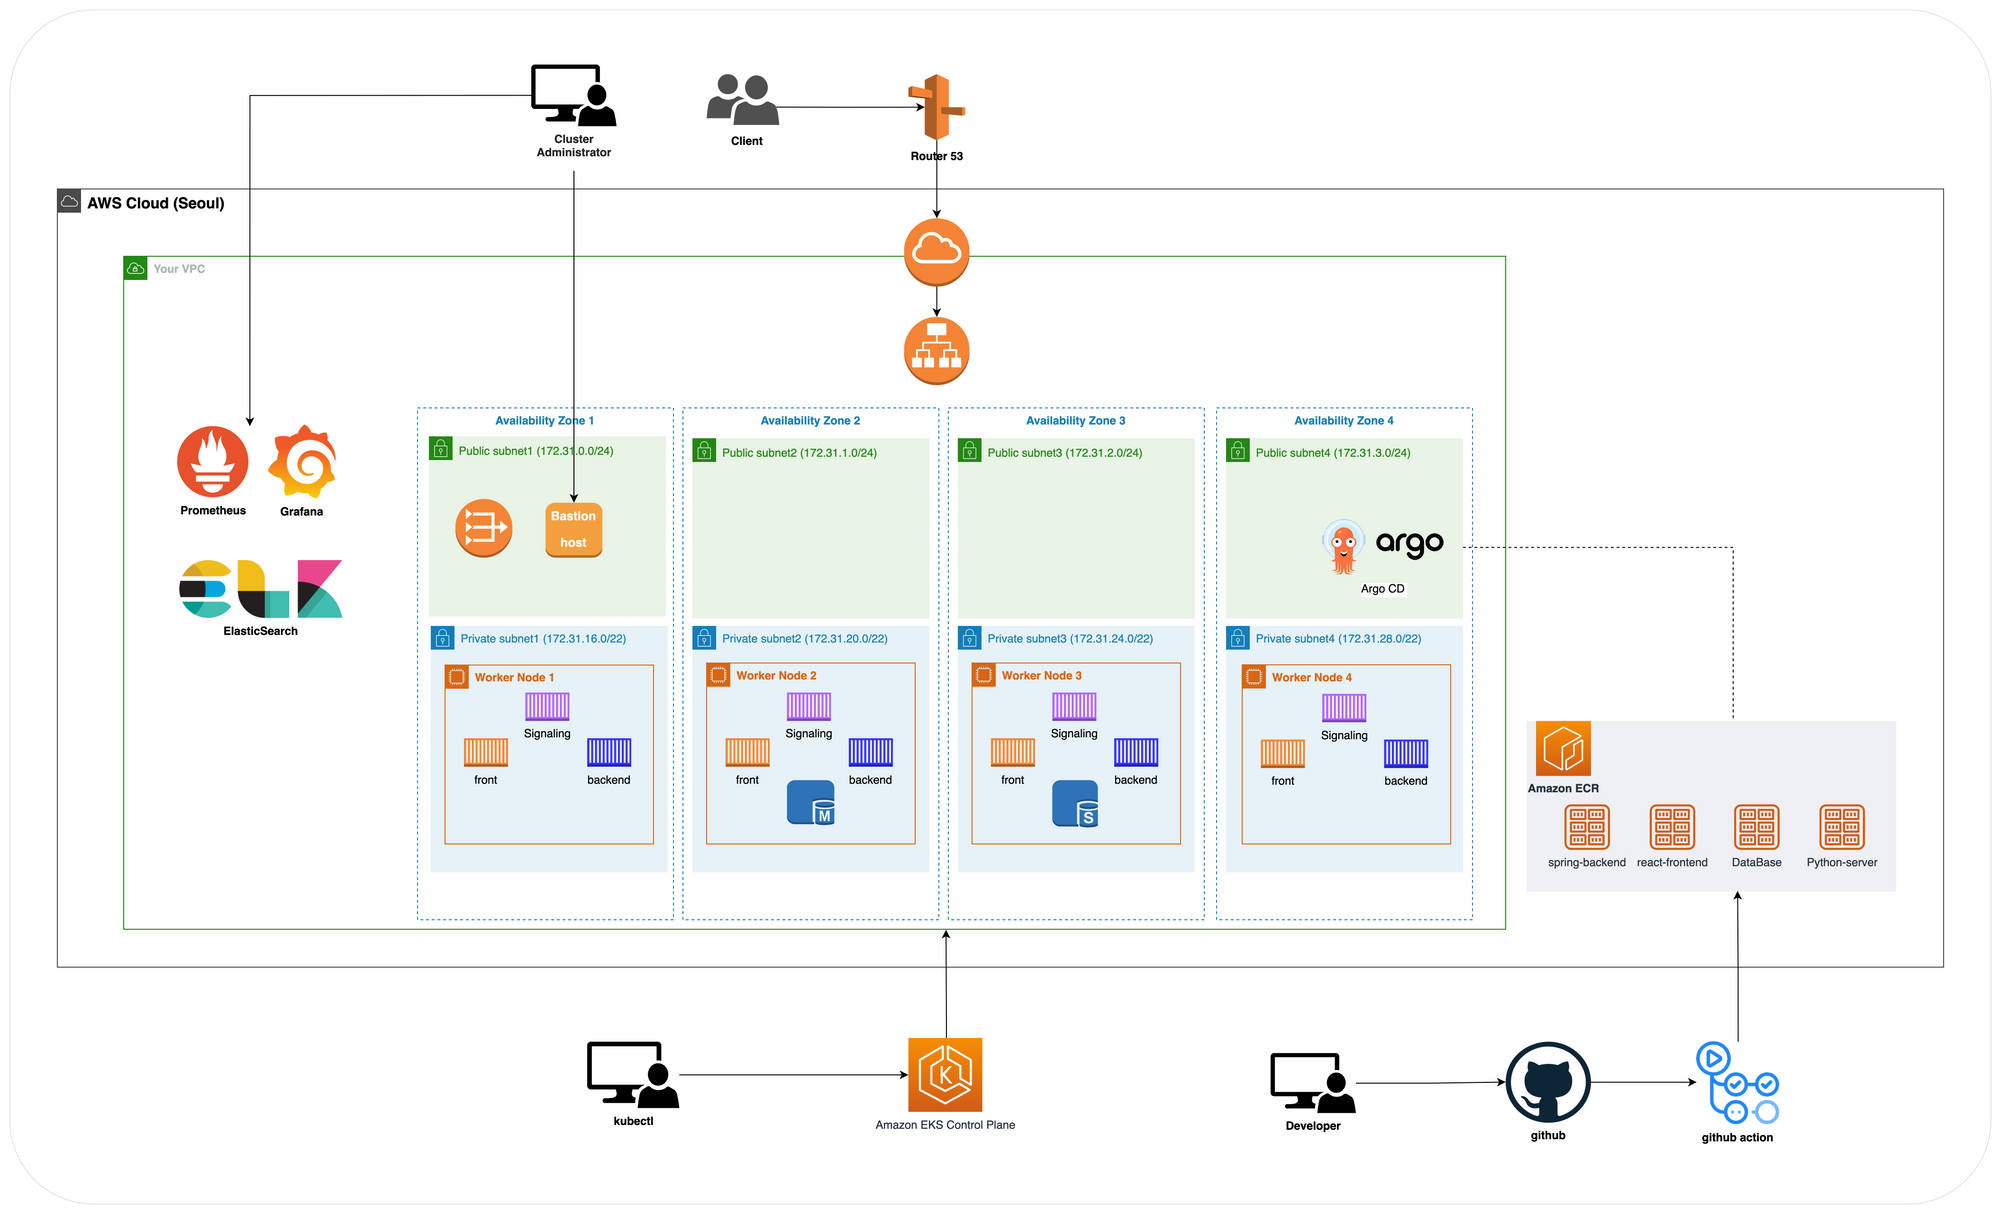
개발기록