
Thanos라고? 보라색맛 났어!
급한 사람을 위해 Prometheus & Thanos 설치부터 시작
objstore 부분이 가장 중요합니다.
저걸 안하면 Prometheus와 Thanos와의 연동이 불가능합니다.
저는 이걸 안해서 왜 안되지 하고 하루종일 삽질을 했습니다minio로 설정한 부분을 참고해서 production에 적용하실 땐
사용하실 다른 스토리지로 바꿔서 사용하세요

cat <<EOF > objstore.yaml
type: s3
config:
  bucket: thanos
  endpoint: thanos-minio:9000
  access_key: admin
  secret_key: password
  insecure: true
EOF


kubectl create namespace monitoring
kubectl create secret generic objstore-secret \
  --from-file=objstore.yml \
  --namespace monitoring

cat <<EOF > value-override-thanos-sidecar.yaml
prometheus:
  prometheusSpec:
    thanos:
      objectStorageConfig:
        key: objstore.yml
        name: objstore-secret
EOF


helm repo add prometheus-community https://prometheus-community.github.io/helm-charts
helm repo add bitnami https://charts.bitnami.com/bitnami
helm repo update

helm install thanos bitnami/thanos \
  --namespace monitoring \
  --set query.dnsDiscovery.enabled=true \
  --set "query.dnsDiscovery.sidecarsService=kube-prometheus-stack-thanos-discovery" \
  --set query.dnsDiscovery.sidecarsNamespace=monitoring \
  --set minio.enabled=true \
  --set minio.auth.rootPassword=password

helm install prometheus-operator-crds prometheus-community/kube-prometheus-stack \
  --namespace monitoring

helm install kube-prometheus-stack prometheus-community/kube-prometheus-stack \
  --values value-override-thanos-sidecar.yaml \
  --namespace monitoring \
  --set prometheus.thanosService.enabled=true \
  --set "prometheus.thanosService.clusterIP= "
Prometheus는 아는데 Thanos는?
그거 아닌가? 핑거스냅?
예로부터 Prometheus는 long-term storage는 관심사가 아니었으며
standalone을 전제로 개발되었기 때문에 HA(High Availability)를 지원하지 않았습니다.
그래서 모르면 맞아야죠 Prometheus가 있는 모니터링 노드가 죽으면
모니터링을 할 수 없는 상황에 놓이게 되고...

그리고 죽은 Prometheus를 다시 살리긴 했는데
수집됐던 메트릭이 모두 사라졌다거나 하는 도시괴담(?)도 떠돌았죠
그래서 사람들은 여러가지 방법을 찾아나서기 시작했습니다.
관리형 프로메테우스[AWS][Google][Azure] 라던가,
모니터링을 DataDog같은 서비스에 맡기기도 하고
Grafana Loki같은 대체제를 찾기도 했습니다.
그리고 Prometheus와 연동되어 인터페이스를 거의 동일하게 구현하면서
메트릭을 long-term storage에 저장할 수 있는 Thanos라는게 나오게 됩니다.
나 이거 알아! 보라색맛 났어!
그래서 설치는 했고 어떻게 보는데?
아래 명령어를 넣으면 Grafana의 External IP를 할당하게 됩니다.
(프로덕션에서는 이러지 말고 Ingress를 사용하세요)
kubectl patch service kube-prometheus-stack-grafana --namespace monitoring --patch '{"spec": {"type": "LoadBalancer"}}'Grafana의 기본 계정 정보는 아래와 같습니다
- username: admin
- password: prom-operator
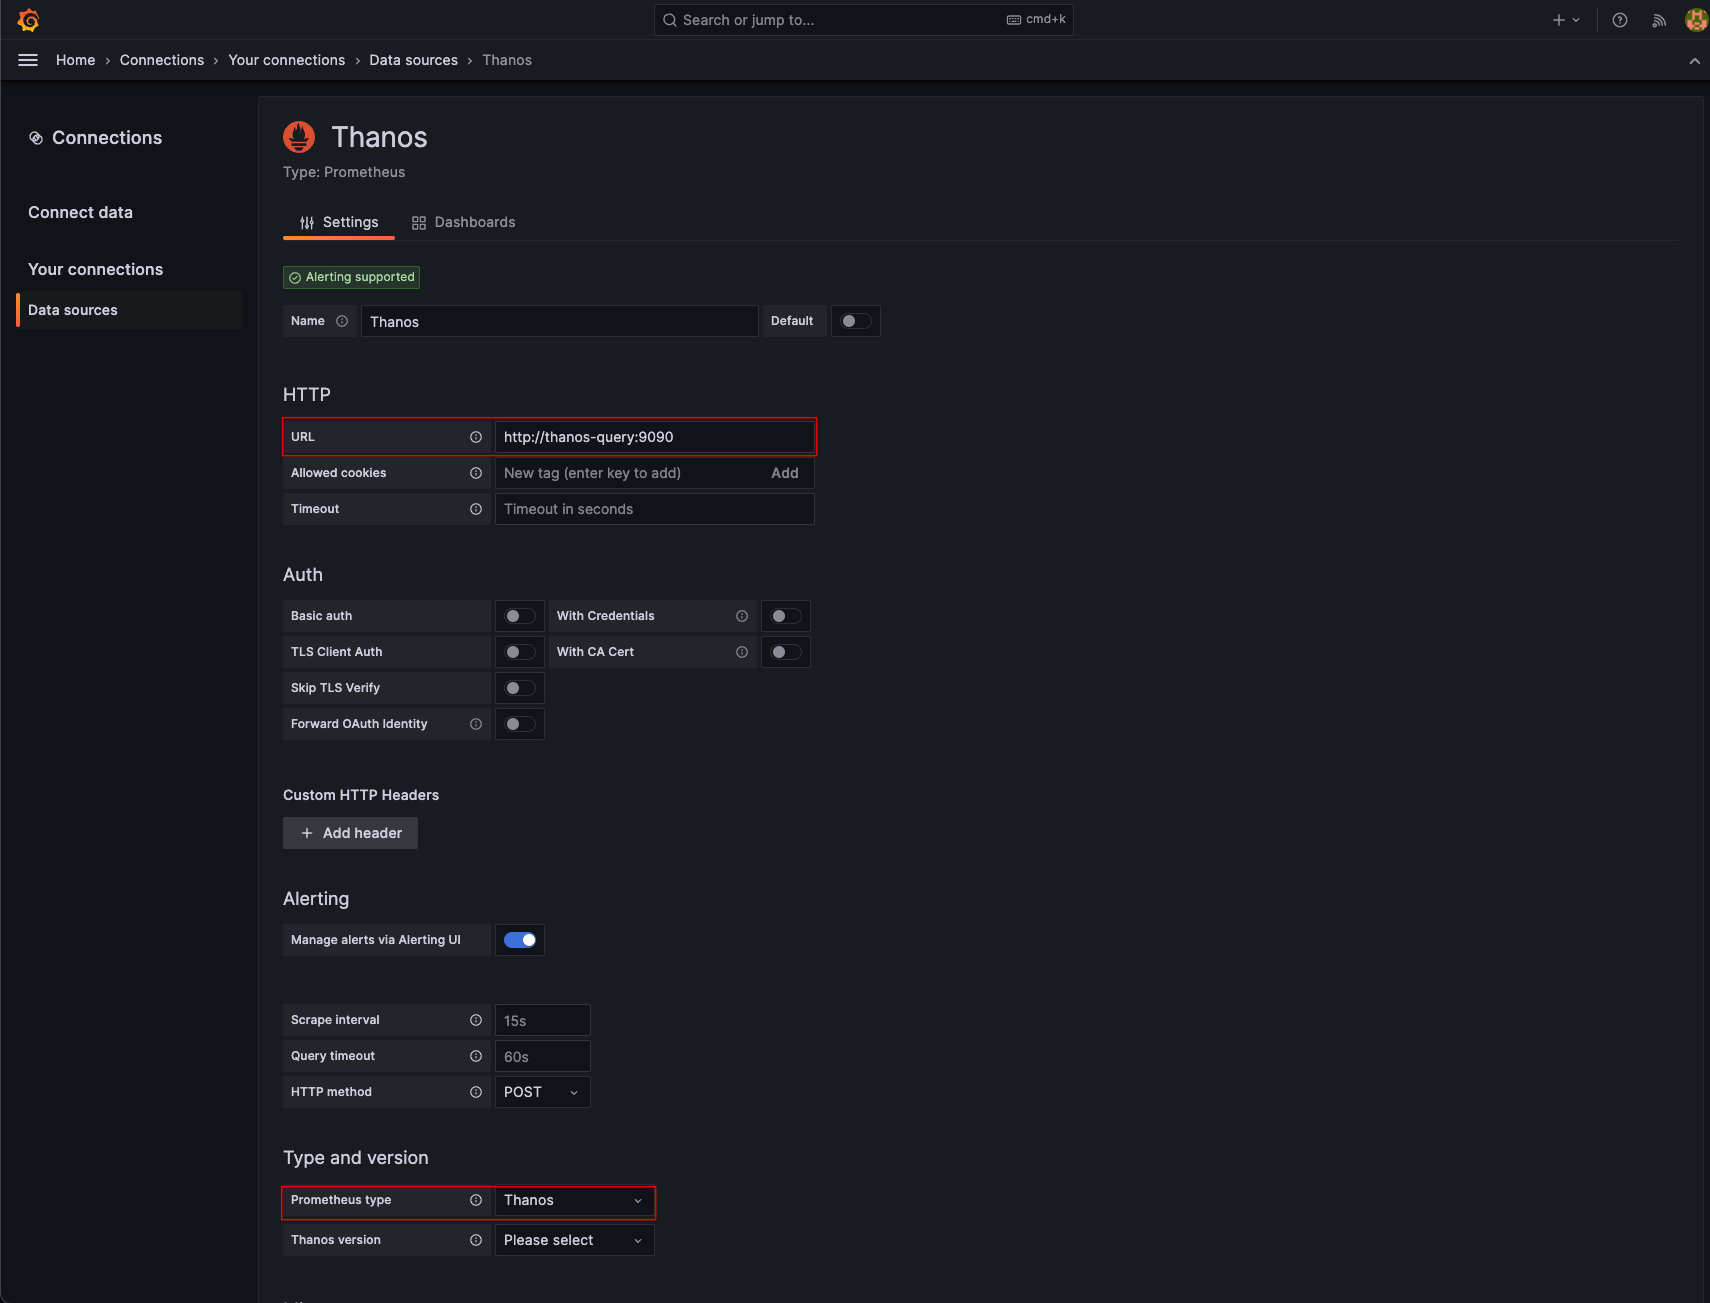
Data Source 등록하기
Data Source의 타입은 Prometheus로 선택하고 아래와 같이 설정을 입력해줍니다.
- URL: http://thanos-query:9090
- Prometheus type: Thanos
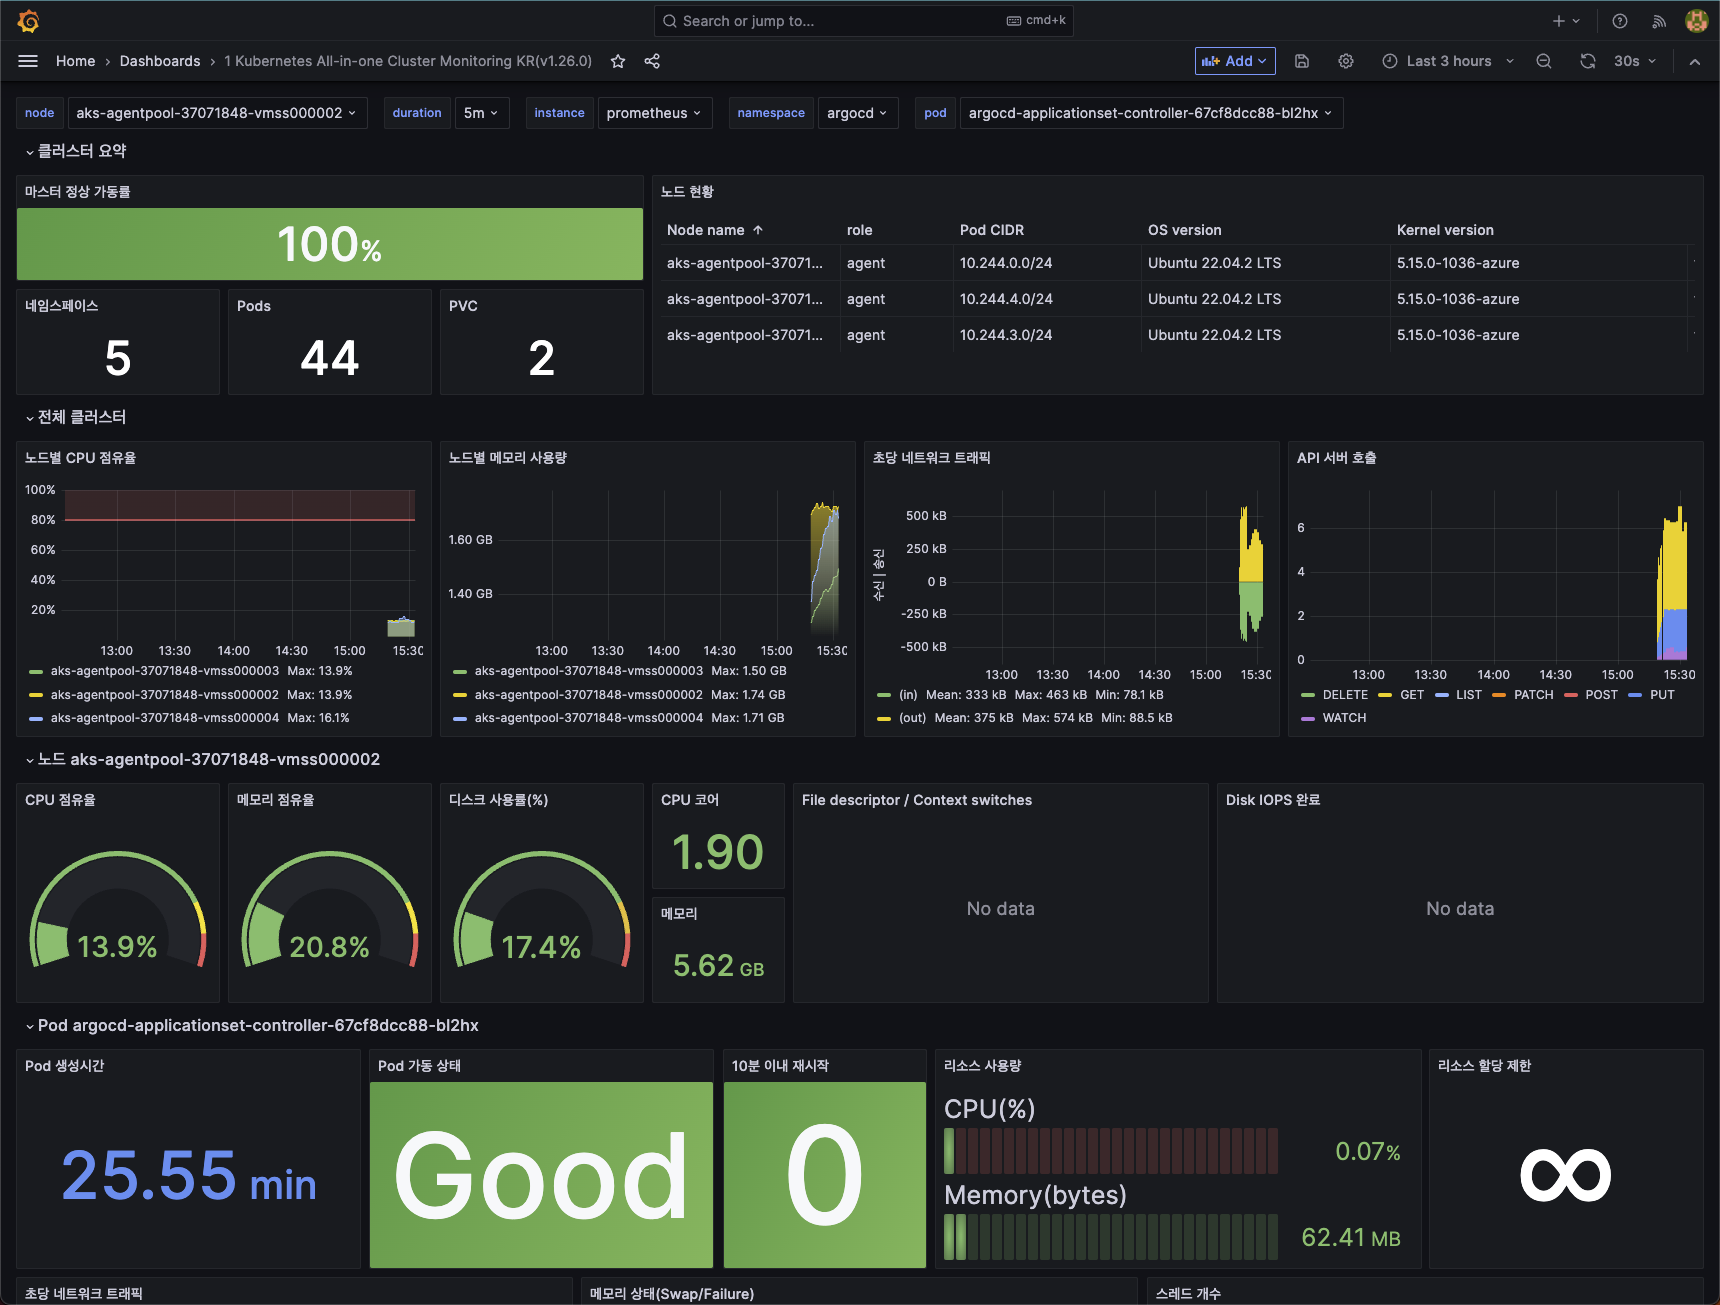
대시보드 추가하기
추천 대시보드 ID: 17900
필요한 것들이 잘 나오기도 하고 한글로 되어있어서 참 좋습니다.

5개의 댓글


traffic rally features vibrant graphics and realistic sound, providing an enjoyable gaming experience for users.
썸네일이 충격적이네요