Cilium 스터디 - Networking 노드에 파드들간 통신 1
3주차 학습정리 - Cilium Networking: 노드간 파드 통신의 상세 메커니즘
🌐 Cilium 네트워킹 아키텍처 심화 분석
1. 실습 환경 구성 및 아키텍처
1.1 실습 환경 개요
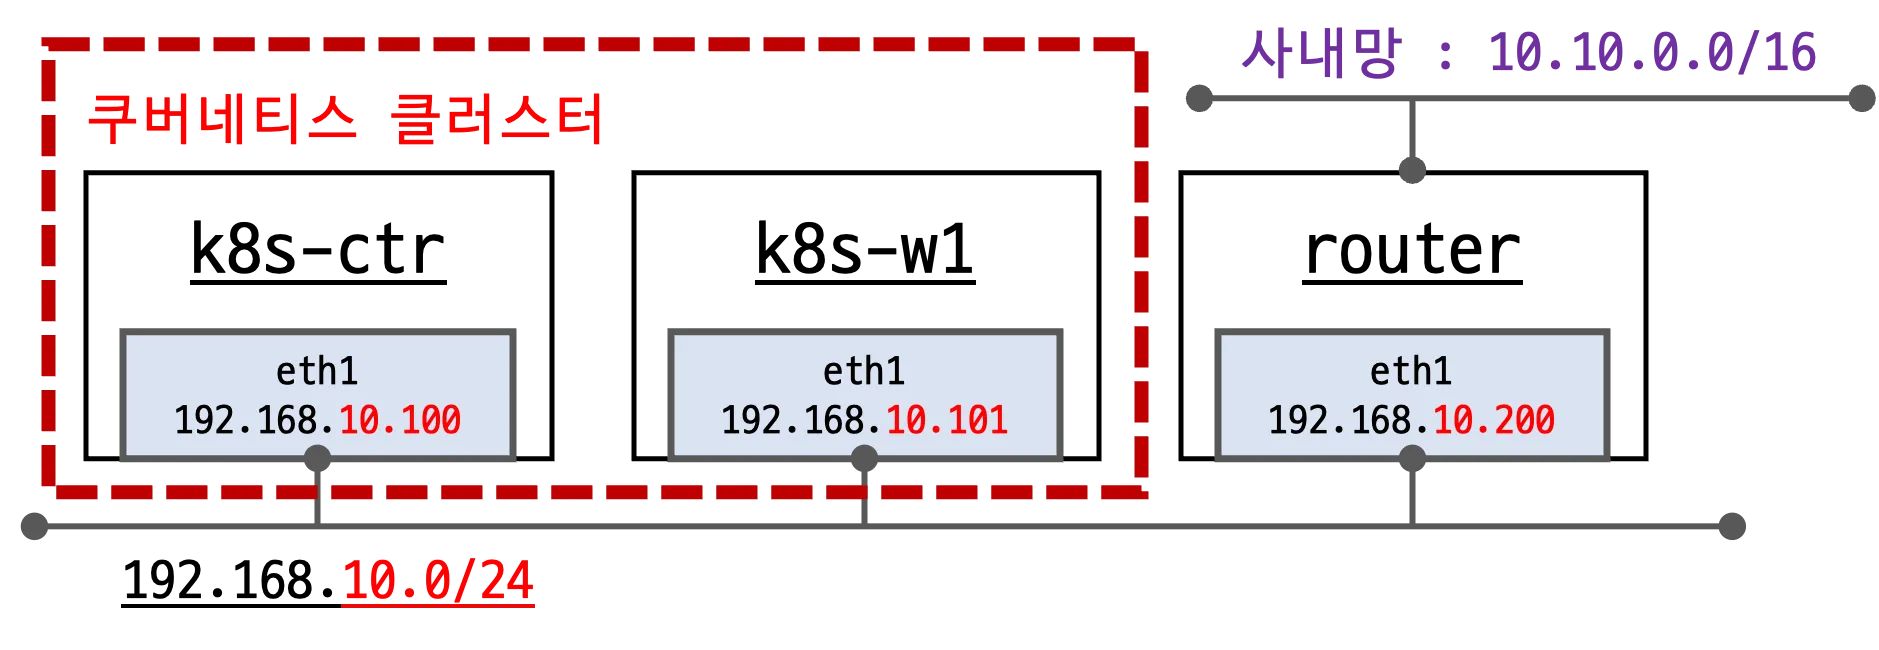
┌─────────────────┐    ┌─────────────────┐    ┌─────────────────┐
│   k8s-ctr       │    │    k8s-w1       │    │     router      │
│ (Control Plane) │    │  (Worker Node)  │    │  (외부 서버)     │
├─────────────────┤    ├─────────────────┤    ├─────────────────┤
│ eth0: NAT       │    │ eth0: NAT       │    │ eth0: NAT       │
│ eth1:192.168.10.│    │ eth1:192.168.10.│    │ eth1:192.168.10.│
│      100        │    │      101        │    │      200        │
│                 │    │                 │    │                 │
│ PodCIDR:        │    │ PodCIDR:        │    │ loop1: 10.10.1. │
│ 172.20.0.0/24   │    │ 172.20.1.0/24   │    │        200/24   │
│                 │    │                 │    │ loop2: 10.10.2. │
│                 │    │                 │    │        200/24   │
└─────────────────┘    └─────────────────┘    └─────────────────┘
         │                       │                       │
         └───────────────────────┼───────────────────────┘
                                 │
                    Host-Only Network (192.168.10.0/24)
                                 │
                      ┌─────────────────┐
                      │ 사내망 시뮬레이션  │
                      │ 10.10.0.0/16    │
                      └─────────────────┘
핵심 구성 요소:
- k8s-ctr: Control Plane 노드 (192.168.10.100)
- k8s-w1: Worker 노드 (192.168.10.101)
- router: 외부 사내망 시뮬레이션 서버 (192.168.10.200)
- loop1 인터페이스: 10.10.1.200/24
- loop2 인터페이스: 10.10.2.200/24
- 사내망 10.10.0.0/16 대역과의 통신 시뮬레이션
1.2 실습 환경 배포
Vagrant 기반 자동화 배포
vagrant up
**배포 과정 상세 분석:**

1. **init_cfg.sh**: 기본 시스템 설정 및 쿠버네티스 구성 요소 설치
2. **k8s-ctr.sh**: kubeadm 클러스터 초기화 및 Cilium CNI 설치
3. **k8s-w.sh**: Worker 노드를 클러스터에 조인
4. **route-add1.sh**: 사내망 통신을 위한 라우팅 설정
5. **router.sh**: 외부 서버 설정 및 웹 서버 구동

#### 1.3 확장된 모니터링 도구

**Termshark - 네트워크 패킷 분석 도구**

```bash
# Termshark 설치 (이미 설치되어 있음)
export DEBIAN_FRONTEND=noninteractive
apt-get install -y termshark

# 기본 사용법
# 로컬 pcap 파일 검사
termshark -r test.pcap

# 인터페이스에서 실시간 패킷 캡처
termshark -i eth0 icmp

# 특정 프로토콜 필터링
termshark -i eth1 'tcp port 80'
k9s - 향상된 쿠버네티스 CLI 도구
# k9s는 이미 설치되어 있음
k9s

# 주요 단축키
# :pods    - Pod 목록 보기
# :svc     - Service 목록 보기
# :deploy  - Deployment 목록 보기
# :logs    - 로그 보기
# ?        - 도움말
🎯 IPAM (IP Address Management) 심화 분석
1. IPAM 모드 비교 분석
| Feature | Kubernetes Host Scope | Cluster Scope (default) | Multi-Pool (Beta) | CRD-backed | AWS ENI… |
|---|---|---|---|---|---|
| Tunnel routing | ✅ | ✅ | ❌ | ❌ | ❌ |
| Direct routing | ✅ | ✅ | ✅ | ✅ | ✅ |
| CIDR Configuration | Kubernetes | Cilium | Cilium | External | External (AWS) |
| Multiple CIDRs per cluster | ❌ | ✅ | ✅ | N/A | N/A |
| Multiple CIDRs per node | ❌ | ❌ | ✅ | N/A | N/A |
| Dynamic CIDR/IP allocation | ❌ | ❌ | ✅ | ✅ | ✅ |
Cilium은 다양한 환경과 요구사항에 맞춰 여러 IPAM 모드를 지원합니다:
⚠️ 중요한 제약사항
- 기존 클러스터의 IPAM 모드를 변경하지 마세요
- 라이브 환경에서 IPAM 모드 변경 시 기존 워크로드의 연결 중단 발생
- 가장 안전한 방법은 새로운 IPAM 구성으로 새 클러스터 설치
2. Kubernetes Host Scope IPAM 상세 분석
2.1 동작 원리
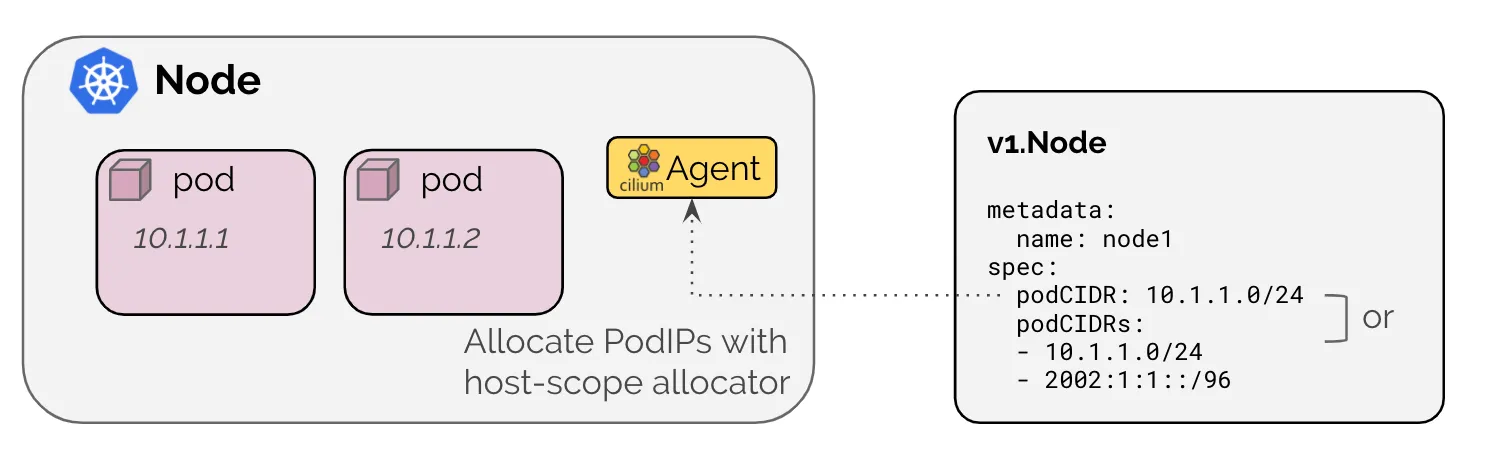
핵심 특징:
- Kubernetes 네이티브 IPAM 방식 사용
- kube-controller-manager가 각 노드에 PodCIDR 할당
- ipam: kubernetes 설정으로 활성화
현재 설정 확인:
# 클러스터 CIDR 설정 확인
kubectl cluster-info dump | grep -m 2 -E "cluster-cidr|service-cluster-ip-range"
# Expected output:
# "--service-cluster-ip-range=10.96.0.0/16"
# "--cluster-cidr=10.244.0.0/16"

# IPAM 모드 확인
cilium config view | grep ^ipam
# Expected output: ipam kubernetes

# 노드별 PodCIDR 할당 확인
kubectl get nodes -o jsonpath='{range .items[*]}{.metadata.name}{"\t"}{.spec.podCIDR}{"\n"}{end}'
# Expected output:
# k8s-ctr   10.244.0.0/24
# k8s-w1    10.244.1.0/24
2.2 kube-controller-manager 설정 분석
# kube-controller-manager 설정 확인
kubectl describe pod -n kube-system kube-controller-manager-k8s-ctr

# 주요 설정 플래그:
# --allocate-node-cidrs=true     # 자동 CIDR 할당 활성화
# --cluster-cidr=10.244.0.0/16   # 전체 클러스터 Pod CIDR
# --service-cluster-ip-range=10.96.0.0/16  # Service CIDR

# CiliumNode 리소스에서 PodCIDR 확인
kubectl get ciliumnode -o json | grep podCIDRs -A2

# 엔드포인트 상태 확인
kubectl get ciliumendpoints.cilium.io -A
3. 샘플 애플리케이션 배포 및 분석
3.1 애플리케이션 배포
# 샘플 웹 애플리케이션 배포
cat << EOF | kubectl apply -f -
apiVersion: apps/v1
kind: Deployment
metadata:
  name: webpod
spec:
  replicas: 2
  selector:
    matchLabels:
      app: webpod
  template:
    metadata:
      labels:
        app: webpod
    spec:
      affinity:
        podAntiAffinity:
          requiredDuringSchedulingIgnoredDuringExecution:
          - labelSelector:
              matchExpressions:
              - key: app
                operator: In
                values:
                - webpod
            topologyKey: "kubernetes.io/hostname"
      containers:
      - name: webpod
        image: traefik/whoami
        ports:
        - containerPort: 80
---
apiVersion: v1
kind: Service
metadata:
  name: webpod
  labels:
    app: webpod
spec:
  selector:
    app: webpod
  ports:
  - protocol: TCP
    port: 80
    targetPort: 80
  type: ClusterIP
EOF

# k8s-ctr 노드에 테스트 클라이언트 배포
cat <<EOF | kubectl apply -f -
apiVersion: v1
kind: Pod
metadata:
  name: curl-pod
  labels:
    app: curl
spec:
  nodeName: k8s-ctr
  containers:
  - name: curl
    image: nicolaka/netshoot
    command: ["tail"]
    args: ["-f", "/dev/null"]
    terminationGracePeriodSeconds: 0
EOF
3.2 배포 상태 확인 및 분석
# 배포 확인
kubectl get deploy,svc,ep webpod -owide
kubectl get endpointslices -l app=webpod
kubectl get ciliumendpoints

# Cilium 엔드포인트 상세 정보
kubectl exec -it -n kube-system ds/cilium -c cilium-agent -- cilium-dbg endpoint list

# 기본 통신 테스트
kubectl exec -it curl-pod -- curl webpod | grep Hostname

# 연속 통신 테스트 (로드밸런싱 확인)
kubectl exec -it curl-pod -- sh -c 'while true; do curl -s webpod | grep Hostname; sleep 1; done'
3.3 Hubble을 통한 트래픽 분석
# Hubble 포트 포워딩 설정
cilium hubble port-forward &

# 실시간 플로우 모니터링
hubble observe -f --protocol tcp --to-pod curl-pod
hubble observe -f --protocol tcp --from-pod curl-pod
hubble observe -f --protocol tcp --pod curl-pod

# 트래픽 플로우 예시 분석:
# Jul 26 08:15:33.840: default/curl-pod ID:37934 <> 10.96.88.194:80 world pre-xlate-fwd TRACED TCP
# Jul 26 08:15:33.840: default/curl-pod ID:37934 <> default/webpod-697b545f57-2h59t:80 ID:23913 post-xlate-fwd TRANSLATED TCP
# Jul 26 08:15:33.840: default/curl-pod:53092 ID:37934 -> default/webpod-697b545f57-2h59t:80 ID:23913 to-network FORWARDED TCP Flags: SYN

# 주요 플로우 상태 설명:
# pre-xlate-fwd, TRACED: NAT 변환 전, 추적 중인 플로우
# post-xlate-fwd, TRANSLATED: NAT 후의 플로우, NAT 변환이 일어남
패킷 캡처 및 분석:
# 실시간 패킷 캡처
tcpdump -i eth1 tcp port 80 -nn

# 패킷을 파일로 저장하여 분석
tcpdump -i eth1 tcp port 80 -w /tmp/http.pcap
termshark -r /tmp/http.pcap

# Hubble UI 웹 접속
NODEIP=$(ip -4 addr show eth1 | grep -oP '(?<=inet\s)\d+(\.\d+){3}')
echo "Hubble UI: http://$NODEIP:30003"
4. Cluster Scope IPAM 모드 실습
4.1 Cluster Scope 모드의 특징
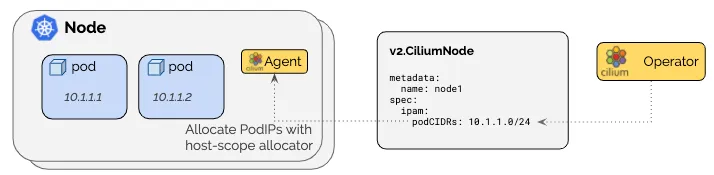
주요 차이점:
- Kubernetes PodCIDR 할당 대신 Cilium Operator가 CiliumNode CRD를 통해 관리
- 더 유연한 CIDR 할당 및 관리 가능
- Kubernetes 의존성 감소
장점:
- 동적 CIDR 할당 가능
- Kubernetes CIDR 설정에 의존하지 않음
- 최소 마스크 길이: /30 (권장: /29 이상)
4.2 Cluster Scope 모드로 마이그레이션
# 현재 상태 확인 (반복 요청 유지)
kubectl exec -it curl-pod -- sh -c 'while true; do curl -s webpod | grep Hostname; sleep 1; done'

# Cluster Scope 모드로 변경
helm upgrade cilium cilium/cilium \
  --namespace kube-system \
  --reuse-values \
  --set ipam.mode="cluster-pool" \
  --set ipam.operator.clusterPoolIPv4PodCIDRList="{172.20.0.0/16}" \
  --set ipv4NativeRoutingCIDR=172.20.0.0/16

# Cilium Operator 재시작 (필수)
kubectl -n kube-system rollout restart deploy/cilium-operator

# Cilium Agent 재시작
kubectl -n kube-system rollout restart ds/cilium
4.3 변경 사항 확인
# IPAM 모드 확인
cilium config view | grep ^ipam
# Expected output: ipam cluster-pool

# 노드별 PodCIDR 변경 확인
kubectl get nodes -o jsonpath='{range .items[*]}{.metadata.name}{"\t"}{.spec.podCIDR}{"\n"}{end}'
kubectl get ciliumnode -o json | grep podCIDRs -A2

# 엔드포인트 IP 변경 확인
kubectl get ciliumendpoints.cilium.io -A

# 라우팅 테이블 자동 업데이트 확인
ip -c route
sshpass -p 'vagrant' ssh vagrant@k8s-w1 ip -c route
4.4 기존 Pod IP 갱신
# 기존 10.244.x.x 대역 Pod 확인
kubectl get pod -A -owide | grep 10.244.

# 모든 워크로드 재시작으로 새 IP 할당
kubectl -n kube-system rollout restart deploy/hubble-relay deploy/hubble-ui
kubectl -n cilium-monitoring rollout restart deploy/prometheus deploy/grafana
kubectl rollout restart deploy/webpod
kubectl delete pod curl-pod

# 새 테스트 Pod 생성
cat <<EOF | kubectl apply -f -
apiVersion: v1
kind: Pod
metadata:
  name: curl-pod
  labels:
    app: curl
spec:
  nodeName: k8s-ctr
  containers:
  - name: curl
    image: nicolaka/netshoot
    command: ["tail"]
    args: ["-f", "/dev/null"]
    terminationGracePeriodSeconds: 0
EOF

# 새 IP 대역 확인 (172.20.x.x)
kubectl get ciliumendpoints.cilium.io -A

# 통신 테스트
kubectl exec -it curl-pod -- sh -c 'while true; do curl -s webpod | grep Hostname; sleep 1; done'
🛣️ Routing: 네트워크 라우팅 방식 심화
1. Encapsulation vs Native Routing 비교
1.1 방식 1: Encapsulation (VXLAN/GENEVE)
핵심 특징:
- UDP 기반 오버레이 터널링
- 기본 네트워크 인프라 요구사항 최소화
- 노드 간 모든 트래픽이 캡슐화됨
장점:
-
단순성 (Simplicity)
- 클러스터 노드를 연결하는 네트워크가 PodCIDR을 인식할 필요 없음
- 복잡한 네트워크 토폴로지에서도 동작
- IP/UDP 연결만 가능하면 기본 네트워크 토폴로지 무관
-
정체성 컨텍스트 (Identity Context)
- 캡슐화 프로토콜을 통해 메타데이터 전송 가능
- 소스 보안 ID 등의 메타데이터 활용
- 원격 노드에서 ID 룩업 최적화
단점:
- MTU 오버헤드
- VXLAN: 네트워크 패킷당 50바이트 추가
- 유효 MTU가 네이티브 라우팅보다 낮아짐
- 점보 프레임으로 오버헤드 비율 감소 가능
설정 옵션:
# VXLAN 사용 (기본값)
--set tunnel-protocol=vxlan
--set tunnel-port=8472

# Geneve 사용
--set tunnel-protocol=geneve
--set tunnel-port=6081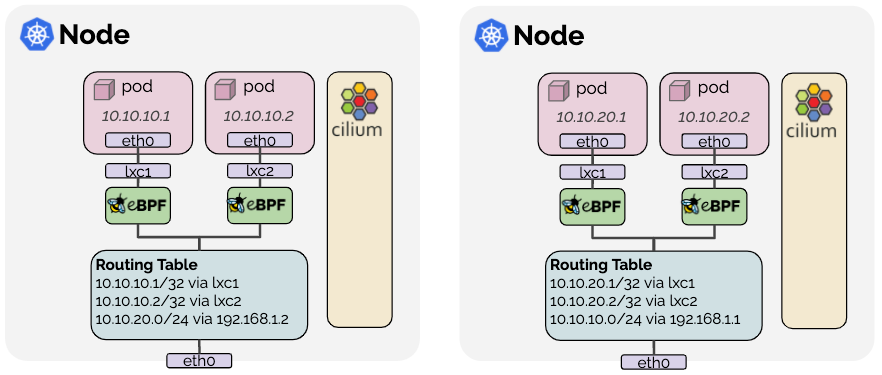
1.2 방식 2: Native Routing
핵심 특징:
- 캡슐화 없이 기본 네트워크 라우팅 활용
- Linux 커널 라우팅 서브시스템에 위임
- 패킷이 로컬 프로세스처럼 라우팅됨
네트워크 요구사항:
- 클러스터 노드를 연결하는 네트워크가 PodCIDR을 라우팅할 수 있어야 함
- 각 노드가 다른 모든 노드의 Pod IP를 인식해야 함
PodCIDR 라우팅 방안:
-
방안 1: Direct Node Routes
# 단일 L2 네트워크 공유 시 --set auto-direct-node-routes=true # BGP 데몬을 통한 경로 배포 # 추가 시스템 구성 요소 필요 -
방안 2: 라우터 기반
# 클라우드 제공자 라우터 활용
# AWS ENI, Google Cloud, Azure IPAM 등
설정 옵션:
# 네이티브 라우팅 활성화
--set routing-mode=native

# 네이티브 라우팅 CIDR 설정
--set ipv4-native-routing-cidr=x.x.x.x/y

# 자동 직접 노드 라우트 (동일 L2 네트워크)
--set auto-direct-node-routes=true
2. 현재 실습 환경의 라우팅 분석
2.1 네이티브 라우팅 확인
# 현재 라우팅 모드 확인
cilium config view | grep routing-mode
# Expected: routing-mode: native

# IPv4 네이티브 라우팅 CIDR 확인
cilium config view | grep ipv4-native-routing-cidr
# Expected: ipv4-native-routing-cidr: 172.20.0.0/16

# 자동 직접 노드 라우트 확인
cilium config view | grep auto-direct-node-routes
# Expected: auto-direct-node-routes: true
2.2 라우팅 테이블 분석
# Control Plane 노드 라우팅 테이블
ip -c route show

# Worker 노드 라우팅 테이블
sshpass -p 'vagrant' ssh vagrant@k8s-w1 ip -c route

# 예상되는 라우팅 항목:
# 172.20.0.0/24 dev cilium_host scope link
# 172.20.1.0/24 via 192.168.10.101 dev eth1
🎭 Masquerading: eBPF 기반 NAT 구현
1. Masquerading 개념 및 구현 방식
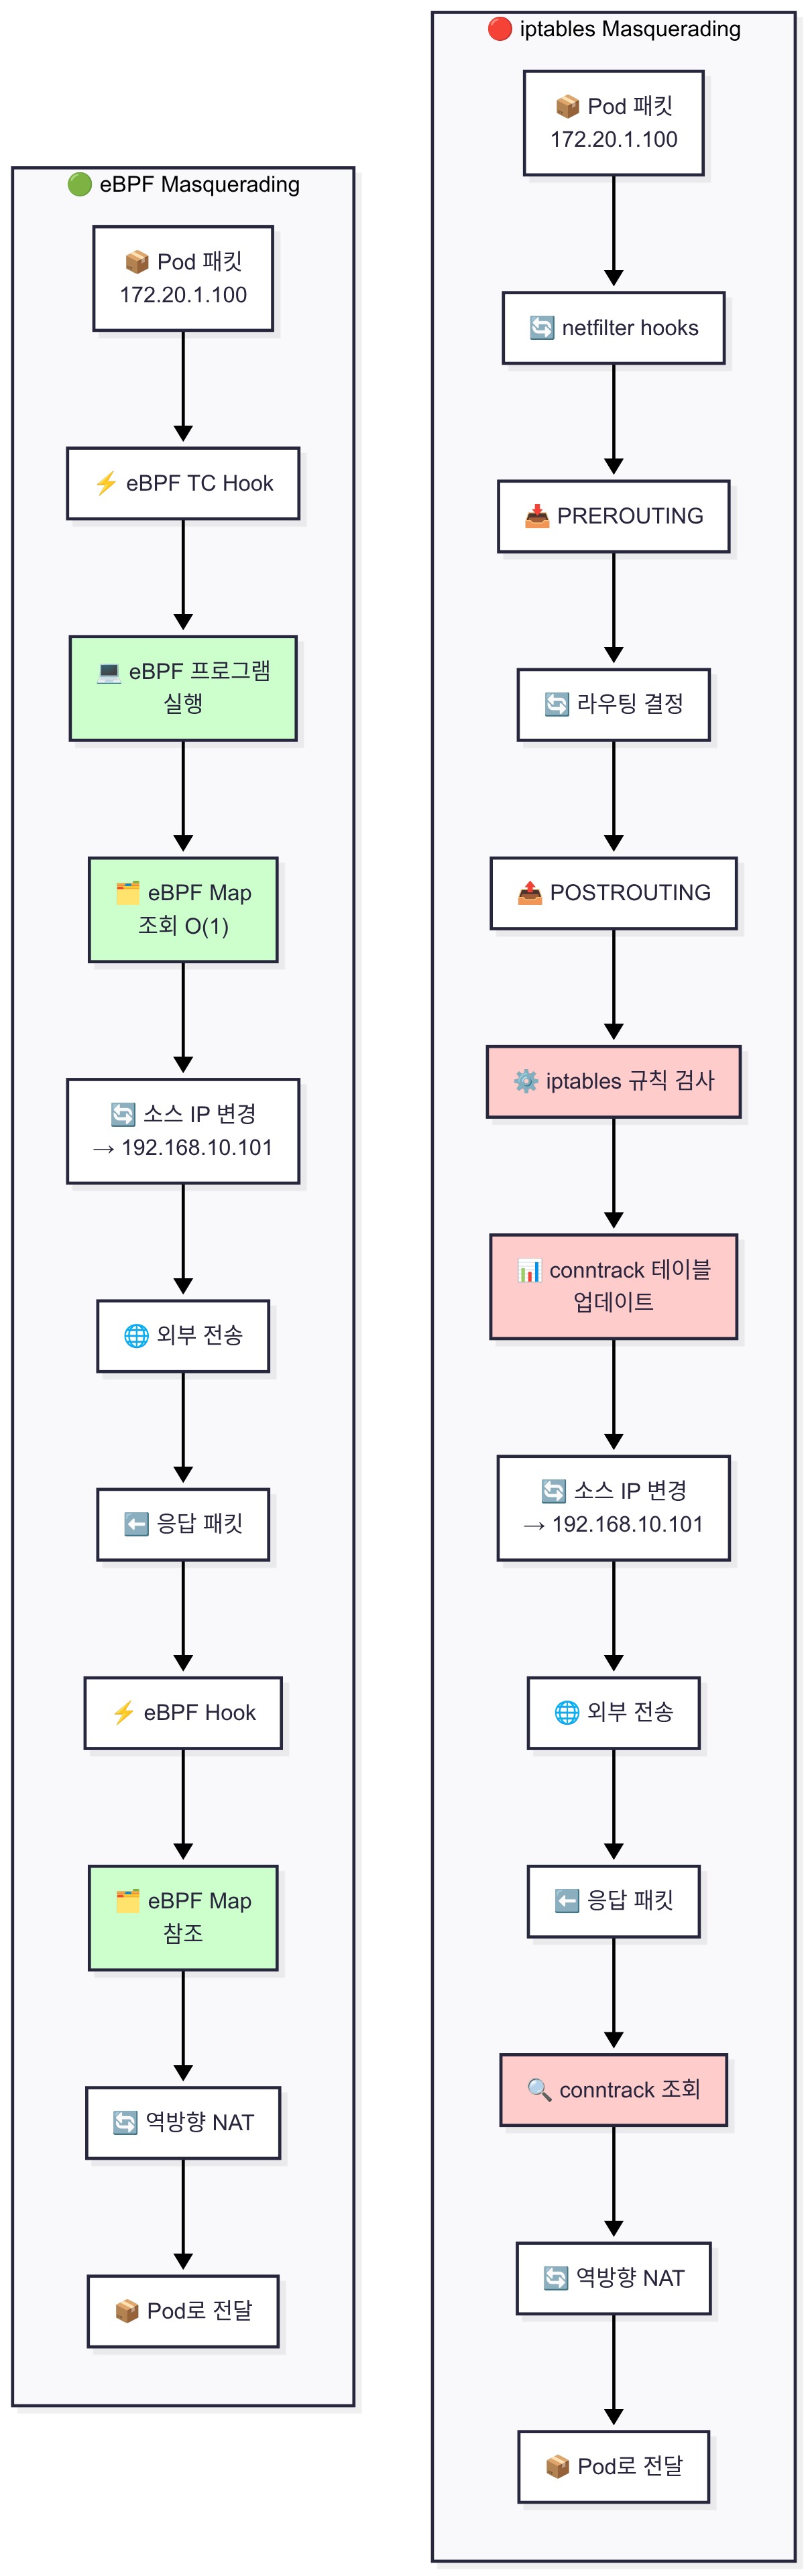
1.1 Masquerading의 필요성
Masquerading(마스커레이딩)은 Pod에서 클러스터 외부로 나가는 트래픽의 소스 IP를 노드 IP로 변경하는 NAT(Network Address Translation) 기술입니다.
필요한 시나리오:
- Pod에서 인터넷으로 나가는 트래픽
- Pod에서 클러스터 외부 서버로의 통신
- 외부 서비스가 Pod IP를 직접 인식할 수 없는 환경
1.2 eBPF vs iptables 구현 방식
eBPF 기반 Masquerading (Cilium 기본)
# 현재 Masquerading 상태 확인
kubectl exec -it -n kube-system ds/cilium -c cilium-agent -- cilium status | grep Masquerading
# Expected: Masquerading: BPF [eth0, eth1] 172.20.0.0/16 [IPv4: Enabled, IPv6: Disabled]

# eBPF 프로그램으로 직접 처리
# - 커널 레벨에서 고성능 NAT 수행
# - iptables 규칙 불필요
# - O(1) 해시맵 기반 처리
iptables 기반 Masquerading (전통적 방식)
# iptables 규칙 확인 (Cilium에서는 사용하지 않음)
iptables-save | grep -i masquerade

# Cilium은 iptables MASQUERADE 규칙을 사용하지 않음
# 대신 eBPF 프로그램으로 직접 NAT 처리
2. 실습 환경에서 Masquerading 테스트
2.1 현재 설정 확인
# Masquerading 상태 확인
kubectl exec -it -n kube-system ds/cilium -c cilium-agent -- cilium status | grep Masquerading

# IPv4 네이티브 라우팅 CIDR 확인
cilium config view | grep ipv4-native-routing-cidr
# Expected: ipv4-native-routing-cidr: 172.20.0.0/16

# iptables 상태 확인 (KUBE 관련 규칙 제거)
iptables-save | grep -v KUBE | iptables-restore
iptables-save

# Worker 노드에서도 동일하게 확인
sshpass -p 'vagrant' ssh vagrant@k8s-w1 "sudo iptables-save | grep -v KUBE | sudo iptables-restore"
sshpass -p 'vagrant' ssh vagrant@k8s-w1 sudo iptables-save
2.2 기본 통신 테스트
# 클러스터 내부 통신 (Masquerading 불필요)
kubectl exec -it curl-pod -- curl -s webpod | grep Hostname

# 노드 간 통신 테스트
kubectl exec -it curl-pod -- ping 192.168.10.101
2.3 외부 서버와의 통신 테스트
router 서버 (192.168.10.200)와의 통신:
# 터미널 1: 패킷 모니터링
tcpdump -i eth1 icmp -nn
# 또는 Hubble로 모니터링
hubble observe -f --pod curl-pod

# 터미널 2: router에서 패킷 모니터링
# (router 서버에서 실행)
tcpdump -i eth1 icmp -nn

# 터미널 3: ping 테스트
kubectl exec -it curl-pod -- ping 192.168.10.200

# 소스 IP 확인 - 172.20.x.x (Pod IP)에서 192.168.10.100 (노드 IP)로 변경됨을 확인
HTTP 통신 테스트:
# 터미널 1: k8s-ctr에서 HTTP 트래픽 모니터링
tcpdump -i eth1 tcp port 80 -nnq
# 또는 Hubble 사용
hubble observe -f --pod curl-pod

# 터미널 2: router에서 HTTP 트래픽 모니터링
tcpdump -i eth1 tcp port 80 -nnq

# 터미널 3: HTTP 요청
kubectl exec -it curl-pod -- curl -s 192.168.10.200

# 패킷 분석:
# 송신: 172.20.x.x (Pod IP) → 192.168.10.100 (노드 IP)로 NAT 변경
# 수신: 192.168.10.200 → 192.168.10.100 (응답)
3. 사내망 통신 시나리오 테스트
3.1 router의 사내망 인터페이스 확인
# router 서버의 네트워크 인터페이스 확인
# (router 서버에서 실행)
ip -br -c -4 addr
# Expected output:
# loop1 UNKNOWN 10.10.1.200/24
# loop2 UNKNOWN 10.10.2.200/24

# k8s-ctr에서 사내망으로의 라우팅 확인
ip -c route | grep static
# Expected: 10.10.0.0/16 via 192.168.10.200 dev eth1 proto static
3.2 사내망 통신 테스트
# 터미널 1: k8s-ctr에서 HTTP 트래픽 모니터링
tcpdump -i eth1 tcp port 80 -nnq
# 또는 Hubble 사용
hubble observe -f --pod curl-pod

# 터미널 2: router에서 HTTP 트래픽 모니터링
tcpdump -i eth1 tcp port 80 -nnq

# 터미널 3: 사내망 서버와 통신 테스트
kubectl exec -it curl-pod -- curl -s 10.10.1.200
kubectl exec -it curl-pod -- curl -s 10.10.2.200

# 이 시점에서는 Masquerading이 발생하여 Pod IP가 노드 IP로 변경됨
# router는 Pod IP를 직접 인식할 수 없음
4. ip-masq-agent를 통한 선택적 Masquerading
4.1 ip-masq-agent 개념
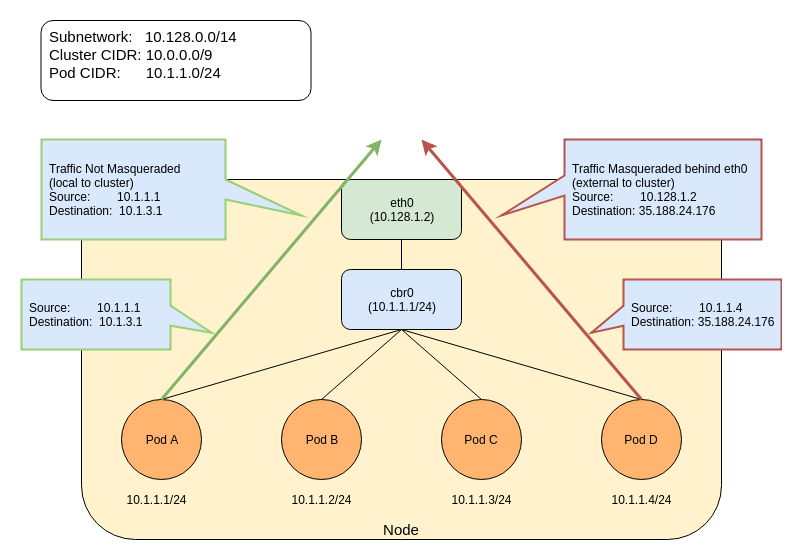
ip-masq-agent의 역할:
- 특정 CIDR 대역에 대해서는 Masquerading을 수행하지 않음
- 사내망과 NAT 없는 직접 통신이 필요한 경우 활용
- ClusterMesh 환경에서 Native-Routing 설정 시에도 중요
주요 설정 옵션:
nonMasqueradeCIDRs: 마스커레이딩하지 않을 CIDR 목록masqLinkLocal: 링크 로컬 주소 마스커레이딩 여부masqLinkLocalIPv6: IPv6 링크 로컬 주소 마스커레이딩 여부
4.2 기본 nonMasqueradeCIDRs 설정
설정 파일이 비어있을 경우 기본값:
10.0.0.0/8
172.16.0.0/12
192.168.0.0/16
100.64.0.0/10
192.0.0.0/24
192.0.2.0/24
192.88.99.0/24
198.18.0.0/15
198.51.100.0/24
203.0.113.0/24
240.0.0.0/4
169.254.0.0/16  # masqLinkLocal이 false인 경우 추가
4.3 사내망 대역을 위한 ip-masq-agent 설정
# ip-masq-agent 활성화 및 사내망 대역 설정
helm upgrade cilium cilium/cilium \
  --namespace kube-system \
  --reuse-values \
  --set ipMasqAgent.enabled=true \
  --set ipMasqAgent.config.nonMasqueradeCIDRs='{10.10.1.0/24,10.10.2.0/24}'

# 설정 적용 확인 (Cilium 데몬셋이 자동 재시작됨)
cilium hubble port-forward &

# ip-masq-agent ConfigMap 생성 확인
kubectl get cm -n kube-system ip-masq-agent -o yaml | yq
kubectl describe cm -n kube-system ip-masq-agent

# Cilium 설정에서 ip-masq-agent 확인
cilium config view | grep -i ip-masq

# eBPF 맵에서 설정 확인
kubectl -n kube-system exec ds/cilium -c cilium-agent -- cilium-dbg bpf ipmasq list
4.4 사내망과의 직접 통신 테스트
# 설정 후 사내망 통신 테스트
# 터미널 1: 패킷 모니터링
tcpdump -i eth1 tcp port 80 -nnq
hubble observe -f --pod curl-pod

# 터미널 2: router에서 패킷 모니터링
tcpdump -i eth1 tcp port 80 -nnq

# 터미널 3: 사내망 서버와 통신
kubectl exec -it curl-pod -- curl -s 10.10.1.200
kubectl exec -it curl-pod -- curl -s 10.10.2.200

# 이제 Pod IP가 그대로 유지되어야 함 (Masquerading 없음)
# 하지만 router에서 Pod IP로 응답을 보낼 수 없으므로 통신 실패
4.5 router에 Static Route 설정
# k8s-ctr에서 노드별 PodCIDR 미리 확인
kubectl get ciliumnode -o json | grep podCIDRs -A2

# router에 각 노드 PodCIDR에 대한 static routing 설정
# (router 서버에서 실행)
ip route add 172.20.1.0/24 via 192.168.10.100  # k8s-ctr PodCIDR
ip route add 172.20.0.0/24 via 192.168.10.101  # k8s-w1 PodCIDR

# 설정 확인
ip -c route | grep 172.20

# 이제 사내망과 Pod 간 직접 통신 가능
kubectl exec -it curl-pod -- curl -s 10.10.1.200
kubectl exec -it curl-pod -- curl -s 10.10.2.200
⚠️ 운영 환경에서의 고려사항:
- Native-Routing 환경에서 ip-masq-agent로 사내망과 NAT 없는 통신 설정 시
- 각 노드별 PodCIDR에 대한 라우팅 설정이 사내망 네트워크 장비에 필요
- 노드가 많아질수록 Static Routing은 운영상 불가능
- BGP를 사용하여 동적으로 라우팅 설정 (5주차에서 다룸)
🔍 CoreDNS: 클러스터 DNS 서비스
1. CoreDNS 아키텍처 및 구성
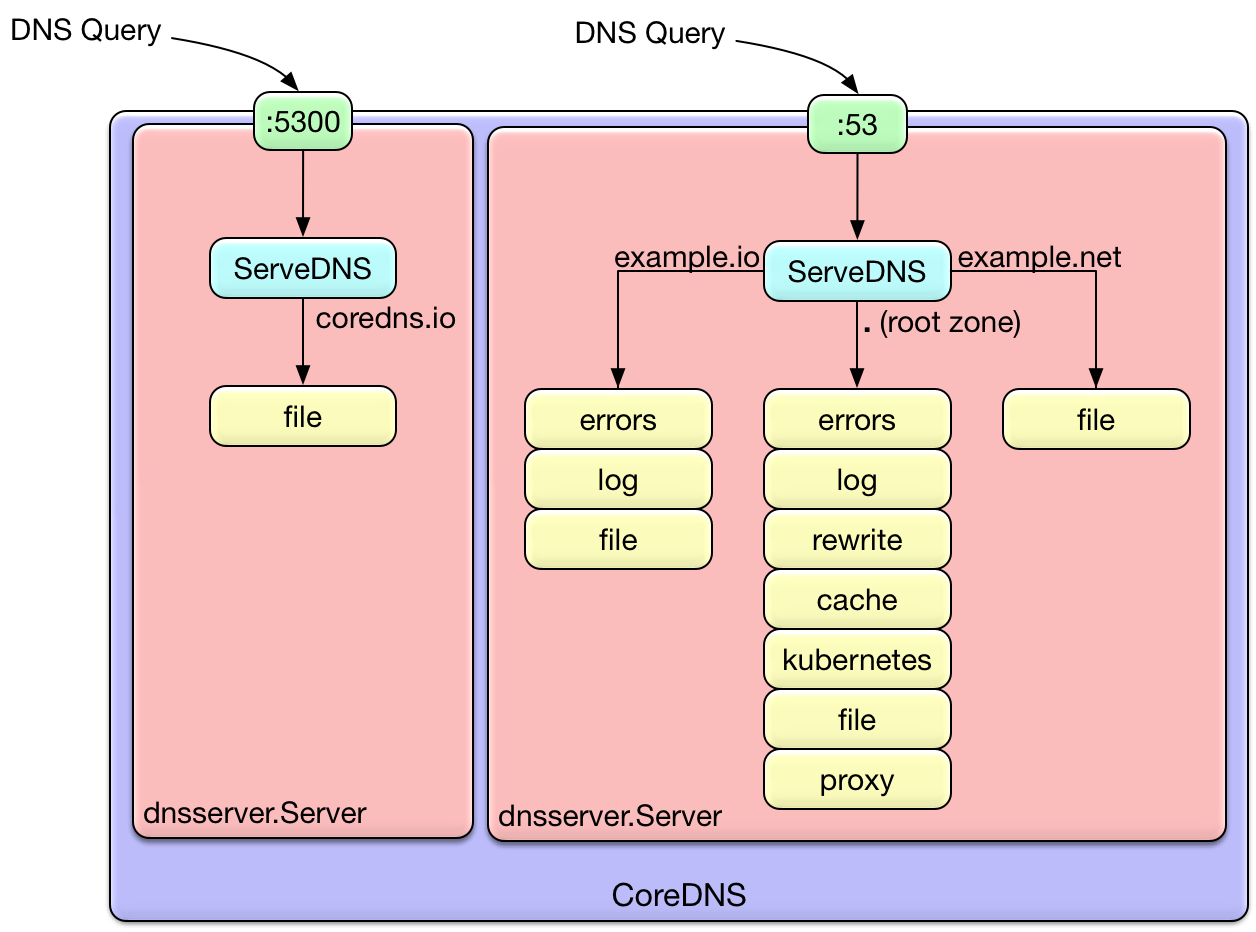
1.1 CoreDNS 개요
CoreDNS는 쿠버네티스의 기본 DNS 서버로, 플러그인 기반의 유연한 DNS 서비스를 제공합니다.
주요 특징:
- 플러그인 기반 아키텍처
- 다양한 백엔드 지원 (Kubernetes API, etcd, file 등)
- 고성능 DNS 캐싱
- 메트릭 및 모니터링 지원
1.2 Pod의 DNS 설정 확인
# Pod의 DNS 설정 정보 확인
kubectl exec -it curl-pod -- cat /etc/resolv.conf
# Expected output:
# search default.svc.cluster.local svc.cluster.local cluster.local
# nameserver 10.96.0.10
# options ndots:5

# kubelet의 클러스터 DNS 설정 확인
cat /var/lib/kubelet/config.yaml | grep cluster -A1
# Expected:
# clusterDNS: ["10.96.0.10"]
# clusterDomain: cluster.local
1.3 CoreDNS 서비스 및 엔드포인트
# CoreDNS 서비스 확인
kubectl get svc,ep -n kube-system kube-dns

# Expected output:
# NAME                 TYPE        CLUSTER-IP   EXTERNAL-IP   PORT(S)                  AGE
# service/kube-dns     ClusterIP   10.96.0.10   <none>        53/UDP,53/TCP,9153/TCP   173m
#
# NAME                   ENDPOINTS                                            AGE
# endpoints/kube-dns     172.20.0.199:53,172.20.1.162:53,172.20.0.199:53 + 3 more...   172m

# CoreDNS Pod 확인
kubectl get pod -n kube-system -l k8s-app=kube-dns
# Expected output:
# NAME                       READY   STATUS    RESTARTS   AGE
# coredns-674b8bbfcf-2x9gs   1/1     Running   0          162m
# coredns-674b8bbfcf-w5d8m   1/1     Running   2          162m
2. CoreDNS 설정 분석 (Corefile)
2.1 Corefile 구성 확인
# CoreDNS ConfigMap 확인
kubectl describe cm -n kube-system coredns

# Corefile 상세 내용:
주요 플러그인 설명:
.:53 {
    # 모든 도메인 요청을 53포트에서 수신
    errors
    # DNS 응답 중 에러가 발생할 경우 로그 출력

    health {
        # health 엔드포인트를 제공하여 상태 확인 가능
        lameduck 5s
        # 종료 시 5초간 lameduck 모드로 트래픽을 점차 줄이며 종료
    }

    ready
    # ready 엔드포인트 제공, 8181 포트에서 모든 플러그인 준비 신호 시 200 OK 반환

    kubernetes cluster.local in-addr.arpa ip6.arpa {
        # Kubernetes DNS 플러그인 설정 (클러스터 내부 도메인 처리)
        # cluster.local: 클러스터 도메인
        pods insecure
        # 파드 IP로 DNS 조회 허용 (보안 없음)
        fallthrough in-addr.arpa ip6.arpa
        # 해당 도메인에서 결과 없으면 다음 플러그인으로 전달
        ttl 30
        # 캐시 타임 (30초)
    }

    prometheus :9153
    # Prometheus metrics 수집 가능

    forward . /etc/resolv.conf {
        # CoreDNS가 모르는 도메인은 지정된 업스트림(보통 외부 DNS)으로 전달
        # .: 모든 쿼리
        max_concurrent 1000
        # 병렬 포워딩 최대 1000개
    }

    cache 30 {
        # DNS 응답 캐시 기능, 기본 캐시 TTL 30초
        disable success cluster.local
        # 성공 응답 캐시 안 함 (cluster.local 도메인)
        disable denial cluster.local
        # NXDOMAIN 응답도 캐시 안 함
    }

    loop
    # 간단한 전달 루프(loop)를 감지하고, 루프가 발견되면 CoreDNS 프로세스를 중단

    reload
    # Corefile이 변경되었을 때 자동으로 재적용 (약 2분 소요)

    loadbalance
    # 응답에 대하여 A, AAAA, MX 레코드의 순서를 무작위로 선정하는 라운드-로빈 DNS 로드밸런서
}
2.2 호스트 시스템의 DNS 설정
# 호스트의 DNS 설정 확인
cat /etc/resolv.conf
# Expected:
# nameserver 127.0.0.53
# options edns0 trust-ad
# search .

# systemd-resolved 상태 확인
resolvectl
# Expected output showing systemd-resolved configuration
3. DNS 쿼리 테스트 및 분석
3.1 DNS 모니터링 설정
# 실습 편리를 위해 CoreDNS Pod를 1개로 축소
kubectl scale deployment -n kube-system coredns --replicas 1
kubectl get pod -n kube-system -l k8s-app=kube-dns -owide

# Hubble DNS 모니터링
cilium hubble port-forward &
hubble observe -f --pod curl-pod --port 53
hubble observe -f --port 53 --protocol UDP

# tcpdump를 통한 DNS 패킷 모니터링
tcpdump -i any udp port 53 -nn
3.2 기본 DNS 쿼리 테스트
# Pod IP 및 CoreDNS Pod IP 확인
kubectl get pod -owide  # curl-pod IP 확인
kubectl get pod -n kube-system -l k8s-app=kube-dns -owide  # CoreDNS Pod IP 확인

# 클러스터 내부 도메인 조회
kubectl exec -it curl-pod -- nslookup webpod
kubectl exec -it curl-pod -- nslookup -debug webpod

# 외부 도메인 조회
kubectl exec -it curl-pod -- nslookup -debug google.com
3.3 CoreDNS 로깅 및 디버깅
# CoreDNS ConfigMap 편집하여 로깅 활성화
# k9s → configmap → coredns 선택 → E(edit) → 아래처럼 log, debug 추가

# 수정 예시:
.:53 {
    log
    debug
    errors
    health {
        lameduck 5s
    }
    # ... 나머지 설정 동일
}

# CoreDNS 로그 모니터링
kubectl -n kube-system logs -l k8s-app=kube-dns -f

# DNS 쿼리 수행하여 로그 확인
kubectl exec -it curl-pod -- nslookup webpod
kubectl exec -it curl-pod -- nslookup google.com
3.4 CoreDNS 메트릭 분석
# CoreDNS Prometheus 메트릭 확인
kubectl exec -it curl-pod -- curl kube-dns.kube-system.svc:9153/metrics | grep coredns_cache_ | grep -v ^#

# 주요 메트릭:
# coredns_cache_entries: 현재 캐시에 저장된 엔트리 수
#   - type: success (정상 응답) 또는 denial (NXDOMAIN 등)
# coredns_cache_hits_total: 캐시 조회 성공 횟수
# coredns_cache_misses_total: 캐시 미스 횟수
# coredns_cache_requests_total: 캐시 관련 요청 횟수의 총합
예상 메트릭 출력:
coredns_cache_entries{server="dns://:53",type="denial",view="",zones="."} 1
coredns_cache_entries{server="dns://:53",type="success",view="",zones="."} 0
coredns_cache_hits_total{server="dns://:53",type="success",view="",zones="."} 12
coredns_cache_misses_total{server="dns://:53",view="",zones="."} 517
coredns_cache_requests_total{server="dns://:53",view="",zones="."} 529
🚀 NodeLocal DNSCache: 고성능 DNS 캐싱
1. NodeLocal DNSCache 개념 및 필요성
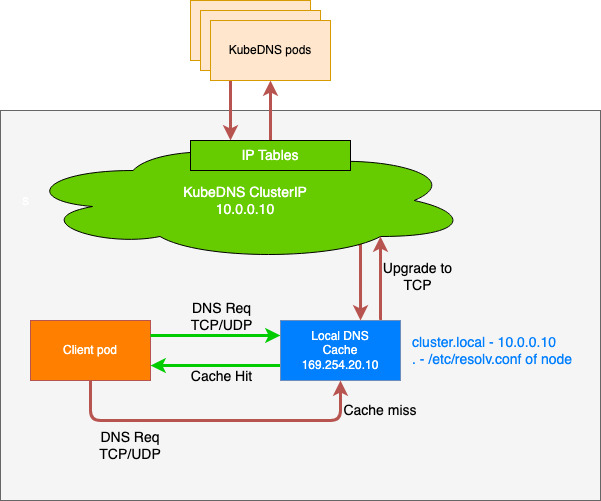
1.1 기존 DNS 아키텍처의 문제점
기존 'ClusterFirst' DNS 모드:
1. Pod → kube-dns Service IP (10.96.0.10)
2. kube-proxy iptables 규칙을 통해 CoreDNS Pod로 변환
3. 다른 노드의 CoreDNS Pod에 도달할 수 있음
4. iptables DNAT 규칙과 연결 추적(conntrack) 사용
문제점:
- 연결 추적 레이스 조건: UDP 패킷의 conntrack 경합
- 크로스 노드 통신: 로컬 CoreDNS가 없으면 다른 노드로 요청
- conntrack 테이블 압박: UDP DNS 항목이 테이블을 채움
- 성능 오버헤드: iptables DNAT 처리 지연
1.2 NodeLocal DNSCache 해결 방안
개선된 아키텍처:
1. Pod → NodeLocal DNSCache (동일 노드)
2. 캐시 미스 시에만 클러스터 CoreDNS로 요청
3. iptables DNAT 및 연결 추적 우회
4. TCP 업그레이드로 연결 추적 최적화
주요 이점:
- 지연 시간 개선: 로컬 캐시를 통한 빠른 응답
- 연결 추적 최적화: UDP 대신 TCP 사용으로 conntrack 압박 감소
- 네트워크 효율성: 크로스 노드 트래픽 감소
- 노드별 메트릭: 노드 수준의 DNS 가시성
2. kube-proxy 모드별 구현 차이
2.1 iptables 모드에서의 구현
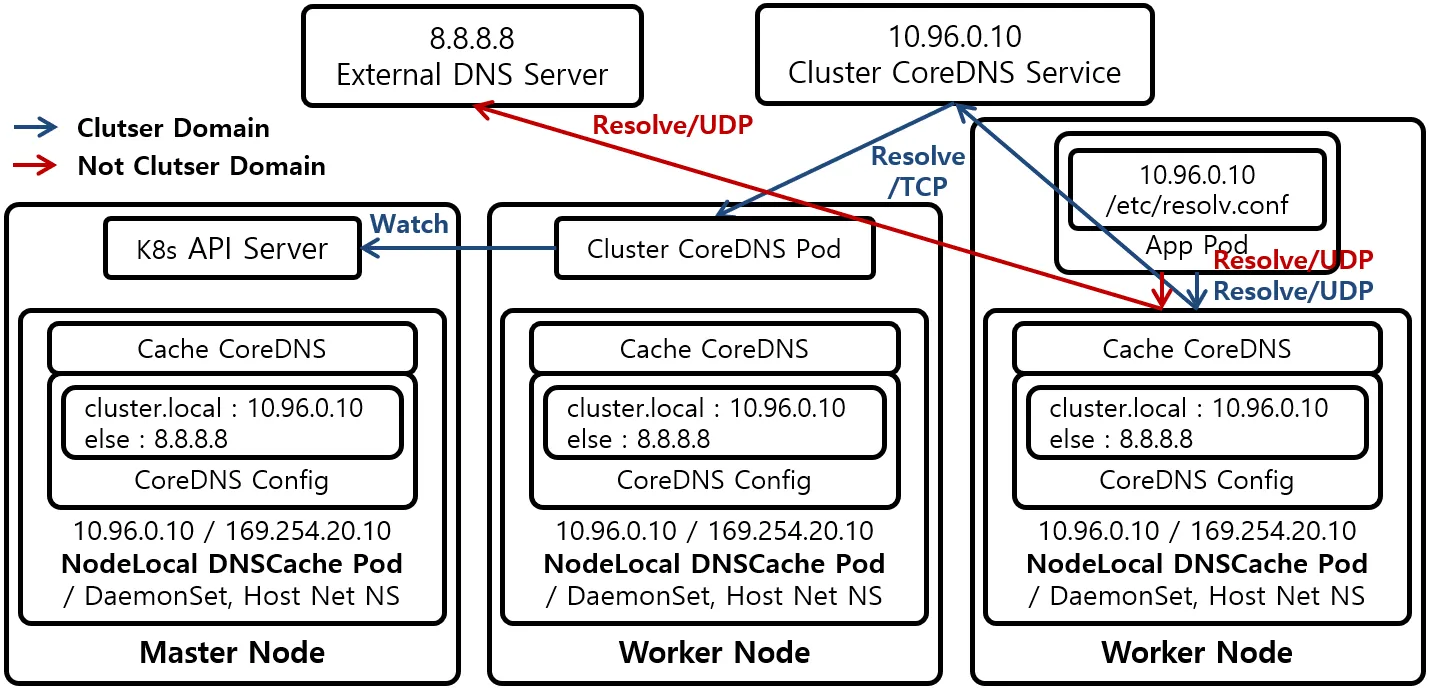
핵심 특징:
# dummy 인터페이스 생성 확인
ip -c addr show dev nodelocaldns
# Expected output:
# nodelocaldns: <BROADCAST,NOARP> mtu 1500 qdisc noop state DOWN
# inet 169.254.20.10/32 scope global nodelocaldns
# inet 10.96.0.10/32 scope global nodelocaldns

# 인터페이스 세부 정보
ip -details link show dev nodelocaldns
# Expected: dummy interface with specific properties
iptables raw 테이블 설정:
# raw 테이블에서 NOTRACK 규칙 확인
iptables -t raw -nvL

# Expected rules:
# CT udp dpt:53 /* NodeLocal DNS Cache: skip conntrack */ NOTRACK
# CT tcp dpt:53 /* NodeLocal DNS Cache: skip conntrack */ NOTRACK
동작 원리:
1. Host Network Namespace에서 동작
2. CoreDNS Service ClusterIP (10.96.0.10)와 Local Address (169.254.20.10)를 가진 dummy 인터페이스 생성
3. iptables raw 테이블에서 DNS 트래픽에 대한 conntrack 우회
4. 두 IP 주소 모두에서 DNS 요청 수신 가능
2.2 IPVS 모드에서의 구현
핵심 차이점:
- NodeLocal DNSCache가 Local Address (169.254.20.10)에서만 수신
- IPVS 로드밸런싱과 충돌 방지를 위해 ClusterIP 바인딩 불가
__PILLAR__UPSTREAM__SERVERS__는 node-local-dns Pod에 의해 자동 설정
3. NodeLocal DNSCache 설치 및 구성
3.1 설치 전 준비작업
# 현재 CoreDNS Service IP 확인
kubedns=$(kubectl get svc kube-dns -n kube-system -o jsonpath={.spec.clusterIP})
echo "CoreDNS ClusterIP: $kubedns"

# 클러스터 도메인 확인 (기본값: cluster.local)
domain="cluster.local"

# Local DNS 주소 선택 (링크-로컬 범위 권장)
localdns="169.254.20.10"

echo "kubedns=$kubedns"
echo "domain=$domain"
echo "localdns=$localdns"
3.2 Manifest 준비 및 배포
# NodeLocal DNSCache manifest 다운로드
curl -o nodelocaldns.yaml https://raw.githubusercontent.com/kubernetes/kubernetes/master/cluster/addons/dns/nodelocaldns/nodelocaldns.yaml

# kube-proxy 모드 확인
kubectl get cm -n kube-system kube-proxy -o yaml | grep mode

# iptables 모드용 설정 (기본)
sed -i "s/__PILLAR__LOCAL__DNS__/$localdns/g; s/__PILLAR__DNS__DOMAIN__/$domain/g; s/__PILLAR__DNS__SERVER__/$kubedns/g" nodelocaldns.yaml

# IPVS 모드인 경우 (Cilium에서는 kube-proxy 대체하므로 해당 없음)
# sed -i "s/__PILLAR__LOCAL__DNS__/$localdns/g; s/__PILLAR__DNS__DOMAIN__/$domain/g; s/,__PILLAR__DNS__SERVER__//g; s/__PILLAR__CLUSTER__DNS__/$kubedns/g" nodelocaldns.yaml

# NodeLocal DNSCache 배포
kubectl create -f nodelocaldns.yaml

# 배포 확인
kubectl get pods -n kube-system -l k8s-app=node-local-dns
kubectl get daemonset -n kube-system node-local-dns
4. NodeLocal DNSCache 동작 확인
4.1 네트워크 인터페이스 확인
# 각 노드에서 nodelocaldns 인터페이스 확인
ip -c addr show dev nodelocaldns

# k8s-w1 노드에서도 확인
sshpass -p 'vagrant' ssh vagrant@k8s-w1 ip -c addr show dev nodelocaldns

# iptables raw 테이블 규칙 확인
iptables -t raw -nvL | grep -A2 -B2 "NodeLocal DNS"

# 예상 출력:
# 0 0 CT udp -- * * 0.0.0.0/0 10.96.0.10 udp dpt:53 /* NodeLocal DNS Cache: skip conntrack */ NOTRACK
# 0 0 CT tcp -- * * 0.0.0.0/0 10.96.0.10 tcp dpt:53 /* NodeLocal DNS Cache: skip conntrack */ NOTRACK
# 0 0 CT udp -- * * 0.0.0.0/0 169.254.20.10 udp dpt:53 /* NodeLocal DNS Cache: skip conntrack */ NOTRACK
4.2 DNS 쿼리 테스트
# DNS 쿼리 모니터링 설정
# 터미널 1: Hubble 모니터링
hubble observe -f --port 53

# 터미널 2: tcpdump 모니터링
tcpdump -i any udp port 53 -nn

# 터미널 3: NodeLocal DNSCache 로그 모니터링
kubectl logs -n kube-system -l k8s-app=node-local-dns -f

# 터미널 4: DNS 쿼리 수행
kubectl exec -it curl-pod -- nslookup webpod
kubectl exec -it curl-pod -- nslookup google.com

# Local DNS Cache 히트 확인
kubectl exec -it curl-pod -- nslookup webpod  # 캐시된 응답
4.3 성능 및 메트릭 분석
# NodeLocal DNSCache 메트릭 확인
kubectl exec -it curl-pod -- curl 169.254.20.10:9253/metrics | grep coredns_cache

# 캐시 통계 비교
# 기존 CoreDNS:
kubectl exec -it curl-pod -- curl kube-dns.kube-system.svc:9153/metrics | grep coredns_cache_

# NodeLocal DNSCache:
kubectl exec -it curl-pod -- curl 169.254.20.10:9253/metrics | grep coredns_cache_

# 예상되는 개선사항:
# - 캐시 히트율 증가
# - 응답 시간 감소
# - conntrack 엔트리 감소
5. Cilium과 NodeLocal DNSCache 통합
5.1 Cilium Local Redirect Policy와의 통합
Local Redirect Policy 개념:
- 특정 서비스로의 트래픽을 로컬 Pod로 리다이렉트
- NodeLocal DNSCache와 완벽한 통합
- 노드별 서비스 지역성 보장
# Local Redirect Policy 예시
apiVersion: "cilium.io/v2"
kind: CiliumLocalRedirectPolicy
metadata:
  name: "nodelocaldns-redirect"
spec:
  redirectFrontend:
    serviceMatcher:
      serviceName: kube-dns
      namespace: kube-system
  redirectBackend:
    localEndpointSelector:
      matchLabels:
        k8s-app: node-local-dns
5.2 통합 모니터링
# Cilium과 NodeLocal DNSCache 통합 상태 확인
cilium status

# DNS 정책 확인
cilium policy get

# 엔드포인트 확인
cilium endpoint list | grep dns

# Hubble을 통한 DNS 트래픽 분석
hubble observe --type dns --pod curl-pod
🔗 AWS 및 클라우드 통합
1. AWS 환경에서의 Cilium 최적화
1.1 AWS VPC 네이티브 네트워킹
AWS ENI IPAM의 장점:
- VPC 서브넷에서 직접 IP 할당
- AWS Security Groups 직접 활용
- VPC Flow Logs와 완전 통합
- AWS Load Balancer와 네이티브 연동
1.2 Prefix Delegation 지원
# Prefix Delegation 활성화
helm upgrade cilium cilium/cilium \
  --namespace kube-system \
  --set ipam.mode=eni \
  --set eni.enabled=true \
  --set eni.awsEnablePrefixDelegation=true \
  --set eni.awsReleasePrefixesOnScreendown=true
이점:
- ENI당 더 많은 IP 주소 할당 가능
- /28 서브넷을 ENI에 할당하여 IP 효율성 극대화
- 대규모 클러스터에서 ENI 한계 극복
2. 다른 클라우드 제공업체 통합
2.1 Google Cloud Integration
# GKE에서 Cilium 사용
helm install cilium cilium/cilium \
  --namespace kube-system \
  --set ipam.mode=gcp \
  --set gcp.enabled=true \
  --set routingMode=native
2.2 Azure Integration
# AKS에서 Cilium 사용
helm install cilium cilium/cilium \
  --namespace kube-system \
  --set ipam.mode=azure \
  --set azure.enabled=true \
  --set routingMode=native
🛠️ 트러블슈팅 가이드
1. 일반적인 네트워킹 문제
1.1 Pod 간 통신 실패
# 1. 기본 연결성 확인
kubectl exec -it curl-pod -- ping <target-pod-ip>

# 2. Cilium 엔드포인트 상태 확인
kubectl get ciliumendpoints -A

# 3. Hubble로 트래픽 플로우 확인
hubble observe --pod curl-pod --verdict DROPPED

# 4. 라우팅 테이블 확인
ip route show
1.2 DNS 해결 문제
# 1. CoreDNS Pod 상태 확인
kubectl get pods -n kube-system -l k8s-app=kube-dns

# 2. DNS 서비스 엔드포인트 확인
kubectl get ep -n kube-system kube-dns

# 3. DNS 쿼리 테스트
kubectl exec -it curl-pod -- nslookup kubernetes.default.svc.cluster.local

# 4. CoreDNS 로그 확인
kubectl logs -n kube-system -l k8s-app=kube-dns
1.3 외부 통신 문제
# 1. Masquerading 상태 확인
kubectl exec -it -n kube-system ds/cilium -c cilium-agent -- cilium status | grep Masquerading

# 2. ip-masq-agent 설정 확인
kubectl get cm -n kube-system ip-masq-agent -o yaml

# 3. 라우팅 규칙 확인
ip route show | grep default
2. 성능 최적화
2.1 CPU 및 메모리 최적화
# Cilium 리소스 사용량 확인
kubectl top pods -n kube-system -l k8s-app=cilium

# eBPF 맵 상태 확인
kubectl exec -it -n kube-system ds/cilium -c cilium-agent -- cilium-dbg bpf metrics

# 성능 튜닝 옵션
helm upgrade cilium cilium/cilium \
  --namespace kube-system \
  --set bpf.preallocateMaps=true \
  --set bpf.mapDynamicSizeRatio=0.25
2.2 네트워크 성능 최적화
# XDP 모드 확인
kubectl exec -it -n kube-system ds/cilium -c cilium-agent -- cilium status | grep XDP

# Direct Routing 최적화
helm upgrade cilium cilium/cilium \
  --namespace kube-system \
  --set routingMode=native \
  --set autoDirectNodeRoutes=true \
  --set enableIPv4Masquerade=false
📚 참고 자료 및 추가 학습
1. 공식 문서 및 가이드
핵심 문서:
클라우드 통합:
2. 심화 학습 리소스
YouTube 영상:
- eCHO Episode 39: Local Redirect Policy
- eCHO Episode 7: DNS with Laurent Bernaille
- Why We Created Cilium, eBPF: Unlocking the Kernel
기술 블로그:
3. 실무 운영 가이드
3.1 모니터링 및 알림
# 주요 메트릭 모니터링
kubectl exec -it curl-pod -- curl cilium-agent:9962/metrics | grep cilium_

# 권장 알림 규칙:
# - cilium_endpoint_regenerations_total 급증
# - cilium_drop_count_total 증가
# - coredns_cache_misses_total 비율 증가
3.2 용량 계획
IP 주소 계획:
- 클러스터당 최대 노드 수 계산
- 노드당 최대 Pod 수 고려
- IP 효율성을 위한 CIDR 크기 최적화
리소스 요구사항:
- Cilium Agent: CPU 200m, Memory 512Mi (기본)
- 대규모 환경: CPU 1000m, Memory 2Gi 권장
4. 보안 고려사항
4.1 네트워크 정책 베스트 프랙티스
# 기본 거부 정책
apiVersion: networking.k8s.io/v1
kind: NetworkPolicy
metadata:
  name: default-deny-all
spec:
  podSelector: {}
  policyTypes:
  - Ingress
  - Egress
4.2 암호화 설정
# WireGuard 투명 암호화 활성화
helm upgrade cilium cilium/cilium \
  --namespace kube-system \
  --set encryption.enabled=true \
  --set encryption.type=wireguard
🎯 3주차 학습 요약
1. 핵심 성취 목표
네트워킹 심화 이해:
- ✅ IPAM 모드별 특징과 적용 시나리오 파악
- ✅ Encapsulation vs Native Routing 장단점 분석
- ✅ Masquerading 메커니즘과 ip-masq-agent 활용
- ✅ CoreDNS와 NodeLocal DNSCache 구조 이해
실습 환경 구축:
- ✅ 3노드 확장 환경에서 사내망 시뮬레이션
- ✅ 다양한 네트워킹 시나리오 테스트
- ✅ 패킷 레벨 분석 도구 활용
- ✅ 성능 모니터링 및 트러블슈팅
2. 실무 적용 가능 기술
클라우드 네이티브 네트워킹:
- AWS/GCP/Azure 환경별 최적화 전략
- 대규모 클러스터 운영을 위한 IPAM 선택
- 하이브리드 클라우드 환경에서의 네트워킹
성능 최적화:
- Native Routing을 통한 처리량 향상
- DNS 성능 개선을 위한 NodeLocal DNSCache
- eBPF 기반 고성능 패킷 처리
3. 다음 단계 학습 방향
고급 네트워킹 기능:
- BGP를 활용한 동적 라우팅 (4-5주차)
- Cluster Mesh를 통한 멀티클러스터 네트워킹
- WireGuard를 통한 투명 암호화
운영 및 관리:
- 대규모 환경에서의 Cilium 운영 전략
- 장애 대응 및 복구 절차
- 보안 정책 고도화
4. 권장 심화 학습
- Multi-Pool IPAM 실습: 복잡한 IP 할당 시나리오 구현
- 클라우드 통합 시나리오: AWS ENI, GCP, Azure 환경별 특화 기능
- 성능 벤치마킹: 다양한 네트워킹 모드 간 성능 비교
- 보안 정책 설계: L3/L4/L7 레벨 네트워크 정책 통합 관리
다음 주차에서는 이러한 기반 위에 BGP 라우팅과 멀티클러스터 네트워킹 등 더욱 고급화된 기능들을 학습하게 될 것입니다.