Cilium 스터디 - Observability Hubble과 Prometheus/Grafana
Cilium Observability: Hubble과 Prometheus/Grafana를 활용한 네트워크 가시성
🔍 Observability vs Monitoring: 현대적 관찰 가능성의 이해
1. 모니터링과 관측 가능성의 근본적 차이
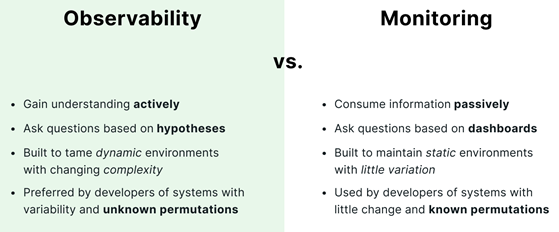
현대의 복잡한 분산 시스템에서는 단순한 모니터링을 넘어선 관측 가능성(Observability)이 필수적입니다. 두 개념의 핵심적인 차이점을 이해하는 것이 중요합니다.
| 측면 | 모니터링 (Monitoring) | 관측 가능성 (Observability) |
|---|---|---|
| 정의 | 특정 메트릭 추적으로 문제 감지 | 외부 출력 데이터로 시스템 상태 이해 |
| 목표 | 문제 발생 시 감지 및 경고 | 문제 원인 진단 및 시스템 최적화 |
| 데이터 소스 | 미리 정의된 메트릭 (CPU, 메모리 등) | 로그, 메트릭, 트레이스, 이벤트 |
| 시스템 유형 | 단순한 시스템, 잘 알려진 파라미터 | 복잡한 분산 시스템, 다중 컴포넌트 |
| 상호작용 방식 | 정적 경고 (임계값 기반) | 동적 쿼리 및 분석 (질문 기반) |
모니터링의 특징
- 사전에 정의된 기준을 기반으로 시스템 상태를 감시
- 하드웨어와 소프트웨어 메트릭 수집하여 정상 작동 여부 확인
- 주로 단순하고 잘 알려진 시스템에 적합
- 미리 설정된 임계값 초과 시 알림 발송
관측 가능성의 특징
- 수집된 다양한 데이터를 활용하여 예측되지 않은 문제까지 분석
- 시스템 내부 상태를 외부 출력 데이터로 이해할 수 있는 능력
- 복잡한 분산 아키텍처(마이크로서비스, 컨테이너)에서 필수적
- 미리 정의되지 않은 질문에 답할 수 있는 유연성 제공
2. 관측 가능성의 세 가지 기둥 (Three Pillars of Observability)
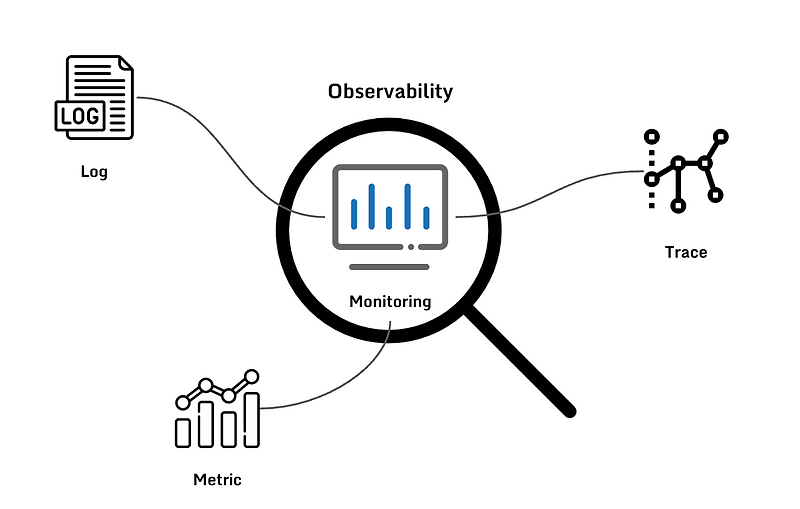
2.1 메트릭 (Metrics) - 시스템 성능의 정량적 모니터링
정의 및 특성
- 수치로 표현된 성능 데이터
- 시계열 데이터베이스(TSDB)에 저장
- 시스템의 전반적인 상태를 한눈에 파악 가능
- 대시보드와 경고 시스템에 주로 활용
주요 메트릭 타입
Counter (카운터): 누적된 값을 표현
- HTTP 요청 수, 처리된 패킷 수 등
- 지속적으로 증가하는 값

Gauge (게이지): 특정 시점의 값을 표현
- CPU 사용률, 메모리 사용량, 온도 등
- 증가/감소 모두 가능한 값

Histogram (히스토그램): 사전 정의된 구간별 값의 빈도
- 응답 시간 분포, 요청 크기 분포 등
- _bucket, _sum, _count 메트릭으로 구성

Summary (서머리): 구간 내 메트릭 값의 통계적 정보
- 중앙값, 백분위수 등
- _sum, _count, quantile 정보 제공
실제 예시
# CPU 사용률 모니터링
node_cpu_seconds_total{mode="idle"}

# HTTP 요청 수 추적
nginx_http_requests_total

# 메모리 사용량 확인
container_memory_working_set_bytes
2.2 로그 (Logs) - 이벤트 기반의 디버깅 및 문제 분석
정의 및 특성
- 시스템에서 발생한 이벤트를 기록한 텍스트나 구조화된 데이터
- 특정 행동이나 오류가 발생한 시점과 이유를 상세히 기록
- 디버깅과 문제 원인 분석에 가장 유용
- 구조화된 로그(JSON 등)와 비구조화된 로그로 구분
로그 레벨과 활용
ERROR: 오류 상황, 즉시 대응 필요
WARN:  경고, 잠재적 문제 상황
INFO:  일반적인 정보성 메시지
DEBUG: 개발 및 디버깅용 상세 정보
TRACE: 가장 상세한 실행 경로 추적
Cilium 환경에서의 로그 예시
# Cilium Agent 로그 확인
kubectl logs -n kube-system ds/cilium -c cilium-agent

# Hubble 로그 확인
kubectl logs -n kube-system deploy/hubble-relay

# 특정 Pod의 네트워킹 로그
hubble observe --pod myapp
2.3 트레이싱 (Tracing) - 분산 시스템에서 요청 흐름 파악
정의 및 특성
- 요청이 분산 시스템의 여러 구성 요소를 통해 이동하는 과정을 추적
- 각 서비스에서의 처리 시간과 의존성을 시각화
- 성능 병목 현상을 찾고 여러 서비스에 걸친 문제를 진단
- 마이크로서비스 아키텍처에서 특히 중요
분산 트레이싱의 구성 요소
Trace: 하나의 요청에 대한 전체 여행 경로
Span: Trace 내에서 특정 작업이나 서비스 호출
Tag: Span에 대한 메타데이터 (서비스명, 버전 등)
Log: Span 내에서 발생한 이벤트
3. SLI, SLO, SLA - 신뢰성 측정의 핵심 지표
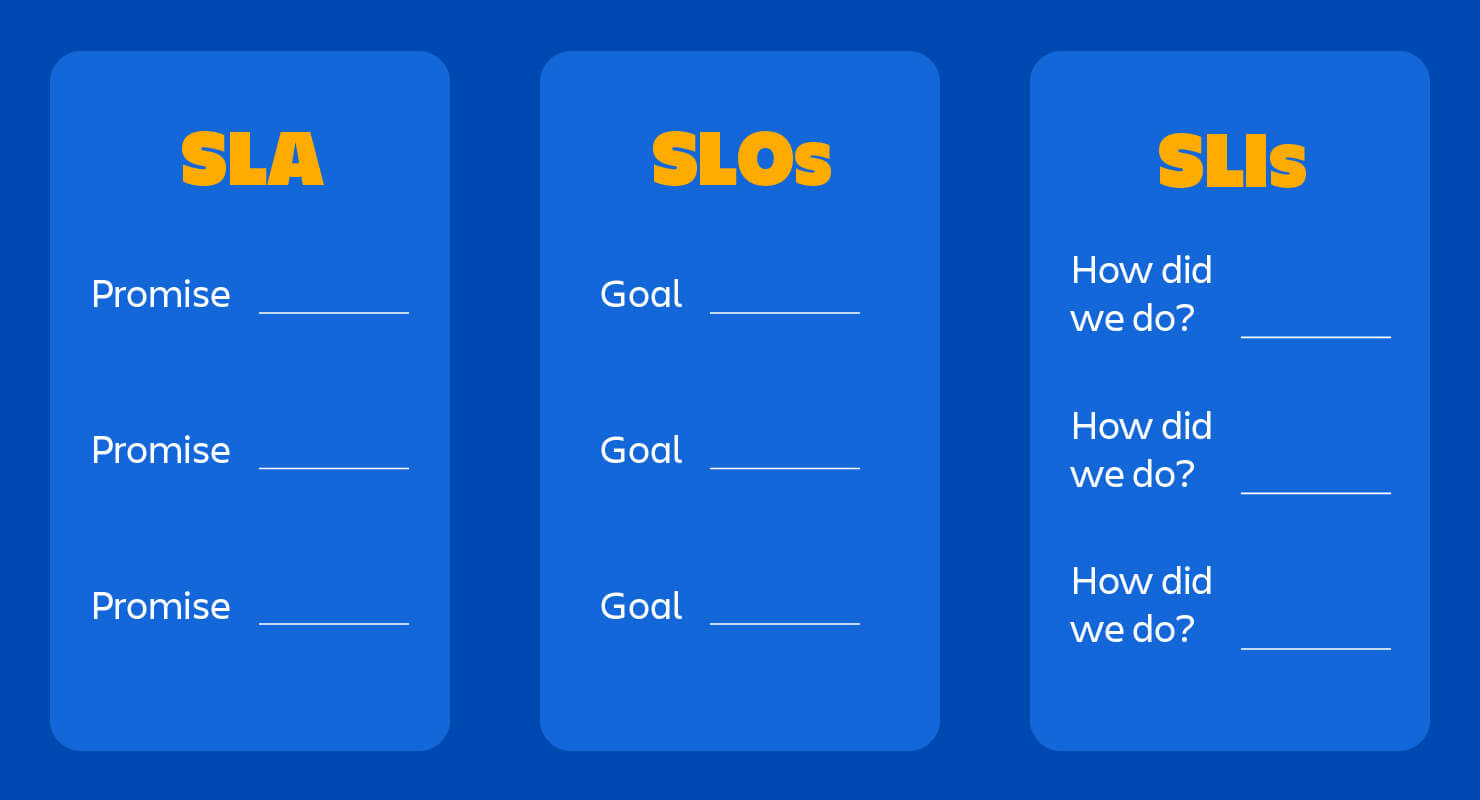
3.1 SLI (Service Level Indicator) - 서비스 수준 지표
정의
- 서비스 품질을 정량적으로 측정하는 주요 성능 지표
- 서비스의 신뢰성과 성능을 평가하는 실제 측정된 값
- 운영 데이터에서 계산되는 구체적인 메트릭
주요 SLI 예시
가용성 SLI:
- 30일 동안 서비스 정상 작동 시간의 비율
- 계산: (정상 시간 / 전체 시간) × 100

응답 시간 SLI:
- 100ms 이내의 응답률이 99.9%
- 계산: (100ms 이내 응답 수 / 전체 요청 수) × 100

오류율 SLI:
- 총 요청 중 오류 응답(5xx, 4xx)이 발생한 비율
- 계산: (오류 응답 수 / 전체 요청 수) × 100

처리량 SLI:
- 초당 처리 가능한 요청 수
- 계산: 특정 시간 동안의 총 처리 요청 수 / 시간(초)
3.2 SLO (Service Level Objective) - 서비스 수준 목표
정의
- 서비스가 유지해야 하는 목표 수준을 정의하는 값
- SLI(실제 측정값)에 대한 기준선(threshold)을 설정
- "이 정도의 성능을 유지해야 한다"는 내부 목표
SLO 설정 예시
가용성 SLO: "서비스 가용성 99.9% 이상 유지"
- Error Budget: 0.1% (월 43.2분의 다운타임 허용)

응답 시간 SLO: "모든 요청의 95%는 200ms 이내에 응답"
- P95 응답 시간 < 200ms

오류율 SLO: "오류율 0.1% 이하 유지"
- 1000개 요청 중 1개 이하의 오류만 허용

처리량 SLO: "초당 최소 1000개의 요청 처리"
- 피크 시간대에도 최소 성능 보장
3.3 SLA (Service Level Agreement) - 서비스 수준 계약
정의
- 서비스 제공자와 고객 간에 체결된 공식적인 계약
- 서비스 품질을 보장하는 법적 문서
- 계약 위반 시 페널티(배상)가 존재
SLA 계약 예시
가용성 SLA:
"서비스 가용성이 99.9% 미만이면, 고객에게 요금의 10% 환불"

응답 시간 SLA:
"트랜잭션 응답 시간이 500ms를 초과하면, 서비스 제공자가 손해 배상"

복구 시간 SLA:
"시스템 장애 시 4시간 이내 복구, 초과 시 일정 비율의 크레딧 제공"
👁️ Hubble: Cilium의 네트워크 관측 가능성 플랫폼
1. Hubble 아키텍처와 구성 요소
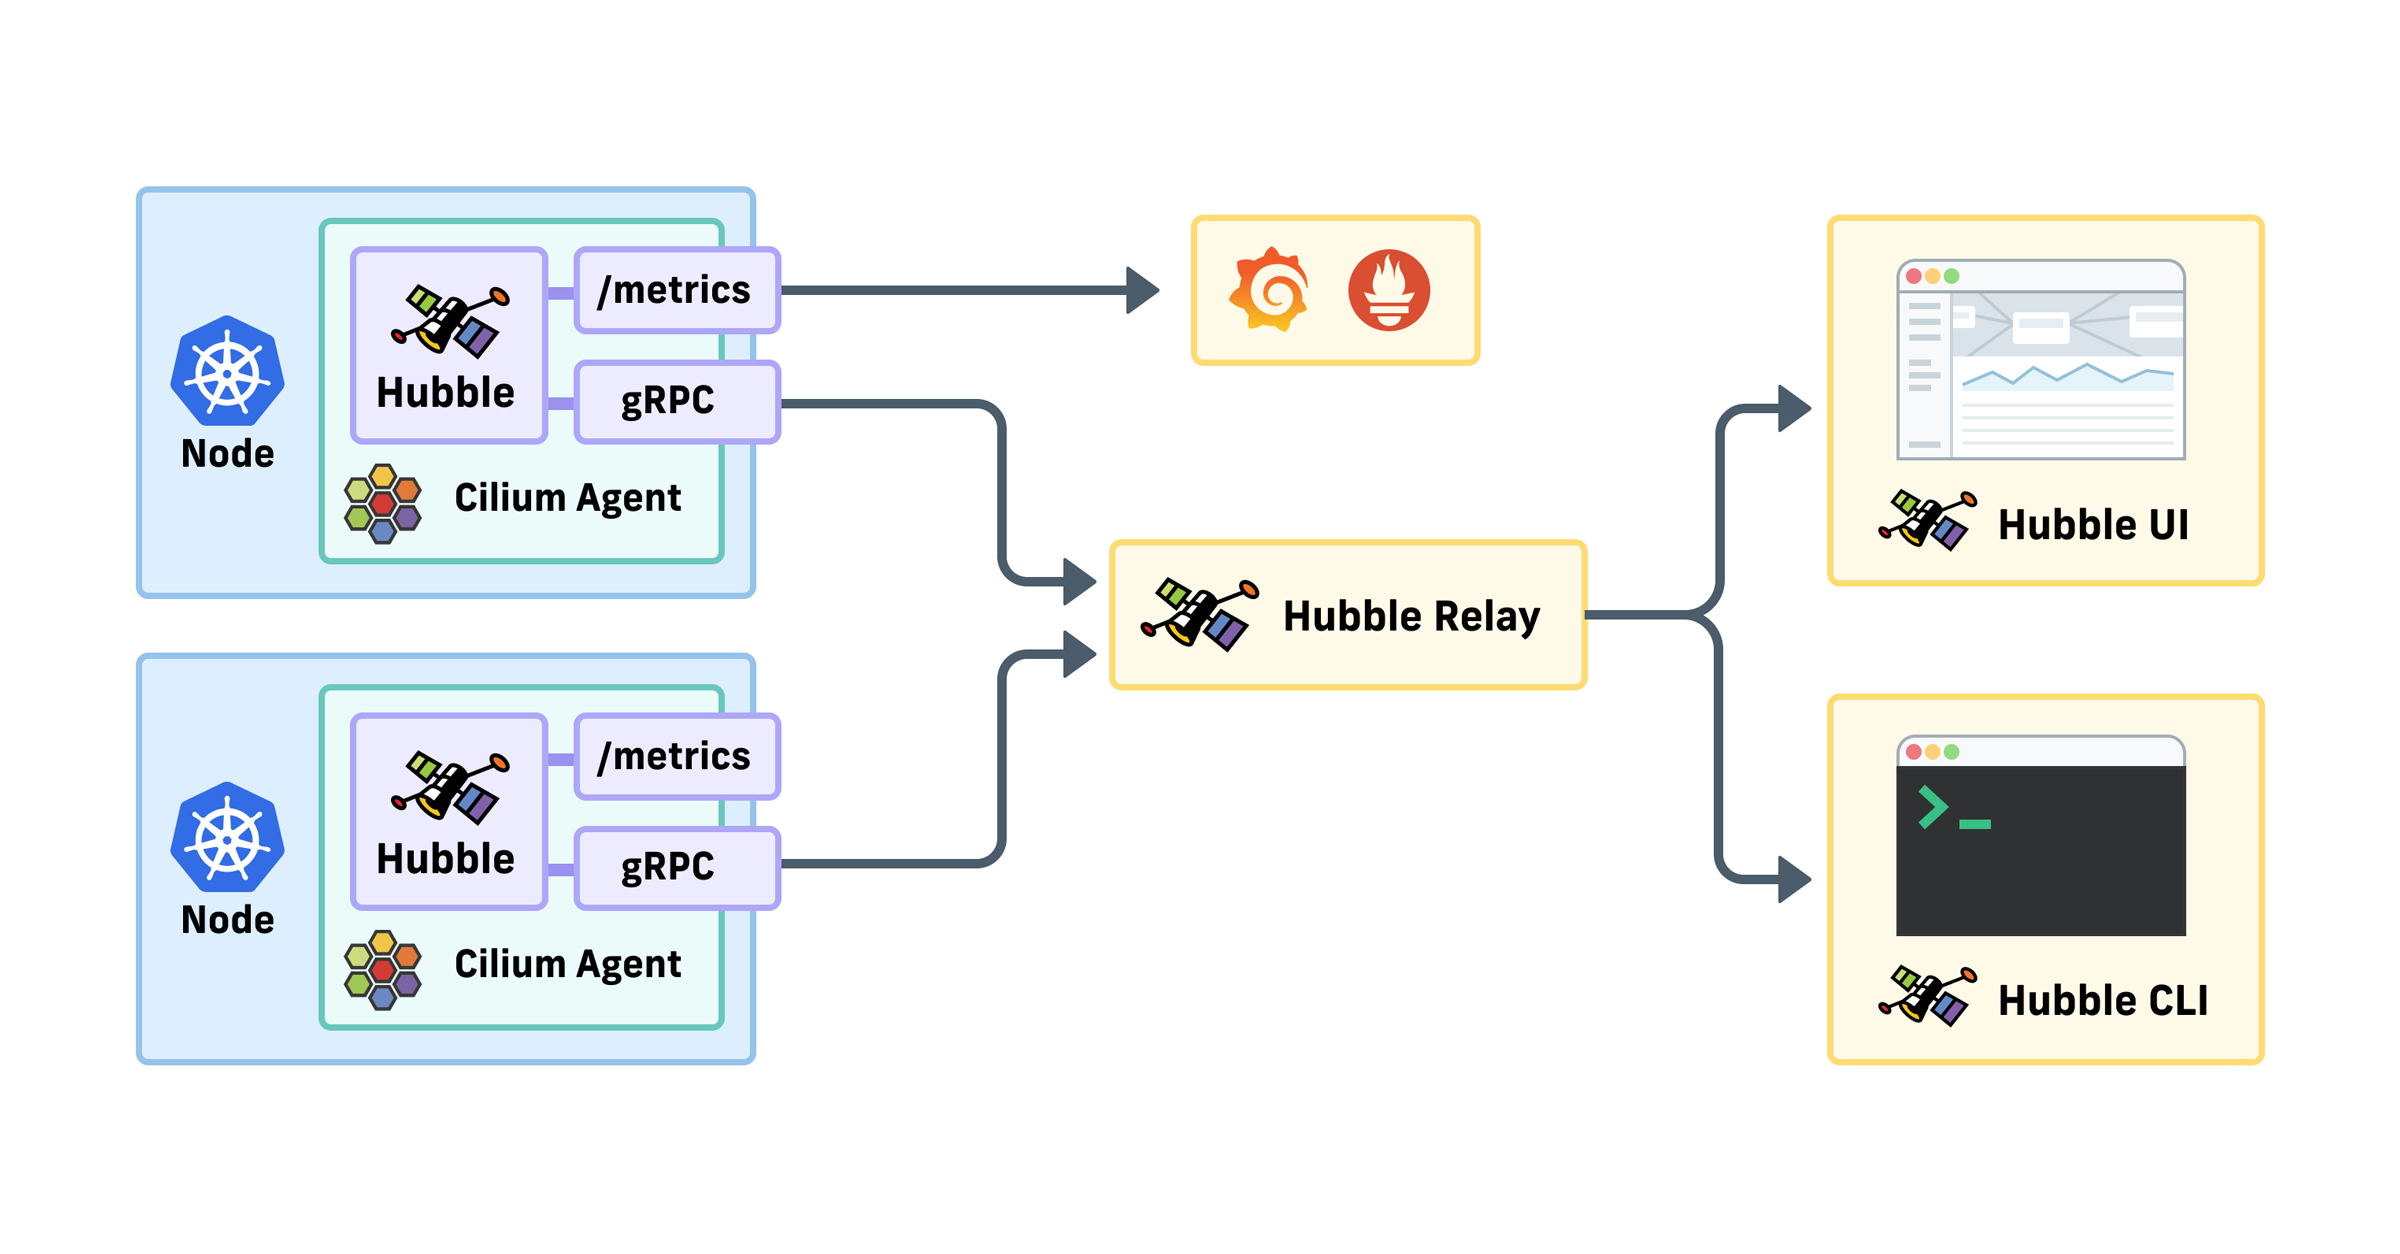
Hubble은 Cilium과 eBPF를 기반으로 구축된 완전히 분산된 네트워킹 및 보안 관측 가능성 플랫폼입니다. 네트워킹 인프라와 서비스 통신에 대한 깊은 가시성을 완전히 투명하게 제공합니다.
1.1 Hubble의 핵심 구성 요소
Hubble Agent (Cilium Agent 내장)
# 각 노드에서 실행되는 Hubble Agent 확인
kubectl get pods -n kube-system -l k8s-app=cilium

# Hubble Agent가 수집하는 메트릭 확인
cilium-dbg status | grep -i hubble- Cilium Agent와 함께 각 노드에서 실행
- eBPF 프로그램을 통해 실시간 네트워크 이벤트 수집
- 로컬 유닉스 도메인 소켓을 통해 Hubble API 제공
- 기본적으로 로컬 노드 범위 내에서만 동작
Hubble Relay
# Hubble Relay 배포 상태 확인
kubectl get deployment -n kube-system hubble-relay

# Hubble Relay 서비스 확인
kubectl get svc -n kube-system hubble-relay- 클러스터 전체의 Hubble API를 통합하는 프록시 서비스
- 여러 노드의 Hubble Agent로부터 데이터를 수집 및 집계
- gRPC API를 통해 외부 클라이언트에게 통합된 인터페이스 제공
- 멀티 클러스터 환경에서도 네트워크 가시성 지원
Hubble UI
# Hubble UI 접속 설정
NODEIP=$(ip -4 addr show eth1 | grep -oP '(?<=inet\s)\d+(\.\d+){3}')
echo "http://$NODEIP:31234"- 웹 기반 사용자 인터페이스
- L3/L4/L7 계층에서 서비스 종속성 그래프 자동 검색
- 사용자 친화적인 시각화 및 서비스 맵 제공
- 실시간 네트워크 플로우 필터링 및 분석
1.2 Hubble의 고급 기능들
서비스 의존성 및 통신 맵
- 서비스 간 통신 빈도와 패턴 분석
- 서비스 의존성 그래프 자동 생성
- HTTP 호출 및 Kafka 토픽 소비/생산 현황 추적
네트워크 모니터링 및 알림
- 네트워크 통신 실패 감지 및 원인 분석
- DNS 해결 문제 실시간 모니터링
- TCP 연결 중단 및 타임아웃 추적
애플리케이션 모니터링
- HTTP 응답 코드 (5xx, 4xx) 비율 추적
- 95th/99th 백분위수 지연시간 측정
- 서비스별 성능 비교 분석
보안 관측 가능성
- 네트워크 정책으로 인한 연결 차단 추적
- 클러스터 외부에서의 서비스 접근 모니터링
- DNS 조회 패턴 분석을 통한 보안 위협 탐지
2. Hubble 설치 및 구성
2.1 Hubble 활성화
# 기본 Hubble 활성화
cilium hubble enable

# UI와 함께 Hubble 활성화
cilium hubble enable --ui

# Helm을 통한 고급 설정
helm upgrade cilium cilium/cilium \
  --namespace kube-system \
  --reuse-values \
  --set hubble.enabled=true \
  --set hubble.ui.enabled=true \
  --set hubble.relay.enabled=true \
  --set hubble.ui.service.type=NodePort \
  --set hubble.ui.service.nodePort=31234
2.2 Hubble 메트릭 설정
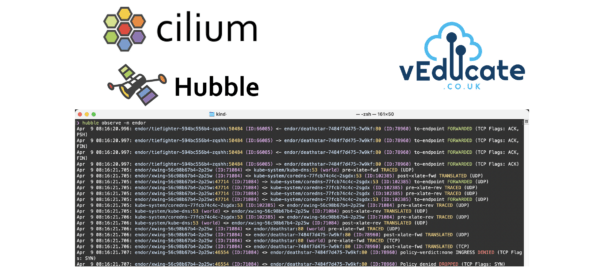
# 포괄적인 메트릭 활성화
helm upgrade cilium cilium/cilium \
  --namespace kube-system \
  --reuse-values \
  --set hubble.metrics.enableOpenMetrics=true \
  --set hubble.metrics.enabled="{dns,drop,tcp,flow,port-distribution,icmp,httpV2:exemplars=true;labelsContext=source_ip,source_namespace,source_workload,destination_ip,destination_namespace,destination_workload}"
주요 Hubble 메트릭 카테고리
DNS 메트릭:
- hubble_dns_queries_total: DNS 쿼리 총 수
- hubble_dns_responses_total: DNS 응답 총 수
- hubble_dns_response_types_total: DNS 응답 타입별 통계

네트워크 플로우 메트릭:
- hubble_flows_total: 네트워크 플로우 총 수
- hubble_tcp_flags_total: TCP 플래그별 패킷 수
- hubble_icmp_total: ICMP 패킷 통계

보안 메트릭:
- hubble_drop_total: 드롭된 패킷 수
- hubble_policy_verdict_total: 정책 판정 결과

HTTP 메트릭:
- hubble_http_requests_total: HTTP 요청 총 수
- hubble_http_request_duration_seconds: HTTP 요청 지연시간
- hubble_http_responses_total: HTTP 응답 코드별 통계
2.3 Hubble CLI 설치 및 활용
# Hubble CLI 설치
HUBBLE_VERSION=$(curl -s https://raw.githubusercontent.com/cilium/hubble/master/stable.txt)
HUBBLE_ARCH=amd64
if [ "$(uname -m)" = "aarch64" ]; then HUBBLE_ARCH=arm64; fi
curl -L --fail --remote-name-all \
  https://github.com/cilium/hubble/releases/download/$HUBBLE_VERSION/hubble-linux-${HUBBLE_ARCH}.tar.gz{,.sha256sum}
sha256sum --check hubble-linux-${HUBBLE_ARCH}.tar.gz.sha256sum
sudo tar xzvfC hubble-linux-${HUBBLE_ARCH}.tar.gz /usr/local/bin

# Hubble 상태 확인
hubble status

# 포트 포워딩을 통한 API 접근
cilium hubble port-forward &
3. Hubble 실시간 관찰 및 분석
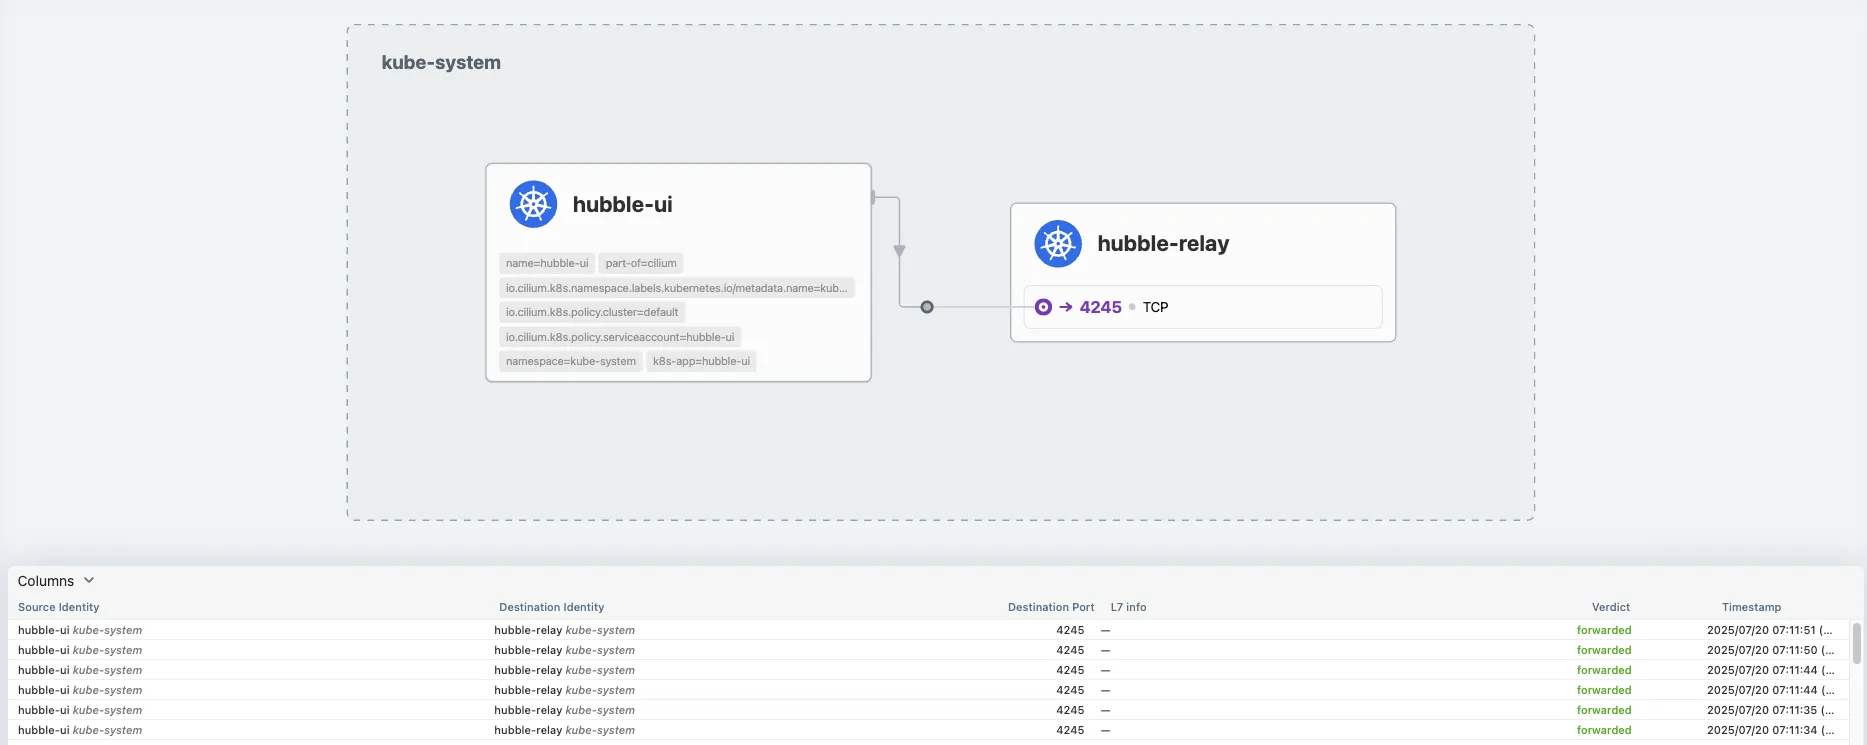
3.1 기본 관찰 명령어
# 모든 네트워크 플로우 관찰
hubble observe

# 특정 네임스페이스의 플로우만 관찰
hubble observe --namespace kube-system

# 특정 Pod의 플로우 관찰
hubble observe --pod myapp

# HTTP 트래픽만 필터링
hubble observe --protocol http

# 드롭된 패킷만 관찰
hubble observe --verdict DROPPED

# DNS 쿼리 관찰
hubble observe --type dns

# 특정 포트의 트래픽 관찰
hubble observe --port 80
3.2 고급 필터링 및 분석
# 소스와 목적지 기반 필터링
hubble observe --from-namespace kube-system --to-namespace default

# 특정 서비스 간 통신 관찰
hubble observe --from-service backend --to-service database

# 시간 범위 지정 관찰
hubble observe --since=5m --until=1m

# JSON 형태로 출력
hubble observe --output json

# 통계 정보 출력
hubble observe --print-raw-filters

# 노드별 관찰
hubble observe --node k8s-w1
3.3 네트워크 정책 검증 및 디버깅
# 정책으로 인한 차단 추적
hubble observe --verdict DENIED

# 특정 레이블을 가진 Pod 간 통신 관찰
hubble observe --from-label app=frontend --to-label app=backend

# L7 HTTP 정책 적용 상태 확인
hubble observe --http-status 403

# 네트워크 정책 위반 사항 추적
hubble observe --type policy-verdict
4. Hubble UI를 통한 시각적 분석
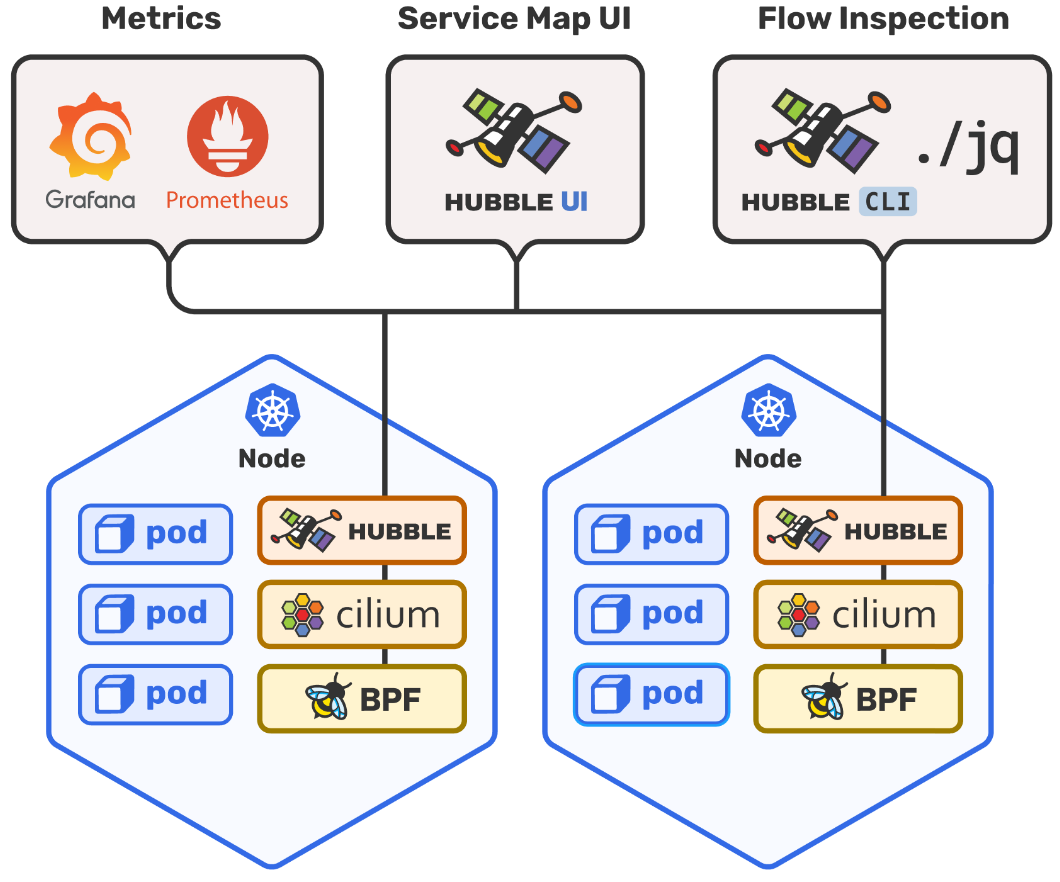
4.1 서비스 맵 기능
자동 서비스 발견
- 클러스터 내 모든 서비스와 Pod 자동 감지
- 실시간 통신 패턴 시각화
- 서비스 간 의존성 그래프 자동 생성
인터랙티브 필터링
- 네임스페이스별 필터링
- 특정 시간 범위 선택
- 프로토콜별 트래픽 분석
- 응답 코드별 필터링
4.2 플로우 분석 대시보드
실시간 플로우 모니터링
- 패킷 수준의 상세한 네트워크 활동
- 소스/목적지 정보와 메타데이터
- L3/L4/L7 레이어별 분석
- 정책 적용 결과 시각화
성능 분석
- 지연시간 분포 히스토그램
- 처리량 트렌드 분석
- 오류율 추적
- 병목 구간 식별
5. Hubble 로그 내보내기 및 중앙 집중식 로깅
5.1 정적 로그 내보내기 설정
# Hubble 플로우 로그를 파일로 내보내기
helm upgrade cilium cilium/cilium \
  --namespace kube-system \
  --reuse-values \
  --set hubble.export.static.enabled=true \
  --set hubble.export.static.filePath=/var/run/cilium/hubble/events.log

# 로그 파일 확인
kubectl exec -n kube-system ds/cilium -c cilium-agent -- ls -la /var/run/cilium/hubble/
kubectl exec -n kube-system ds/cilium -c cilium-agent -- tail -f /var/run/cilium/hubble/events.log
📊 Prometheus & Grafana: 메트릭 수집 및 시각화
1. Prometheus 아키텍처 심화 분석
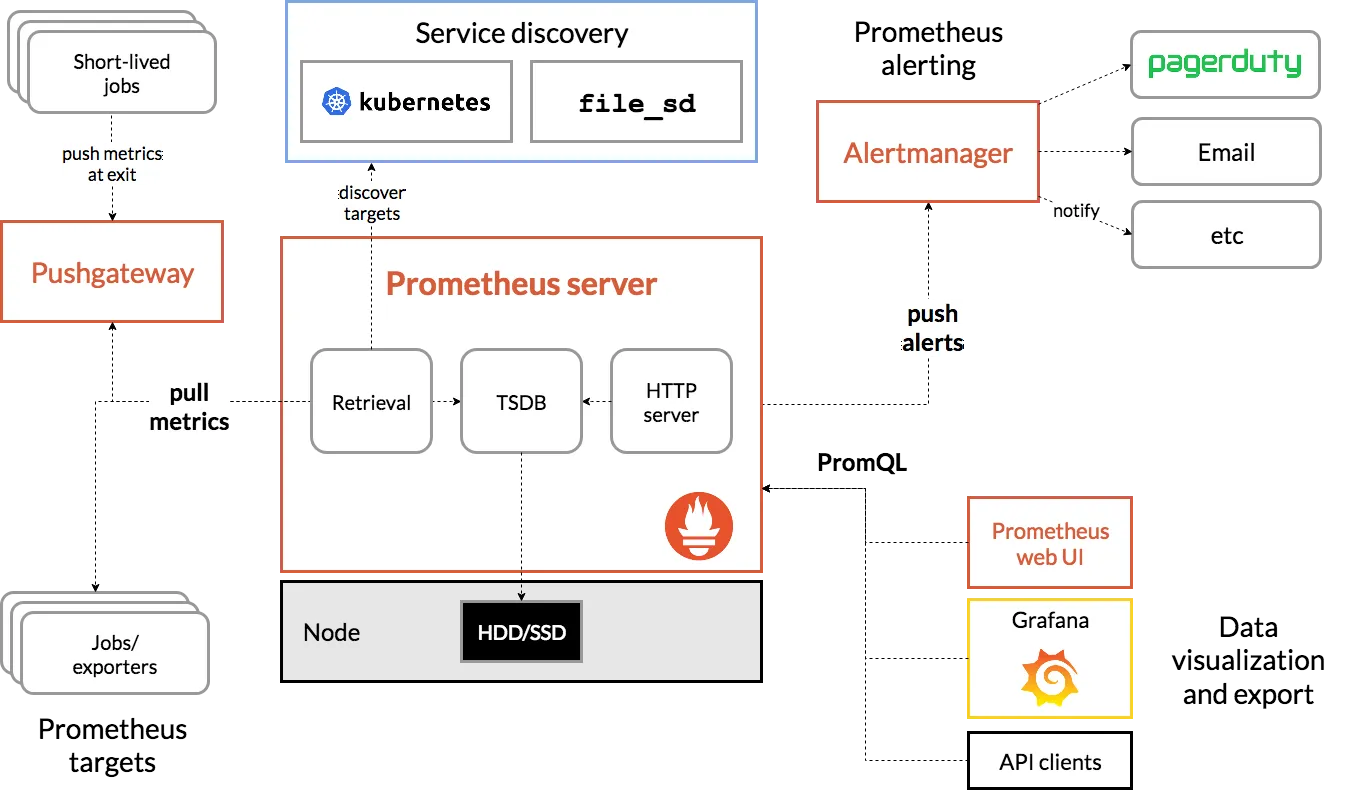
Prometheus는 시계열 데이터베이스(TSDB)를 기반으로 한 오픈소스 모니터링 및 알림 툴킷입니다. SoundCloud에서 개발된 이 시스템은 현재 CNCF의 graduated 프로젝트로 클라우드 네이티브 환경의 표준 모니터링 솔루션입니다.
1.1 Prometheus의 핵심 구성 요소
Prometheus Server
# Prometheus 서버 설정 확인
kubectl get configmap -n cilium-monitoring prometheus -o yaml

# Prometheus 설정 내용 분석
kubectl describe configmap -n cilium-monitoring prometheus- 메트릭 데이터를 수집(scrape)하고 저장하는 메인 서버
- 다차원 데이터 모델을 통한 효율적인 데이터 관리
- PromQL을 통한 강력한 쿼리 기능 제공
- 내장된 시계열 데이터베이스로 장기간 데이터 보관
Service Discovery
# Kubernetes Service Discovery 설정 예시
scrape_configs:
  - job_name: 'kubernetes-pods'
    kubernetes_sd_configs:
    - role: pod
    relabel_configs:
    - source_labels: [__meta_kubernetes_pod_annotation_prometheus_io_scrape]
      action: keep
regex: true- Kubernetes API를 통한 자동 타겟 발견
- DNS, 파일, Consul 등 다양한 서비스 디스커버리 지원
- 동적 환경에서 자동으로 모니터링 대상 추가/제거
Exporters
# Cilium 메트릭 포트 확인
ss -tnlp | grep -E '9962|9963|9965'

# 각 노드에서 메트릭 수집 확인
for i in {100..102}; do
  echo "=== k8s-${i} ==="
  sshpass -p 'vagrant' ssh vagrant@192.168.10.$i sudo ss -tnlp | grep -E '9962|9963|9965'
done
1.2 Prometheus 메트릭 타입 상세 분석
Counter - 누적 카운터
# HTTP 요청 총 수 (지속적으로 증가)
nginx_http_requests_total

# 초당 HTTP 요청 비율 계산
rate(nginx_http_requests_total[5m])

# 네트워크 패킷 수 증가율
rate(node_network_receive_bytes_total[1m])
Gauge - 게이지
# 현재 메모리 사용량
node_memory_Active_bytes

# CPU 온도
node_hwmon_temp_celsius

# 현재 실행 중인 프로세스 수
node_procs_running
Histogram - 히스토그램
# HTTP 요청 지연시간 분포
http_request_duration_seconds_bucket

# 응답 시간의 95% 백분위수 계산
histogram_quantile(0.95, rate(http_request_duration_seconds_bucket[5m]))

# 평균 응답 시간 계산
rate(http_request_duration_seconds_sum[5m]) / rate(http_request_duration_seconds_count[5m])
Summary - 서머리
# 기본 백분위수 메트릭
http_request_duration_seconds{quantile="0.95"}
http_request_duration_seconds{quantile="0.99"}

# 총 요청 수와 총 시간
http_request_duration_seconds_count
http_request_duration_seconds_sum
2. Cilium과 Prometheus 통합 설정
2.1 Cilium 메트릭 활성화
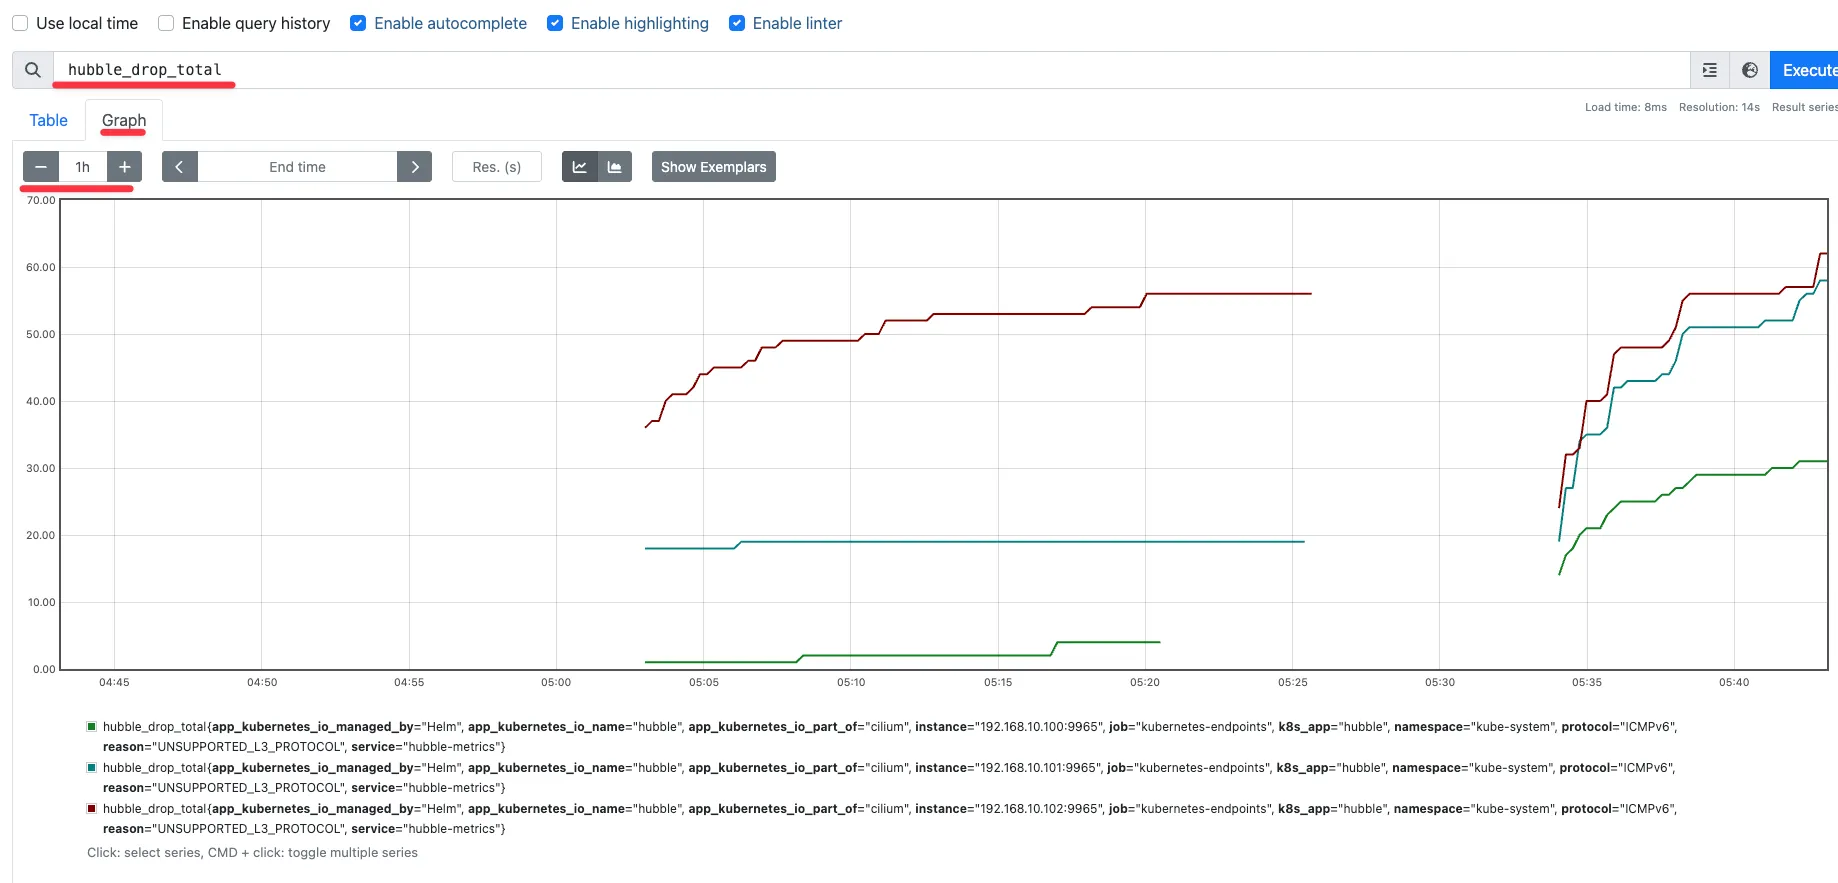
# Cilium 메트릭 활성화 설정
helm upgrade cilium cilium/cilium \
  --namespace kube-system \
  --reuse-values \
  --set prometheus.enabled=true \
  --set operator.prometheus.enabled=true \
  --set hubble.enabled=true \
  --set hubble.metrics.enableOpenMetrics=true \
  --set hubble.metrics.enabled="{dns,drop,tcp,flow,port-distribution,icmp,httpV2:exemplars=true;labelsContext=source_ip,source_namespace,source_workload,destination_ip,destination_namespace,destination_workload}"

# 메트릭 포트 확인
ss -tnlp | grep -E '9962|9963|9965'
# 9962: Cilium Agent 메트릭
# 9963: Cilium Operator 메트릭
# 9965: Hubble 메트릭
2.2 Prometheus와 Grafana 배포
# 모니터링 스택 배포
kubectl apply -f https://raw.githubusercontent.com/cilium/cilium/1.17.6/examples/kubernetes/addons/prometheus/monitoring-example.yaml

# 배포 확인
kubectl get all -n cilium-monitoring

# ConfigMap 확인
kubectl get configmap -n cilium-monitoring
# - prometheus: Prometheus 서버 설정
# - grafana-config: Grafana 기본 설정
# - grafana-cilium-dashboard: Cilium 대시보드
# - grafana-hubble-dashboard: Hubble 대시보드
# - grafana-cilium-operator-dashboard: Cilium Operator 대시보드
2.3 외부 접속을 위한 NodePort 설정
# Prometheus NodePort 설정
kubectl patch svc -n cilium-monitoring prometheus -p '{"spec": {"type": "NodePort", "ports": [{"port": 9090, "targetPort": 9090, "nodePort": 30001}]}}'

# Grafana NodePort 설정
kubectl patch svc -n cilium-monitoring grafana -p '{"spec": {"type": "NodePort", "ports": [{"port": 3000, "targetPort": 3000, "nodePort": 30002}]}}'

# 접속 URL 확인
echo "Prometheus: http://192.168.10.100:30001"
echo "Grafana: http://192.168.10.100:30002"
3. PromQL 쿼리 언어 마스터하기
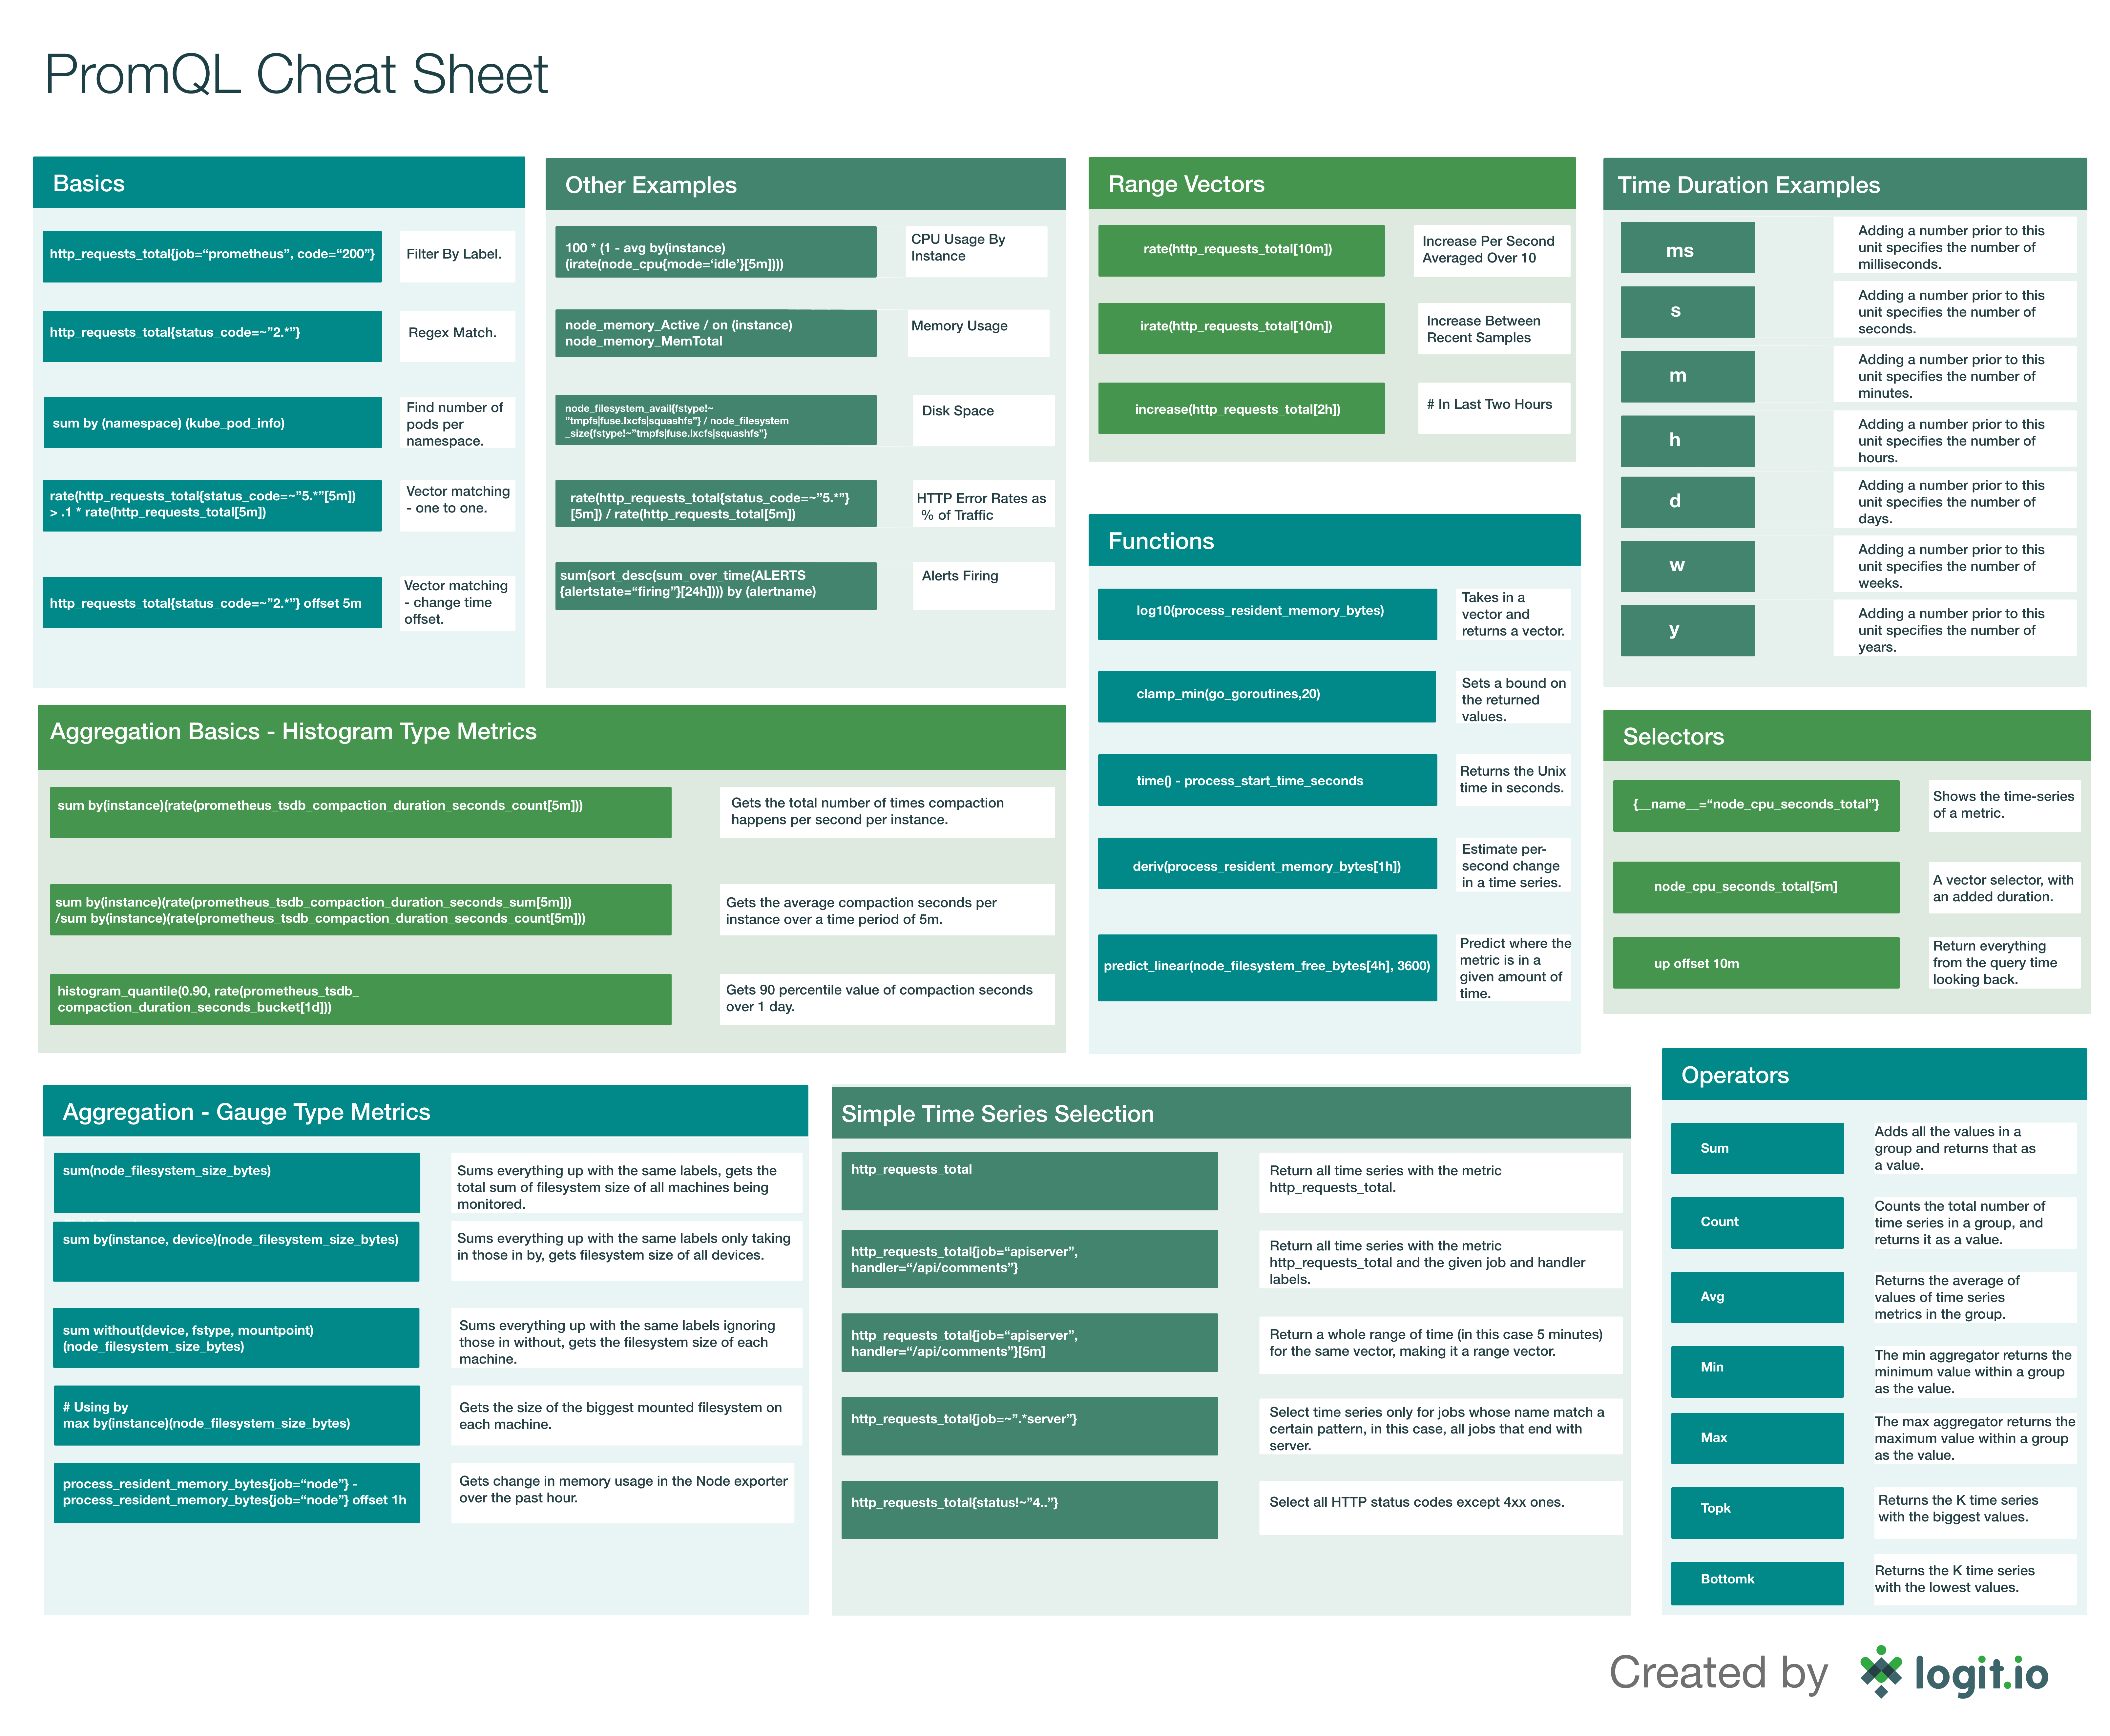
3.1 Label Matchers (레이블 매처)
# 정확히 일치
node_memory_Active_bytes{instance="192.168.10.101:9100"}

# 일치하지 않음
node_memory_Active_bytes{instance!="192.168.10.101:9100"}

# 정규표현식 일치
node_memory_Active_bytes{instance=~"192.168.10.*:9100"}

# 정규표현식 불일치
node_memory_Active_bytes{instance!~"192.168.1.*:9100"}

# 다중 조건 (AND)
kube_deployment_status_replicas_available{namespace="kube-system", deployment="coredns"}

# 다중 값 매칭
node_memory_Active_bytes{instance=~"192.168.10.101:9100|192.168.10.102:9100"}
3.2 Binary Operators (이진 연산자)
산술 연산자
# 메모리를 MB 단위로 변환
node_memory_Active_bytes / 1024 / 1024

# 메모리 사용률 계산
(node_memory_MemTotal_bytes - node_memory_MemAvailable_bytes) / node_memory_MemTotal_bytes * 100

# CPU 사용률 계산 (idle 제외)
100 - (avg(rate(node_cpu_seconds_total{mode="idle"}[5m])) * 100)
비교 연산자
# HTTP 요청이 100개 이상인 경우
nginx_http_requests_total > 100

# 메모리 사용률이 80% 이상인 노드
(node_memory_MemTotal_bytes - node_memory_MemAvailable_bytes) / node_memory_MemTotal_bytes > 0.8

# 5xx 오류가 발생한 경우만 필터링
nginx_http_requests_total{status=~"5.."}
논리/집합 연산자
# AND 연산 (교집합)
up{job="node-exporter"} and node_load1 > 2

# OR 연산 (합집합)
up{job="node-exporter"} or up{job="kubernetes-pods"}

# UNLESS 연산 (차집합)
up{job="node-exporter"} unless node_memory_MemAvailable_bytes < 1000000000
3.3 Aggregation Operators (집계 연산자)
기본 집계 함수
# 총합 계산
sum(node_memory_Active_bytes)

# 노드별 총합
sum(node_memory_Active_bytes) by (instance)

# 최댓값/최솟값
max(node_memory_Active_bytes)
min(node_memory_Active_bytes)

# 평균값
avg(node_memory_Active_bytes)

# 개수 세기
count(up{job="node-exporter"})

# 상위 N개 값
topk(3, node_memory_Active_bytes)

# 하위 N개 값
bottomk(3, node_memory_Active_bytes)
고급 집계 연산
# 백분위수 계산
quantile(0.95, node_memory_Active_bytes)

# 표준편차
stddev(node_memory_Active_bytes)

# 특정 레이블 제외하고 집계
sum(nginx_http_requests_total) without (instance, container, endpoint)

# 그룹별 집계
sum(kube_deployment_status_replicas_available) by (namespace)
3.4 Time Series Selectors (시계열 선택자)
인스턴트 벡터 vs 레인지 벡터
# 인스턴트 벡터 (현재 시점)
node_cpu_seconds_total

# 레인지 벡터 (시간 범위)
node_cpu_seconds_total[5m]  # 지난 5분간 데이터
node_cpu_seconds_total[1h]  # 지난 1시간 데이터
node_cpu_seconds_total[1d]  # 지난 1일간 데이터
시간 단위
ms: 밀리초
s:  초
m:  분
h:  시간
d:  일
w:  주
y:  년
Rate 함수와 활용
# 초당 변화율 계산
rate(node_cpu_seconds_total[5m])

# 노드별 CPU 사용률
100 - (avg(rate(node_cpu_seconds_total{mode="idle"}[5m])) by (instance) * 100)

# 네트워크 트래픽 변화율
rate(node_network_receive_bytes_total[1m])

# HTTP 요청 증가율
rate(nginx_http_requests_total[5m])
4. Grafana 대시보드 구성과 시각화
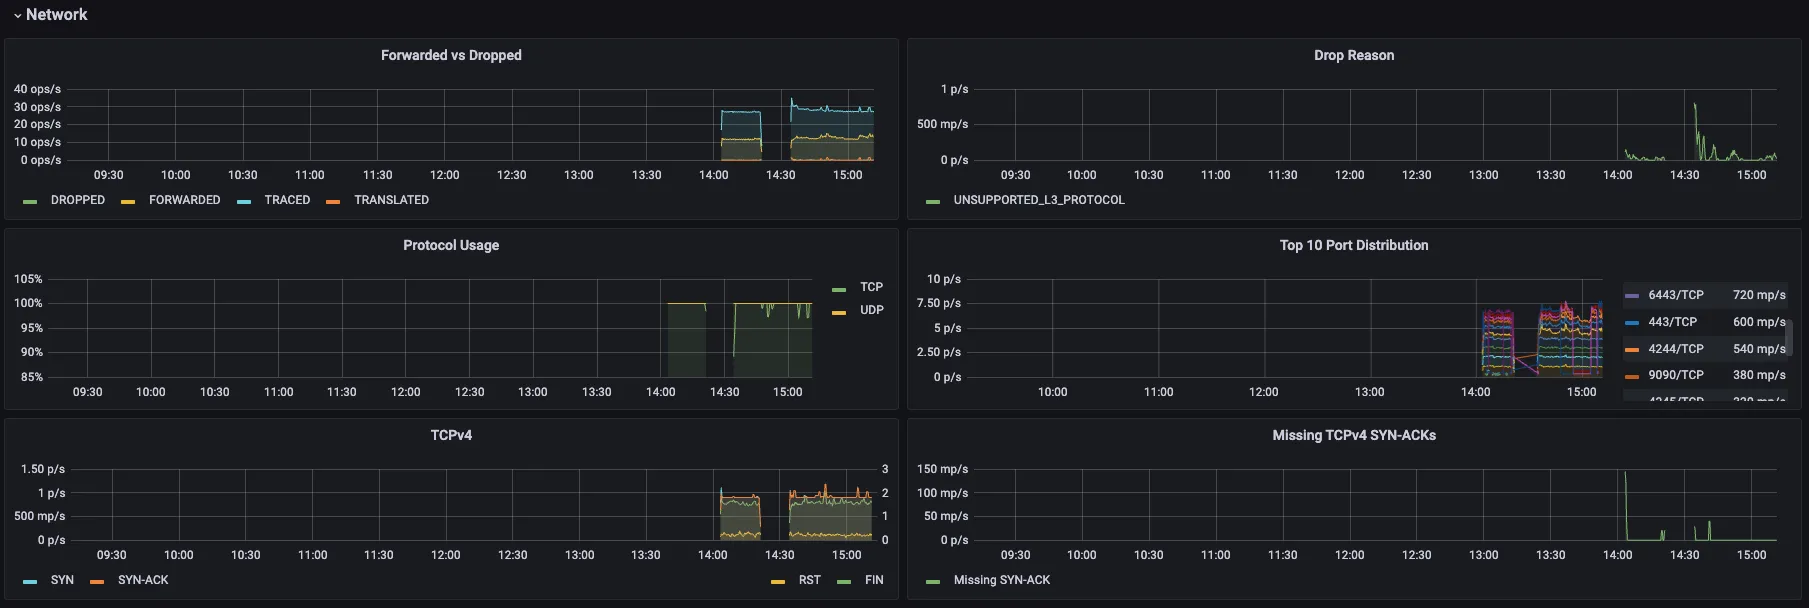
4.1 미리 구성된 Cilium 대시보드
Cilium Metrics 대시보드
# Cilium Agent 상태
cilium_agents_running
cilium_endpoints_regenerating

# eBPF 메트릭
cilium_bpf_maps_virtual_memory_max_bytes
cilium_bpf_map_ops_total

# 네트워크 정보
cilium_nodes_all_num
cilium_services_total
Hubble 대시보드
# DNS 쿼리 메트릭
rate(hubble_dns_queries_total[5m])
rate(hubble_dns_responses_total[5m])

# 네트워크 플로우
rate(hubble_flows_total[5m])
hubble_drop_total

# HTTP 메트릭
rate(hubble_http_requests_total[5m])
histogram_quantile(0.95, hubble_http_request_duration_seconds_bucket)
Cilium Operator 대시보드
# IPAM 상태
cilium_operator_ipam_allocation_duration_seconds
cilium_operator_ipam_available_ips

# 노드 관리
cilium_operator_nodes_managed_total
cilium_operator_k8s_client_api_calls_total
5. 알림(Alerting) 설정
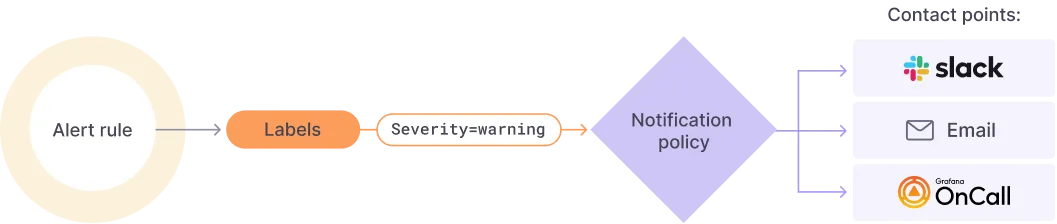
5.1 Contact Points 설정
Slack 통합
# Slack Webhook 설정
Integration: Slack
Webhook URL: https://hooks.slack.com/services/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
Username: monitoring-bot
Channel: #alerts
Title: Cilium Cluster Alert
5.2 Alert Rules 생성
NGINX 트래픽 임계값 알림
# Query A: NGINX 요청 수
sum(rate(nginx_http_requests_total[1m])) * 60

# Condition: B > 60 (1분간 60개 이상 요청)
# Evaluation: 1분마다 확인
# Pending period: 1분간 지속 시 알림
노드 리소스 알림
# CPU 사용률 알림
100 - (avg(rate(node_cpu_seconds_total{mode="idle"}[5m])) by (instance) * 100) > 80

# 메모리 사용률 알림
((node_memory_MemTotal_bytes - node_memory_MemAvailable_bytes) / node_memory_MemTotal_bytes) * 100 > 85

# 디스크 사용률 알림
(1 - (node_filesystem_avail_bytes{fstype!="tmpfs"} / node_filesystem_size_bytes{fstype!="tmpfs"})) * 100 > 90
5.3 Notification Policies
# 기본 정책 설정
Default contact point: slack
Group wait: 10s
Group interval: 5m
Repeat interval: 12h

# 심각도별 정책
- Critical: 즉시 알림
- Warning: 5분 후 알림
- Info: 일일 요약
🔍 Layer 7 프로토콜 가시성
1. HTTP/HTTPS 트래픽 분석
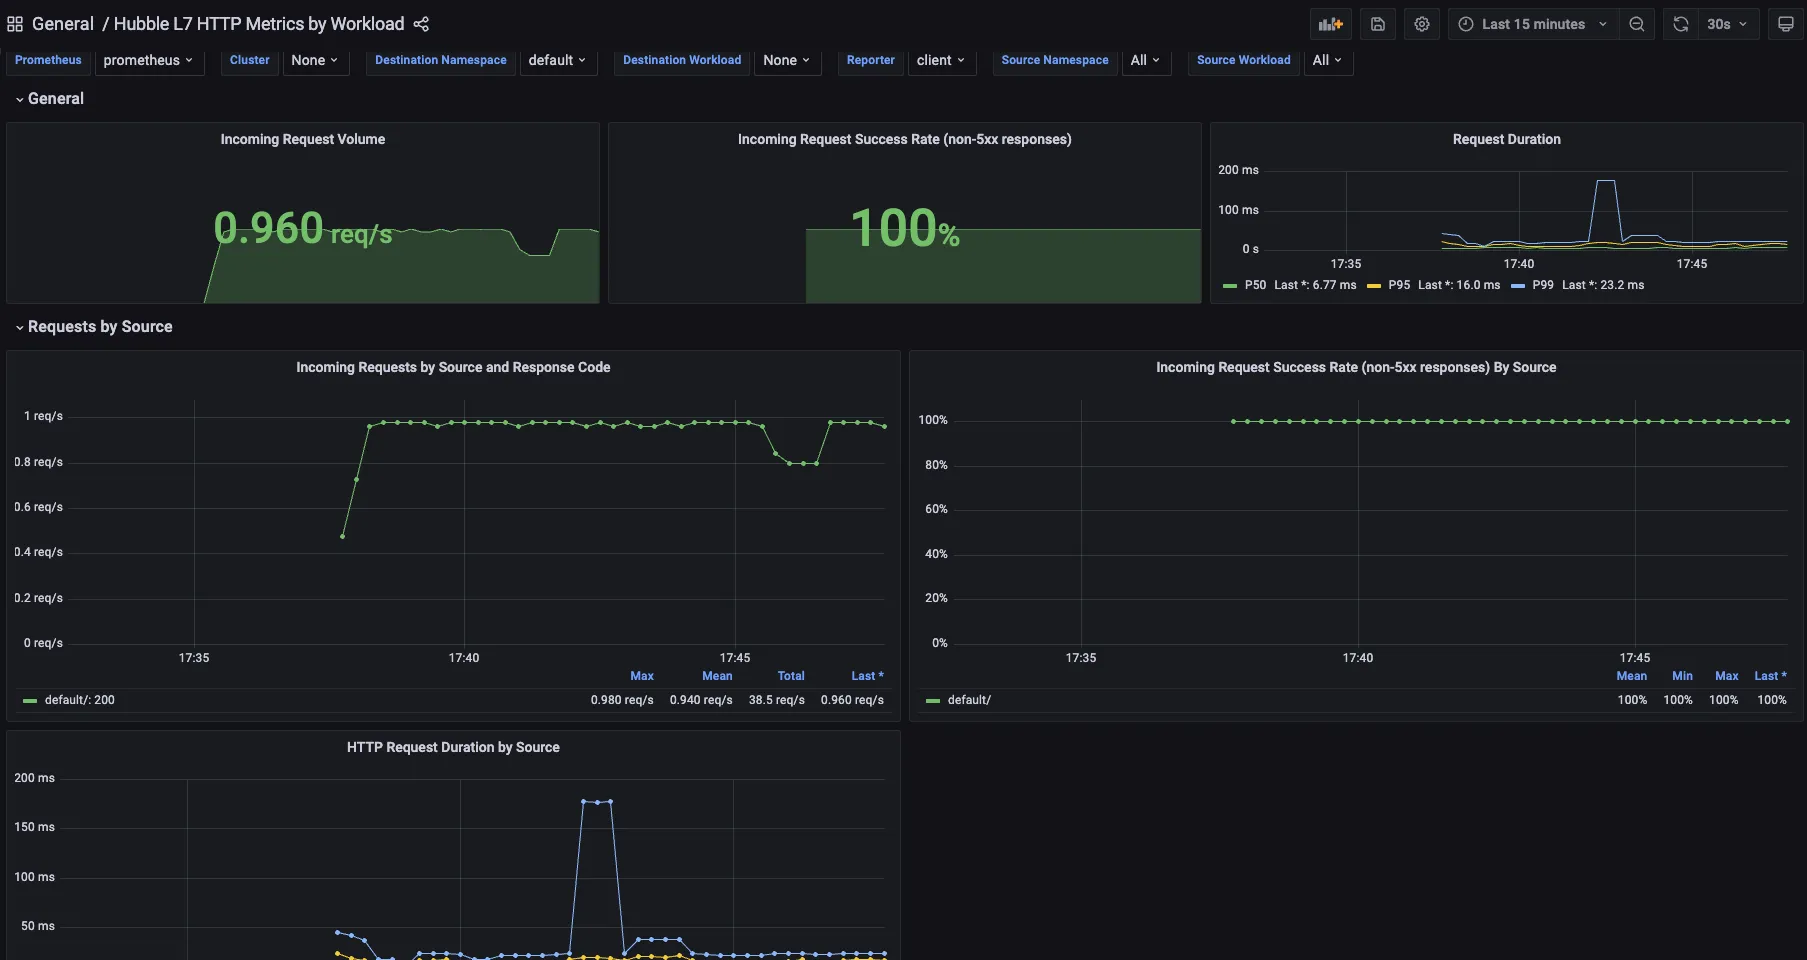
1.1 HTTP 요청 모니터링
# HTTP 트래픽 실시간 관찰
hubble observe --protocol http

# 특정 HTTP 메서드 필터링
hubble observe --http-method GET
hubble observe --http-method POST

# HTTP 상태 코드별 필터링
hubble observe --http-status 200
hubble observe --http-status 404
hubble observe --http-status 500

# 특정 URL 패턴 관찰
hubble observe --http-path "/api/*"
1.2 HTTP 메트릭 분석
# HTTP 요청 총 수
sum(rate(hubble_http_requests_total[5m])) by (source_workload, destination_workload)

# HTTP 응답 코드별 분포
sum(rate(hubble_http_requests_total[5m])) by (status)

# 4xx 오류율 계산
sum(rate(hubble_http_requests_total{status=~"4.."}[5m])) / sum(rate(hubble_http_requests_total[5m])) * 100

# 5xx 오류율 계산
sum(rate(hubble_http_requests_total{status=~"5.."}[5m])) / sum(rate(hubble_http_requests_total[5m])) * 100

# 평균 응답 시간
rate(hubble_http_request_duration_seconds_sum[5m]) / rate(hubble_http_request_duration_seconds_count[5m])
2. DNS 쿼리 분석
2.1 DNS 트래픽 모니터링
# DNS 쿼리 실시간 관찰
hubble observe --type dns

# 특정 도메인 쿼리 추적
hubble observe --type dns --dns-query "kubernetes.default.svc.cluster.local"

# DNS 응답 코드별 필터링
hubble observe --type dns --verdict ALLOWED
hubble observe --type dns --verdict DENIED
2.2 DNS 메트릭 분석
# DNS 쿼리 비율
rate(hubble_dns_queries_total[5m])

# DNS 응답 성공률
rate(hubble_dns_responses_total{rcode="No Error"}[5m]) / rate(hubble_dns_responses_total[5m]) * 100

# DNS 쿼리 타입별 분포
sum(rate(hubble_dns_queries_total[5m])) by (qtypes)

# DNS 실패 쿼리 추적
rate(hubble_dns_responses_total{rcode!="No Error"}[5m])
3. 커스텀 L7 정책 적용
3.1 HTTP 기반 네트워크 정책
apiVersion: "cilium.io/v2"
kind: CiliumNetworkPolicy
metadata:
  name: "http-l7-policy"
spec:
  endpointSelector:
    matchLabels:
      app: backend
  ingress:
  - fromEndpoints:
    - matchLabels:
        app: frontend
    toPorts:
    - ports:
      - port: "80"
        protocol: TCP
      rules:
        http:
        - method: "GET"
          path: "/api/v1/.*"
        - method: "POST"
          path: "/api/v1/users"
          headers:
          - "Content-Type: application/json"
3.2 DNS 기반 정책
apiVersion: "cilium.io/v2"
kind: CiliumNetworkPolicy
metadata:
  name: "dns-policy"
spec:
  endpointSelector:
    matchLabels:
      app: web-app
  egress:
  - toFQDNs:
    - matchName: "api.github.com"
    - matchPattern: "*.amazonaws.com"
  - toPorts:
    - ports:
      - port: "53"
        protocol: UDP
      rules:
        dns:
        - matchPattern: "*.cluster.local"
🛠️ pwru: eBPF 기반 패킷 추적 도구
1. pwru 소개 및 설치
pwru는 eBPF를 활용한 고성능 패킷 추적 도구로, 리눅스 커널 내에서 패킷의 전체 여행 경로를 추적할 수 있습니다.
# pwru 설치
wget https://github.com/cilium/pwru/releases/download/v1.0.5/pwru-linux-amd64.tar.gz
tar -xzf pwru-linux-amd64.tar.gz
sudo cp pwru /usr/local/bin/

# 커널 헤더 설치 (필요 시)
sudo apt-get install linux-headers-$(uname -r)

# BTF 지원 확인
ls /sys/kernel/btf/vmlinux || echo "BTF not available"
2. pwru 사용법
2.1 기본 패킷 추적
# 특정 IP로의 패킷 추적
sudo pwru --filter-dst-ip 10.244.1.100

# 특정 포트 트래픽 추적
sudo pwru --filter-dst-port 80

# HTTP 트래픽 추적
sudo pwru --filter-dst-port 80 --filter-proto tcp

# ICMP 패킷 추적
sudo pwru --filter-proto icmp

# 특정 인터페이스 패킷 추적
sudo pwru --filter-netdev eth0
2.2 고급 필터링
# 소스와 목적지 모두 지정
sudo pwru --filter-src-ip 10.244.1.100 --filter-dst-ip 10.244.2.200

# 패킷 크기 필터링
sudo pwru --filter-length ">1000"

# MAC 주소 기반 필터링
sudo pwru --filter-src-mac 02:42:ac:11:00:02

# 여러 조건 조합
sudo pwru \
  --filter-dst-ip 10.96.0.1 \
  --filter-dst-port 53 \
  --filter-proto udp \
  --output-tuple
2.3 출력 형태 커스터마이징
# 타임스탬프 포함
sudo pwru --filter-dst-port 80 --timestamp

# 패킷 내용 출력
sudo pwru --filter-dst-port 80 --output-tuple --output-stack

# JSON 형태 출력
sudo pwru --filter-dst-port 80 --output-tuple --output-json

# 특정 커널 함수만 추적
sudo pwru --filter-func "netif_receive_skb*" --filter-dst-port 80
3. 네트워크 문제 디버깅
3.1 패킷 드롭 분석
# 드롭된 패킷 추적
sudo pwru --filter-dst-ip 10.244.1.100 --filter-func "*drop*"

# iptables 관련 드롭
sudo pwru --filter-func "*iptables*" --filter-dst-port 80

# 네트워크 네임스페이스 관련 이슈
sudo pwru --filter-func "*netns*" --filter-dst-ip 10.244.1.100
3.2 성능 병목 분석
# 패킷 처리 지연시간 측정
sudo pwru --filter-dst-port 80 --output-stack --timestamp

# 특정 네트워크 드라이버 성능 분석
sudo pwru --filter-func "*e1000*" --filter-proto tcp

# XDP 관련 성능 추적
sudo pwru --filter-func "*xdp*" --filter-dst-port 80
🎯 실습 과제 및 도전 과제
1. 기본 실습 과제
과제 1: 샘플 애플리케이션 모니터링
# 1. 샘플 웹 애플리케이션 배포
cat << EOF | kubectl apply -f -
apiVersion: apps/v1
kind: Deployment
metadata:
  name: webpod
spec:
  replicas: 2
  selector:
    matchLabels:
      app: webpod
  template:
    metadata:
      labels:
        app: webpod
    spec:
      affinity:
        podAntiAffinity:
          requiredDuringSchedulingIgnoredDuringExecution:
          - labelSelector:
              matchExpressions:
              - key: app
                operator: In
                values:
                - webpod
            topologyKey: "kubernetes.io/hostname"
      containers:
      - name: webpod
        image: traefik/whoami
        ports:
        - containerPort: 80
---
apiVersion: v1
kind: Service
metadata:
  name: webpod
  labels:
    app: webpod
spec:
  selector:
    app: webpod
  ports:
  - protocol: TCP
    port: 80
    targetPort: 80
  type: ClusterIP
EOF

# 2. 테스트 클라이언트 배포
cat <<EOF | kubectl apply -f -
apiVersion: v1
kind: Pod
metadata:
  name: curl-pod
  labels:
    app: curl
spec:
  nodeName: k8s-ctr
  containers:
  - name: curl
    image: nicolaka/netshoot
    command: ["tail"]
    args: ["-f", "/dev/null"]
    terminationGracePeriodSeconds: 0
EOF

# 3. 트래픽 생성 및 관찰
kubectl exec -it curl-pod -- sh -c 'while true; do curl -s webpod | grep Hostname; sleep 1; done'

# 4. Hubble을 통한 트래픽 관찰
hubble observe --from-pod curl-pod --to-service webpod

# 5. Prometheus에서 메트릭 확인
# - hubble_flows_total
# - hubble_http_requests_total
# - cilium_forward_count_total
과제 2: 네트워크 정책 적용 및 모니터링
# 1. 네트워크 정책 적용
apiVersion: "cilium.io/v2"
kind: CiliumNetworkPolicy
metadata:
  name: "webpod-policy"
spec:
  endpointSelector:
    matchLabels:
      app: webpod
  ingress:
  - fromEndpoints:
    - matchLabels:
        app: curl
    toPorts:
    - ports:
      - port: "80"
        protocol: TCP
      rules:
        http:
        - method: "GET"
          path: "/"
# 2. 정책 위반 테스트
kubectl run test-pod --image=nicolaka/netshoot --command -- tail -f /dev/null
kubectl exec -it test-pod -- curl webpod
# 3. 정책 적용 결과 관찰
hubble observe --verdict DENIED
hubble observe --type policy-verdict
# 4. 메트릭으로 정책 효과 확인
# - hubble_drop_total{reason="Policy denied"}
# - hubble_policy_verdict_total2. 도전 과제
도전과제 1: Hubble 로그 중앙 집중화
# Loki 스택 배포 (간소화 버전)
apiVersion: v1
kind: ConfigMap
metadata:
  name: loki-config
data:
  loki.yaml: |
    auth_enabled: false
    server:
      http_listen_port: 3100
    common:
      path_prefix: /loki
      storage:
        filesystem:
          chunks_directory: /loki/chunks
          rules_directory: /loki/rules
      replication_factor: 1
    schema_config:
      configs:
        - from: 2020-10-24
          store: boltdb-shipper
          object_store: filesystem
          schema: v11
          index:
            prefix: index_
            period: 24h
---
apiVersion: apps/v1
kind: Deployment
metadata:
  name: loki
spec:
  replicas: 1
  selector:
    matchLabels:
      app: loki
  template:
    metadata:
      labels:
        app: loki
    spec:
      containers:
      - name: loki
        image: grafana/loki:2.9.0
        args:
        - -config.file=/etc/loki/local-config.yaml
        ports:
        - containerPort: 3100
        volumeMounts:
        - name: config
          mountPath: /etc/loki
        - name: storage
          mountPath: /loki
      volumes:
      - name: config
        configMap:
          name: loki-config
      - name: storage
        emptyDir: {}
도전과제 2: TLS를 통한 Hubble 보안 설정
# 1. Hubble TLS 인증서 생성
cilium hubble generate-certs

# 2. TLS 활성화
helm upgrade cilium cilium/cilium \
  --namespace kube-system \
  --reuse-values \
  --set hubble.tls.enabled=true \
  --set hubble.tls.auto.enabled=true

# 3. TLS 인증서 확인
kubectl get secret -n kube-system hubble-server-certs
kubectl get secret -n kube-system hubble-relay-client-certs

# 4. 보안 접속 테스트
hubble --server tls://hubble-relay.kube-system.svc.cluster.local:443 status
도전과제 3: 프로메테우스 스택 구축
# 1. Prometheus Operator 설치
helm repo add prometheus-community https://prometheus-community.github.io/helm-charts
helm repo update

# 2. Prometheus Stack 배포
helm install prometheus-stack prometheus-community/kube-prometheus-stack \
  --namespace monitoring \
  --create-namespace \
  --set prometheus.prometheusSpec.serviceMonitorSelectorNilUsesHelmValues=false \
  --set prometheus.prometheusSpec.podMonitorSelectorNilUsesHelmValues=false

# 3. Cilium ServiceMonitor 생성
cat <<EOF | kubectl apply -f -
apiVersion: monitoring.coreos.com/v1
kind: ServiceMonitor
metadata:
  name: cilium-agent
  namespace: monitoring
spec:
  selector:
    matchLabels:
      k8s-app: cilium
  endpoints:
  - port: prometheus
    interval: 10s
    path: /metrics
EOF
📚 추가 학습 리소스 및 참고 자료
1. 공식 문서
Cilium & Hubble
Prometheus & Grafana
2. 커뮤니티 및 학습 자료
eCHO Episode 시리즈
Blog 및 튜토리얼
3. 실습 환경 확장
3.1 멀티 클러스터 Hubble 구성
# Cluster Mesh 활성화
cilium clustermesh enable --context cluster1
cilium clustermesh enable --context cluster2

# 클러스터 간 연결
cilium clustermesh connect --context cluster1 --destination-context cluster2

# 멀티 클러스터 가시성 확인
hubble observe --cluster cluster1 --cluster cluster2
3.2 고급 네트워크 정책 실습
# 시간 기반 정책
apiVersion: "cilium.io/v2"
kind: CiliumNetworkPolicy
metadata:
  name: "time-based-policy"
spec:
  endpointSelector:
    matchLabels:
      app: database
  ingress:
  - fromEndpoints:
    - matchLabels:
        app: backend
    toPorts:
    - ports:
      - port: "5432"
        protocol: TCP
      rules:
        http:
        - method: "GET"
          headers:
          - "X-Time-Window: business-hours"
3.3 Cilium Service Mesh 연동
# Istio와 Cilium 통합
helm install istio-base istio/base -n istio-system --create-namespace
helm install istiod istio/istiod -n istio-system --set pilot.env.EXTERNAL_ISTIOD=false

# Cilium Service Mesh 모드 활성화
cilium upgrade --config enable-envoy-config=true --config enable-l7-proxy=true
🚀 성능 최적화 및 트러블슈팅
1. Hubble 성능 최적화
1.1 메모리 및 CPU 최적화
# Hubble 리소스 제한 설정
helm upgrade cilium cilium/cilium \
  --namespace kube-system \
  --reuse-values \
  --set hubble.relay.resources.requests.cpu=100m \
  --set hubble.relay.resources.requests.memory=128Mi \
  --set hubble.relay.resources.limits.cpu=500m \
  --set hubble.relay.resources.limits.memory=512Mi

# 플로우 버퍼 크기 조정
--set hubble.observer.maxFlows=16384 \
--set hubble.relay.flowBufferSize=65536
1.2 네트워크 대역폭 최적화
# 메트릭 샘플링 조정
--set hubble.metrics.enableOpenMetrics=true \
--set hubble.metrics.enabled="{dns:query;ignoreAAAA,drop,tcp,flow,port-distribution,icmp,httpV2:exemplars=true;labelsContext=source_ip\,source_namespace\,source_workload\,destination_ip\,destination_namespace\,destination_workload}"

# Relay 압축 활성화
--set hubble.relay.gops.enabled=true
2. Prometheus 성능 최적화
2.1 스토리지 최적화
# Prometheus 스토리지 설정
prometheus:
  prometheusSpec:
    retention: 15d
    retentionSize: 50GiB
    resources:
      requests:
        memory: 2Gi
        cpu: 500m
      limits:
        memory: 4Gi
        cpu: 1000m
    storageSpec:
      volumeClaimTemplate:
        spec:
          storageClassName: fast-ssd
          resources:
            requests:
              storage: 100Gi
2.2 메트릭 수집 최적화
# 수집 간격 및 타임아웃 조정
global:
  scrape_interval: 30s
  scrape_timeout: 10s
  evaluation_interval: 30s

# 높은 카디널리티 메트릭 제외
metric_relabel_configs:
- source_labels: [__name__]
  regex: 'cilium_bpf_map_pressure.*'
  action: drop
3. 일반적인 문제 해결
3.1 Hubble 연결 문제
# Hubble API 연결 확인
cilium hubble port-forward &
hubble status --server localhost:4245

# Relay 로그 확인
kubectl logs -n kube-system deployment/hubble-relay -f

# 네트워크 정책 확인
kubectl get ciliumnetworkpolicies
cilium policy get
3.2 메트릭 수집 문제
# Prometheus 타겟 상태 확인
curl http://localhost:30001/api/v1/targets

# 메트릭 엔드포인트 직접 확인
kubectl exec -n kube-system ds/cilium -c cilium-agent -- curl localhost:9962/metrics

# 서비스 디스커버리 확인
kubectl get servicemonitor -A
kubectl get endpoints cilium-agent -n kube-system
3.3 성능 문제 진단
# 리소스 사용량 모니터링
kubectl top pods -n kube-system -l k8s-app=cilium
kubectl top pods -n cilium-monitoring

# Cilium Agent 상태 확인
cilium status --verbose
cilium-dbg debuginfo

# 네트워크 연결성 테스트
cilium connectivity test --hubble
📊 모니터링 베스트 프랙티스
1. 메트릭 기반 알림 전략
1.1 SLI 기반 알림 설정
# 가용성 SLI 알림
(
  sum(rate(hubble_http_requests_total{status!~"5.."}[5m])) /
  sum(rate(hubble_http_requests_total[5m]))
) < 0.99

# 지연시간 SLI 알림
histogram_quantile(0.95,
  rate(hubble_http_request_duration_seconds_bucket[5m])
) > 0.5

# 오류율 SLI 알림
(
  sum(rate(hubble_http_requests_total{status=~"5.."}[5m])) /
  sum(rate(hubble_http_requests_total[5m]))
) > 0.01
1.2 인프라 알림
# Cilium Agent 다운
up{job="cilium-agent"} == 0

# 엔드포인트 재생성 과다
rate(cilium_endpoint_regenerations_total[5m]) > 10

# 정책 드롭 급증
rate(hubble_drop_total{reason=~".*Policy.*"}[5m]) > 100

# DNS 해결 실패 증가
rate(hubble_dns_responses_total{rcode!="No Error"}[5m]) > 50
2. 대시보드 설계 원칙
2.1 계층별 대시보드
레벨 1: 클러스터 개요
- 전체 노드 상태
- 총 Pod/Service 수
- 네트워크 정책 개수
- 전체 트래픽 처리량
레벨 2: 네트워크 상세
- 노드별 트래픽 분산
- 서비스별 응답 시간
- 프로토콜별 분석
- 오류율 트렌드
레벨 3: 애플리케이션 심화
- 특정 서비스 성능
- L7 정책 효과
- 세부 오류 분석
- 용량 계획
2.2 시각화 가이드라인
# 효과적인 메트릭 조합
# 1. 볼륨 + 오류율 + 지연시간
sum(rate(hubble_http_requests_total[5m]))
sum(rate(hubble_http_requests_total{status=~"5.."}[5m])) / sum(rate(hubble_http_requests_total[5m]))
histogram_quantile(0.95, rate(hubble_http_request_duration_seconds_bucket[5m]))

# 2. 용량 사용률 + 포화도
cilium_bpf_maps_virtual_memory_max_bytes / cilium_bpf_maps_virtual_memory_bytes
rate(cilium_bpf_map_pressure_total[5m])

# 3. 가용성 + 성능
up{job="cilium-agent"}
rate(cilium_endpoint_regeneration_time_stats_seconds_sum[5m]) / rate(cilium_endpoint_regeneration_time_stats_seconds_count[5m])
🎯 2주차 학습 요약
1. 핵심 성취 목표
Observability 이해도
- ✅ 모니터링과 관측 가능성의 차이점 구분
- ✅ 메트릭, 로그, 트레이싱의 역할과 활용법 습득
- ✅ SLI/SLO/SLA 개념과 실무 적용 방안 이해
Hubble 활용 능력
- ✅ Hubble 아키텍처와 구성 요소 파악
- ✅ CLI를 통한 실시간 네트워크 관찰 실습
- ✅ UI를 통한 시각적 분석 및 서비스 맵 활용
- ✅ L7 프로토콜 가시성 확보
모니터링 스택 구축
- ✅ Prometheus와 Grafana 연동 설정
- ✅ PromQL 쿼리 작성 및 메트릭 분석
- ✅ 커스텀 대시보드 구성
- ✅ 알림 규칙 설정 및 운영
2. 실무 적용 가능한 기술
네트워크 트러블슈팅
- Hubble을 통한 실시간 패킷 플로우 분석
- 네트워크 정책 적용 결과 검증
- DNS 해결 문제 진단 및 해결
- L7 트래픽 패턴 분석
성능 모니터링
- 메트릭 기반 성능 임계값 설정
- 자동화된 알림 시스템 구축
- 용량 계획 및 리소스 최적화
- SLI/SLO 기반 서비스 신뢰성 측정
운영 자동화
- Prometheus 기반 메트릭 수집 파이프라인
- Grafana 대시보드를 통한 실시간 모니터링
- 로그 중앙 집중화 시스템 구축
- 장애 대응 프로세스 표준화
3. 다음 단계 학습 방향
고급 Cilium 기능
- Cluster Mesh를 통한 멀티 클러스터 네트워킹
- Service Mesh 기능과 Istio 연동
- WireGuard를 통한 투명 암호화
- BGP를 활용한 고급 라우팅
확장된 모니터링
- Jaeger/Zipkin을 통한 분산 트레이싱
- ELK Stack과의 로그 통합
- AlertManager를 통한 고급 알림
- Thanos를 통한 장기 메트릭 보관
보안 강화
- 네트워크 정책 고도화
- 보안 이벤트 모니터링
- 침입 탐지 시스템 연동
- 컴플라이언스 모니터링
4. 권장 실습 과제
- 프로덕션 레벨 모니터링 구축: 실제 워크로드를 대상으로 한 완전한 모니터링 스택 구축
- 장애 시나리오 대응: 인위적인 장애 상황 생성 후 Hubble과 메트릭을 통한 진단 및 해결
- 성능 최적화: 대용량 트래픽 환경에서의 Cilium 성능 튜닝 및 모니터링
- 자동화 스크립트 개발: 메트릭 기반 자동 스케일링 및 장애 복구 자동화
이로써 Cilium의 관측 가능성 기능과 Prometheus/Grafana를 활용한 종합적인 모니터링 솔루션에 대한 깊이 있는 이해를 완성하였습니다.