🔎 서울시 범죄 현황 분석
1. 강남 3구 범죄 현황 데이터 불러오기
import pandas as pd
import numpy as np
crime_raw_data=pd.read_csv(
"../data/02. crime_in_Seoul.csv",
thousands=',',
encoding='euc-kr'
)
crime_raw_data.head(3)
    구분	죄종	발생검거	건수
0	중부	살인	발생	2.0
1	중부	살인	검거	2.0
2	중부	강도	발생	3.0
crime_raw_data.info()
<class 'pandas.core.frame.DataFrame'>
RangeIndex: 65534 entries, 0 to 65533
Data columns (total 4 columns):
 #   Column  Non-Null Count  Dtype
---  ------  --------------  -----
 0   구분      310 non-null    object
 1   죄종      310 non-null    object
 2   발생검거    310 non-null    object
 3   건수      310 non-null    float64
dtypes: float64(1), object(3)
memory usage: 2.0+ MB
- 특정 컬럼에서 unique 조사
- nan 값 확인
non-null count와 RangeIndex: 65534 entries, 0 to 65533 비교 >>> nan값 확인
crime_raw_data['죄종'].unique()
array(['살인', '강도', '강간', '절도', '폭력', nan], dtype=object)
crime_raw_data[crime_raw_data['죄종'].isnull()]
| 구분 | 죄종 | 발생검거 | 건수 |
|---|
| 310 | NaN | NaN | NaN |
| 311 | NaN | NaN | NaN |
| 312 | NaN | NaN | NaN |
| 313 | NaN | NaN | NaN |
| 314 | NaN | NaN | NaN |
| ... | ... | ... | ... |
| 65529 | NaN | NaN | NaN |
| 65530 | NaN | NaN | NaN |
| 65531 | NaN | NaN | NaN |
| 65532 | NaN | NaN | NaN |
| 65533 | NaN | NaN | NaN |
65224 rows × 4 columns
null값 제거
crime_raw_data[crime_raw_data['죄종'].notnull()]
| 구분 | 죄종 | 발생검거 | 건수 |
|---|
| 0 | 중부 | 살인 | 발생 |
| 1 | 중부 | 살인 | 검거 |
| 2 | 중부 | 강도 | 발생 |
| 3 | 중부 | 강도 | 검거 |
| 4 | 중부 | 강간 | 발생 |
| ... | ... | ... | ... |
| 305 | 수서 | 강간 | 검거 |
| 306 | 수서 | 절도 | 발생 |
| 307 | 수서 | 절도 | 검거 |
| 308 | 수서 | 폭력 | 발생 |
| 309 | 수서 | 폭력 | 검거 |
310 rows × 4 columns
crime_raw_data=crime_raw_data[crime_raw_data['죄종'].notnull()]
crime_raw_data
번외
PandasPivot Table
- index, columns, value, aggfunc
df=pd.read_excel('../data/02. sales-funnel.xlsx')
df.head()
| Account | Name | Rep | Manager | Product | Quantity | Price | Status |
|---|
| 714466 | Trantow-Barrows | Craig Booker | Debra Henley | CPU | 1 | 30000 | presented |
| 714466 | Trantow-Barrows | Craig Booker | Debra Henley | Software | 1 | 10000 | presented |
| 714466 | Trantow-Barrows | Craig Booker | Debra Henley | Maintenance | 2 | 5000 | pending |
| 737550 | Fritsch, Russel and Anderson | Craig Booker | Debra Henley | CPU | 1 | 35000 | declined |
| 146832 | Kiehn-Spinka | Daniel Hilton | Debra Henley | CPU | 2 | 65000 | won |
index 설정
pd.pivot_table(df,index='Name')
| - | Account | Price | Quantity |
|---|
| Name | | | |
| Barton LLC | 740150 | 35000 | 1.000000 |
| Fritsch, Russel and Anderson | 737550 | 35000 | 1.000000 |
| Herman LLC | 141962 | 65000 | 2.000000 |
| Jerde-Hilpert | 412290 | 5000 | 2.000000 |
| Kassulke, Ondricka and Metz | 307599 | 7000 | 3.000000 |
| Keeling LLC | 688981 | 100000 | 5.000000 |
| Kiehn-Spinka | 146832 | 65000 | 2.000000 |
| Koepp Ltd | 729833 | 35000 | 2.000000 |
| Kulas Inc | 218895 | 25000 | 1.500000 |
| Purdy-Kunde | 163416 | 30000 | 1.000000 |
| Stokes LLC | 239344 | 7500 | 1.000000 |
| Trantow-Barrows | 714466 | 15000 | 1.333333 |
df.pivot_table(index=['Name','Rep','Manager'])
| | | Account | Price | Quantity |
|---|
| Name | Rep | Manager | | | |
| Barton LLC | John Smith | Debra Henley | 740150 | 35000 | 1.000000 |
| Fritsch, Russel and Anderson | Craig Booker | Debra Henley | 737550 | 35000 | 1.000000 |
| Herman LLC | Cedric Moss | Fred Anderson | 141962 | 65000 | 2.000000 |
| Jede-Hilpert | John Smith | Debra Henley | 412290 | 5000 | 2.000000 |
| Kassulke, Ondricka and Metz | Wendy Yule | Fred Anderson | 307599 | 7000 | 3.000000 |
| Keeling LLC | Wendy Yule | Fred Anderson | 688981 | 100000 | 5.000000 |
| Kiehn-Spinka | Daniel Hilton | Debra Henley | 146832 | 65000 | 2.000000 |
| Koepp Ltd | Wendy Yule | Fred Anderson | 729833 | 35000 | 2.000000 |
| Kulas Inc | Daniel Hilton | Debra Henley | 218895 | 25000 | 1.500000 |
| Purdy-Kunde | Cedric Moss | Fred Anderson | 163416 | 30000 | 1.000000 |
| Stokes LLC | Cedric Moss | Fred Anderson | 239344 | 7500 | 1.000000 |
| Trantow-Barrows | Craig Booker | Debra Henley | 714466 | 15000 | 1.333333 |
value 설정
df.pivot_table(index=['Manager','Rep'],values='Price')
| | Price |
|---|
| Manager | Rep | |
| Debra Henley | Craig Booker | 20000.000000 |
| Daniel Hilton | 38333.333333 |
| John Smith | 20000.000000 |
| Fred Anderson | Cedric Moss | 27500.000000 |
| Wendy Yule | 44250.000000 |
df.pivot_table(index=['Manager','Rep'],values='Price',aggfunc=np.sum)
| | Price |
|---|
| Manager | Rep | |
| Debra Henley | Craig Booker | 80000 |
| Daniel Hilton | 115000 |
| John Smith | 40000 |
| Fred Anderson | Cedric Moss | 110000 |
| Wendy Yule | 177000 |
columns 설정
df.pivot_table(index=['Manager','Rep'],values='Price', columns='Product',aggfunc=np.sum)
| - | Product | CPU | Maintenance | Monitor | Software |
|---|
| Manager | Rep | | | | |
| Debra Henley | Craig Booker | 65000.0 | 5000.0 | NaN | 10000.0 |
| - | Daniel Hilton | 105000.0 | NaN | NaN | 10000.0 |
| - | John Smith | 35000.0 | 5000.0 | NaN | NaN |
| Fred Anderson | Cedric Moss | 95000.0 | 5000.0 | NaN | 10000.0 |
| - | Wendy Yule | 165000.0 | 7000.0 | 5000.0 | NaN |
df.pivot_table(index=['Manager','Rep'],values='Price', columns='Product',aggfunc=np.sum,fill_value=0)
| - | Product | CPU | Maintenance | Monitor | Software |
|---|
| Manager | Rep | | | | |
| Debra Henley | Craig Booker | 65000.0 | 5000.0 | 0 | 10000.0 |
| - | Daniel Hilton | 105000.0 | 0 | 0 | 10000.0 |
| - | John Smith | 35000.0 | 5000.0 | 0 | 0 |
| Fred Anderson | Cedric Moss | 95000.0 | 5000.0 | 0 | 10000.0 |
| - | Wendy Yule | 165000.0 | 7000.0 | 5000.0 | 0 |
2. 서울시 범죄 현황 데이터 정리
crime_raw_data.head()
| - | 구분 | 죄종 | 발생검거 | 건수 |
|---|
| 0 | 중부 | 살인 | 발생 | 2.0 |
| 1 | 중부 | 살인 | 검거 | 2.0 |
| 2 | 중부 | 강도 | 발생 | 3.0 |
| 3 | 중부 | 강도 | 검거 | 3.0 |
| 4 | 중부 | 강간 | 발생 | 141.0 |
crime_station=crime_raw_data.pivot_table(index='구분',
                                        columns=['죄종','발생검거'],
                                        aggfunc=[np.sum]).copy()
crime_station.head()
| | | | | | | | | | sum |
|---|
| | | | | | | | | | 건수 |
| 죄종 | | 강간 | | 강도 | | 살인 | | 절도 | | 폭력 |
| 발생검거 | 검거 | 발생 | 검거 | 발생 | 검거 | 발생 | 검거 | 발생 | 검거 | 발생 |
| 구분 | | | | | | | | | | |
| 강남 | 269.0 | 339.0 | 26.0 | 24.0 | 3.0 | 3.0 | 1129.0 | 2438.0 | 2096.0 | 2336.0 |
| 강동 | 152.0 | 160.0 | 13.0 | 14.0 | 5.0 | 4.0 | 902.0 | 1754.0 | 2201.0 | 2530.0 |
| 강북 | 159.0 | 217.0 | 4.0 | 5.0 | 6.0 | 7.0 | 672.0 | 1222.0 | 2482.0 | 2778.0 |
| 강서 | 239.0 | 275.0 | 10.0 | 10.0 | 10.0 | 9.0 | 1070.0 | 1952.0 | 2768.0 | 3204.0 |
| 관악 | 264.0 | 322.0 | 10.0 | 12.0 | 7.0 | 6.0 | 937.0 | 2103.0 | 2707.0 | 3235.0 |
crime_station.columns=crime_station.columns.droplevel([0,1])
crime_station.head()
| 죄종 | | 강간 | | 강도 | | 살인 | | 절도 | | 폭력 |
|---|
| 발생검거 | 검거 | 발생 | 검거 | 발생 | 검거 | 발생 | 검거 | 발생 | 검거 | 발생 |
| 구분 | | | | | | | | | | |
| 강남 | 269.0 | 339.0 | 26.0 | 24.0 | 3.0 | 3.0 | 1129.0 | 2438.0 | 2096.0 | 2336.0 |
| 강동 | 152.0 | 160.0 | 13.0 | 14.0 | 5.0 | 4.0 | 902.0 | 1754.0 | 2201.0 | 2530.0 |
| 강북 | 159.0 | 217.0 | 4.0 | 5.0 | 6.0 | 7.0 | 672.0 | 1222.0 | 2482.0 | 2778.0 |
| 강서 | 239.0 | 275.0 | 10.0 | 10.0 | 10.0 | 9.0 | 1070.0 | 1952.0 | 2768.0 | 3204.0 |
| 관악 | 264.0 | 322.0 | 10.0 | 12.0 | 7.0 | 6.0 | 937.0 | 2103.0 | 2707.0 | 3235.0 |
crime_station.index
Index(['강남', '강동', '강북', '강서', '관악', '광진', '구로', '금천', '남대문', '노원', '도봉',
       '동대문', '동작', '마포', '방배', '서대문', '서부', '서초', '성동', '성북', '송파', '수서',
       '양천', '영등포', '용산', '은평', '종로', '종암', '중랑', '중부', '혜화'],
      dtype='object', name='구분')
- 현재 index는 경찰서 이름으로 되어 있다
- 경찰서 이름으로 구 이름을 알아내야한다.
3. python 모듈 설치
pip 명령
- python의 공식 모듈 관리자
- pip list
- pip install module_name
- pip uninstall module_name
conda 명령
- conda list
- conda install module_name
- conda uninstall module_name
- conda install -c channel_name module_name
- Window, mac(intel) 환경에서 가능
4. Google Map API 설치
- API KEY : google cloud를 통해 획득
window, mac(intel)
- conda install -c conda-forge googlemaps
mac1(M1)
import googlemaps
gmaps_key=
gmaps=googlemaps.Client(key=gmaps_key)
gmaps.geocode('서울영등포경찰서',language='ko')
[{'address_components': [{'long_name': '608',
    'short_name': '608',
    'types': ['premise']},
   {'long_name': '국회대로',
    'short_name': '국회대로',
    'types': ['political', 'sublocality', 'sublocality_level_4']},
   {'long_name': '영등포구',
    'short_name': '영등포구',
    'types': ['political', 'sublocality', 'sublocality_level_1']},
   {'long_name': '서울특별시',
    'short_name': '서울특별시',
    'types': ['administrative_area_level_1', 'political']},
   {'long_name': '대한민국',
    'short_name': 'KR',
    'types': ['country', 'political']},
   {'long_name': '150-043',
    'short_name': '150-043',
    'types': ['postal_code']}],
  'formatted_address': '대한민국 서울특별시 영등포구 국회대로 608',
  'geometry': {'location': {'lat': 37.5260441, 'lng': 126.9008091},
   'location_type': 'ROOFTOP',
   'viewport': {'northeast': {'lat': 37.5273930802915,
     'lng': 126.9021580802915},
    'southwest': {'lat': 37.5246951197085, 'lng': 126.8994601197085}}},
  'partial_match': True,
  'place_id': 'ChIJ1TimJLaffDURptXOs0Tj6sY',
  'plus_code': {'compound_code': 'GWG2+C8 대한민국 서울특별시',
   'global_code': '8Q98GWG2+C8'},
  'types': ['establishment', 'point_of_interest', 'police']}]
Pandas의 반복문 명령 iterrows()
- pandas 데이터 프레임은 대부분 2차원
for문을 사용하면, n번째라는 지정을 반복해서 가독률이 떨어짐
- itterows()옵션을 사용하면 편리하다
결과값을 인덱스와 내용으로 나누어 받는 것만 주의
5. 구글 맵을 이용한 데이터 정리
tmp=gmaps.geocode('서울영등포경찰서',language='ko')
len(tmp)
tmp[0]
{'address_components': [{'long_name': '608',
   'short_name': '608',
   'types': ['premise']},
  {'long_name': '국회대로',
   'short_name': '국회대로',
   'types': ['political', 'sublocality', 'sublocality_level_4']},
  {'long_name': '영등포구',
   'short_name': '영등포구',
   'types': ['political', 'sublocality', 'sublocality_level_1']},
  {'long_name': '서울특별시',
   'short_name': '서울특별시',
   'types': ['administrative_area_level_1', 'political']},
  {'long_name': '대한민국', 'short_name': 'KR', 'types': ['country', 'political']},
  {'long_name': '150-043', 'short_name': '150-043', 'types': ['postal_code']}],
 'formatted_address': '대한민국 서울특별시 영등포구 국회대로 608',
 'geometry': {'location': {'lat': 37.5260441, 'lng': 126.9008091},
  'location_type': 'ROOFTOP',
  'viewport': {'northeast': {'lat': 37.5273930802915,
    'lng': 126.9021580802915},
   'southwest': {'lat': 37.5246951197085, 'lng': 126.8994601197085}}},
 'partial_match': True,
 'place_id': 'ChIJ1TimJLaffDURptXOs0Tj6sY',
 'plus_code': {'compound_code': 'GWG2+C8 대한민국 서울특별시',
  'global_code': '8Q98GWG2+C8'},
 'types': ['establishment', 'point_of_interest', 'police']}
원하는 데이터 가져오기
- 'geometry': {'location': {'lat': 37.5260441, 'lng': 126.9008091}
- 'formatted_address': '대한민국 서울특별시 영등포구 국회대로 608'
tmp[0].get('geometry')['location']
{'lat': 37.5260441, 'lng': 126.9008091}
lat=tmp[0].get('geometry')['location']['lat']
lng=tmp[0].get('geometry')['location']['lng']
tmp[0]['formatted_address'].split()[2]
'영등포구'
구별, lat, lng 컬럼 추가
crime_station['구별']=np.nan
crime_station['lat']=np.nan
crime_station['lng']=np.nan
crime_station.head()
| 죄종 | | 강간 | | 강도 | | 살인 | | 절도 | | 폭력 | 구별 | lat | lng |
|---|
| 발생검거 | 검거 | 발생 | 검거 | 발생 | 검거 | 발생 | 검거 | 발생 | 검거 | 발생 | | | |
| 구분 | | | | | | | | | | | | | |
| 강남 | 269.0 | 339.0 | 26.0 | 24.0 | 3.0 | 3.0 | 1129.0 | 2438.0 | 2096.0 | 2336.0 | NaN | NaN | NaN |
| 강동 | 152.0 | 160.0 | 13.0 | 14.0 | 5.0 | 4.0 | 902.0 | 1754.0 | 2201.0 | 2530.0 | NaN | NaN | NaN |
| 강북 | 159.0 | 217.0 | 4.0 | 5.0 | 6.0 | 7.0 | 672.0 | 1222.0 | 2482.0 | 2778.0 | NaN | NaN | NaN |
| 강서 | 239.0 | 275.0 | 10.0 | 10.0 | 10.0 | 9.0 | 1070.0 | 1952.0 | 2768.0 | 3204.0 | NaN | NaN | NaN |
| 관악 | 264.0 | 322.0 | 10.0 | 12.0 | 7.0 | 6.0 | 937.0 | 2103.0 | 2707.0 | 3235.0 | NaN | NaN | NaN |
- 경찰서 이름에서 소속된 구이름 얻기
- 구이름과 위도, 경도 정보를 저장할 준비
- 반복문을 이용해서 위 표의 NaN값을 채워준다
for idx, rows in crime_station.iterrows():
    station_name='서울'+str(idx)+'경찰서'
    tmp=gmaps.geocode(station_name,language='ko')
    lat=tmp[0]['geometry']['location']['lat']
    lng=tmp[0]['geometry']['location']['lng']
    address=tmp[0]['formatted_address'].split()[2]
    crime_station.loc[idx,'구별']=address
    crime_station.loc[idx,'lat']=lat
    crime_station.loc[idx,'lng']=lng


crime_station.head()
| 죄종 | 강간 | 강도 | 살인 | 절도 | 폭력 | 구별 | lat | lng | |
|---|
| 발생검거 | 검거 | 발생 | 검거 | 발생 | 검거 | 발생 | 검거 | 발생 | 검거 |
| 구분 | | | | | | | | | |
| 강남 | 269.0 | 339.0 | 26.0 | 24.0 | 3.0 | 3.0 | 1129.0 | 2438.0 | 2096.0 |
| 강동 | 152.0 | 160.0 | 13.0 | 14.0 | 5.0 | 4.0 | 902.0 | 1754.0 | 2201.0 |
| 강북 | 159.0 | 217.0 | 4.0 | 5.0 | 6.0 | 7.0 | 672.0 | 1222.0 | 2482.0 |
| 강서 | 239.0 | 275.0 | 10.0 | 10.0 | 10.0 | 9.0 | 1070.0 | 1952.0 | 2768.0 |
| 관악 | 264.0 | 322.0 | 10.0 | 12.0 | 7.0 | 6.0 | 937.0 | 2103.0 | 2707.0 |
컬럼 보기쉽게 정리
tmp=[
crime_station.columns.get_level_values(0)[n]+crime_station.columns.get_level_values(1)[n]
for n in range(0,len(crime_station.columns.get_level_values(0)))
]
tmp
['강간검거',
 '강간발생',
 '강도검거',
 '강도발생',
 '살인검거',
 '살인발생',
 '절도검거',
 '절도발생',
 '폭력검거',
 '폭력발생',
 '구별',
 'lat',
 'lng']
crime_station.columns=tmp
crime_station.head()
| - | 강간검거 | 강간발생 | 강도검거 | 강도발생 | 살인검거 | 살인발생 | 절도검거 | 절도발생 | 폭력검거 | 폭력발생 | 구별 | lat | lng |
|---|
| 구분 | | | | | | | | | | | | | |
| 강남 | 269.0 | 339.0 | 26.0 | 24.0 | 3.0 | 3.0 | 1129.0 | 2438.0 | 2096.0 | 2336.0 | 강남구 | 37.509435 | 127.066958 |
| 강동 | 152.0 | 160.0 | 13.0 | 14.0 | 5.0 | 4.0 | 902.0 | 1754.0 | 2201.0 | 2530.0 | 강동구 | 37.528511 | 127.126822 |
| 강북 | 159.0 | 217.0 | 4.0 | 5.0 | 6.0 | 7.0 | 672.0 | 1222.0 | 2482.0 | 2778.0 | 강북구 | 37.637197 | 127.027305 |
| 강서 | 239.0 | 275.0 | 10.0 | 10.0 | 10.0 | 9.0 | 1070.0 | 1952.0 | 2768.0 | 3204.0 | 양천구 | 37.539783 | 126.829997 |
| 관악 | 264.0 | 322.0 | 10.0 | 12.0 | 7.0 | 6.0 | 937.0 | 2103.0 | 2707.0 | 3235.0 | 관악구 | 37.474395 | 126.951349 |
crime_station.to_csv('../data/02_crime_in_Seoul_raw.csv',sep=',',encoding='utf-8')
6. 구별 데이터 정리
crime_anal_station=pd.read_csv('../data/02_crime_in_Seoul_raw.csv',index_col=0,encoding='utf-8')
crime_anal_station.head()
| - | 강간검거 | 강간발생 | 강도검거 | 강도발생 | 살인검거 | 살인발생 | 절도검거 | 절도발생 | 폭력검거 | 폭력발생 | 구별 | lat | lng |
|---|
| 구분 | | | | | | | | | | | | | |
| 강남 | 269.0 | 339.0 | 26.0 | 24.0 | 3.0 | 3.0 | 1129.0 | 2438.0 | 2096.0 | 2336.0 | 강남구 | 37.509435 | 127.066958 |
| 강동 | 152.0 | 160.0 | 13.0 | 14.0 | 5.0 | 4.0 | 902.0 | 1754.0 | 2201.0 | 2530.0 | 강동구 | 37.528511 | 127.126822 |
| 강북 | 159.0 | 217.0 | 4.0 | 5.0 | 6.0 | 7.0 | 672.0 | 1222.0 | 2482.0 | 2778.0 | 강북구 | 37.637197 | 127.027305 |
| 강서 | 239.0 | 275.0 | 10.0 | 10.0 | 10.0 | 9.0 | 1070.0 | 1952.0 | 2768.0 | 3204.0 | 양천구 | 37.539783 | 126.829997 |
| 관악 | 264.0 | 322.0 | 10.0 | 12.0 | 7.0 | 6.0 | 937.0 | 2103.0 | 2707.0 | 3235.0 | 관악구 | 37.474395 | 126.951349 |
crime_anal_gu=crime_anal_station.pivot_table(index='구별',aggfunc=np.sum)
crime_anal_gu.head()
| - | lat | lng | 강간검거 | 강간발생 | 강도검거 | 강도발생 | 살인검거 | 살인발생 | 절도검거 | 절도발생 | 폭력검거 | 폭력발생 |
|---|
| 구별 | | | | | | | | | | | | |
| 강남구 | 75.002925 | 254.144170 | 413.0 | 516.0 | 42.0 | 39.0 | 5.0 | 5.0 | 1918.0 | 3587.0 | 3527.0 | 4002.0 |
| 강동구 | 37.528511 | 127.126822 | 152.0 | 160.0 | 13.0 | 14.0 | 5.0 | 4.0 | 902.0 | 1754.0 | 2201.0 | 2530.0 |
| 강북구 | 37.637197 | 127.027305 | 159.0 | 217.0 | 4.0 | 5.0 | 6.0 | 7.0 | 672.0 | 1222.0 | 2482.0 | 2778.0 |
| 관악구 | 37.474395 | 126.951349 | 264.0 | 322.0 | 10.0 | 12.0 | 7.0 | 6.0 | 937.0 | 2103.0 | 2707.0 | 3235.0 |
| 광진구 | 37.542823 | 127.083839 | 234.0 | 279.0 | 6.0 | 11.0 | 4.0 | 4.0 | 1057.0 | 2636.0 | 2011.0 | 2392.0 |
crime_anal_gu['강도검거']/crime_anal_gu['강도발생']
구별
강남구     1.076923
강동구     0.928571
강북구     0.800000
관악구     0.833333
광진구     0.545455
구로구     1.300000
금천구     1.000000
노원구     1.500000
도봉구     1.000000
동대문구    1.200000
동작구     1.000000
마포구     1.750000
서대문구    0.800000
서초구     0.769231
성동구     1.666667
성북구     1.000000
송파구     0.800000
양천구     1.000000
영등포구    0.736842
용산구     1.111111
은평구     0.777778
종로구     0.750000
중구      0.875000
중랑구     1.000000
dtype: float64
target=['강간검거율','강도검거율','살인검거율','절도검거율','폭력검거율']
num=['강간검거','강도검거','살인검거','절도검거','폭력검거']
den=['강간발생','강도발생','살인발생','절도발생','폭력발생']

crime_anal_gu[target]=crime_anal_gu[num].div(crime_anal_gu[den].values)*100
crime_anal_gu.head()
| - | 강간검거 | 강간발생 | 강도검거 | 강도발생 | 살인검거 | 살인발생 | 절도검거 | 절도발생 | 폭력검거 | 폭력발생 | 강간검거율 | 강도검거율 | 살인검거율 | 절도검거율 | 폭력검거율 |
|---|
| 구별 | | | | | | | | | | | | | | | |
| 강남구 | 413.0 | 516.0 | 42.0 | 39.0 | 5.0 | 5.0 | 1918.0 | 3587.0 | 3527.0 | 4002.0 | 80.038760 | 107.692308 | 100.000000 | 53.470867 | 88.130935 |
| 강동구 | 152.0 | 160.0 | 13.0 | 14.0 | 5.0 | 4.0 | 902.0 | 1754.0 | 2201.0 | 2530.0 | 95.000000 | 92.857143 | 125.000000 | 51.425314 | 86.996047 |
| 강북구 | 159.0 | 217.0 | 4.0 | 5.0 | 6.0 | 7.0 | 672.0 | 1222.0 | 2482.0 | 2778.0 | 73.271889 | 80.000000 | 85.714286 | 54.991817 | 89.344852 |
| 관악구 | 264.0 | 322.0 | 10.0 | 12.0 | 7.0 | 6.0 | 937.0 | 2103.0 | 2707.0 | 3235.0 | 81.987578 | 83.333333 | 116.666667 | 44.555397 | 83.678516 |
| 광진구 | 234.0 | 279.0 | 6.0 | 11.0 | 4.0 | 4.0 | 1057.0 | 2636.0 | 2011.0 | 2392.0 | 83.870968 | 54.545455 | 100.000000 | 40.098634 | 84.071906 |
crime_anal_gu.drop(num,axis=1,inplace=True)
crime_anal_gu.head()
| - | 강간발생 | 강도발생 | 살인발생 | 절도발생 | 폭력발생 | 강간검거율 | 강도검거율 | 살인검거율 | 절도검거율 | 폭력검거율 |
|---|
| 구별 | | | | | | | | | | |
| 강남구 | 516.0 | 39.0 | 5.0 | 3587.0 | 4002.0 | 80.038760 | 107.692308 | 100.000000 | 53.470867 | 88.130935 |
| 강동구 | 160.0 | 14.0 | 4.0 | 1754.0 | 2530.0 | 95.000000 | 92.857143 | 125.000000 | 51.425314 | 86.996047 |
| 강북구 | 217.0 | 5.0 | 7.0 | 1222.0 | 2778.0 | 73.271889 | 80.000000 | 85.714286 | 54.991817 | 89.344852 |
| 관악구 | 322.0 | 12.0 | 6.0 | 2103.0 | 3235.0 | 81.987578 | 83.333333 | 116.666667 | 44.555397 | 83.678516 |
| 광진구 | 279.0 | 11.0 | 4.0 | 2636.0 | 2392.0 | 83.870968 | 54.545455 | 100.000000 | 40.098634 | 84.071906 |
crime_anal_gu.rename(columns={'강간발생':'강간',
'강도발생':'강도',
'살인발생':'살인',
'폭력발생':'폭력',
'절도발생':'절도'},inplace=True)
crime_anal_gu.head()
| - | 강간 | 강도 | 살인 | 절도 | 폭력 | 강간검거율 | 강도검거율 | 살인검거율 | 절도검거율 | 폭력검거율 |
|---|
| 구별 | | | | | | | | | | |
| 강남구 | 516.0 | 39.0 | 5.0 | 3587.0 | 4002.0 | 80.038760 | 107.692308 | 100.000000 | 53.470867 | 88.130935 |
| 강동구 | 160.0 | 14.0 | 4.0 | 1754.0 | 2530.0 | 95.000000 | 92.857143 | 125.000000 | 51.425314 | 86.996047 |
| 강북구 | 217.0 | 5.0 | 7.0 | 1222.0 | 2778.0 | 73.271889 | 80.000000 | 85.714286 | 54.991817 | 89.344852 |
| 관악구 | 322.0 | 12.0 | 6.0 | 2103.0 | 3235.0 | 81.987578 | 83.333333 | 116.666667 | 44.555397 | 83.678516 |
| 광진구 | 279.0 | 11.0 | 4.0 | 2636.0 | 2392.0 | 83.870968 | 54.545455 | 100.000000 | 40.098634 | 84.071906 |
7. 범죄 데이터 정렬을 위한 데이터 정리
데이터 정규화
crime_anal_gu['강도']/crime_anal_gu['강도'].max()
구별
강남구     1.000000
강동구     0.358974
강북구     0.128205
관악구     0.307692
광진구     0.282051
구로구     0.256410
금천구     0.179487
노원구     0.153846
도봉구     0.128205
동대문구    0.256410
동작구     0.179487
마포구     0.102564
서대문구    0.128205
서초구     0.333333
성동구     0.076923
성북구     0.205128
송파구     0.384615
양천구     0.435897
영등포구    0.487179
용산구     0.230769
은평구     0.230769
종로구     0.307692
중구      0.205128
중랑구     0.358974
Name: 강도, dtype: float64
col=['강도','살인','강간','절도','폭력']
crime_anal_norm=crime_anal_gu[col]/crime_anal_gu[col].max()
crime_anal_norm.head()
| 강도 | 살인 | 강간 | 절도 | 폭력 |
|---|
| 구별 | | | | | |
| 강남구 | 1.000000 | 0.357143 | 1.000000 | 0.977118 | 0.733773 |
| 강동구 | 0.358974 | 0.285714 | 0.310078 | 0.477799 | 0.463880 |
| 강북구 | 0.128205 | 0.500000 | 0.420543 | 0.332879 | 0.509351 |
| 관악구 | 0.307692 | 0.428571 | 0.624031 | 0.572868 | 0.593143 |
| 광진구 | 0.282051 | 0.285714 | 0.540698 | 0.718060 | 0.438577 |
col2=['강간검거율','강도검거율','살인검거율','절도검거율','폭력검거율']
crime_anal_norm[col2]=crime_anal_gu[col2]
crime_anal_norm.head()
| - | 강도 | 살인 | 강간 | 절도 | 폭력 | 강간검거율 | 강도검거율 | 살인검거율 | 절도검거율 | 폭력검거율 |
|---|
| 구별 | | | | | | | | | | |
| 강남구 | 1.000000 | 0.357143 | 1.000000 | 0.977118 | 0.733773 | 80.038760 | 100.000000 | 100.000000 | 53.470867 | 88.130935 |
| 강동구 | 0.358974 | 0.285714 | 0.310078 | 0.477799 | 0.463880 | 95.000000 | 92.857143 | 100.000000 | 51.425314 | 86.996047 |
| 강북구 | 0.128205 | 0.500000 | 0.420543 | 0.332879 | 0.509351 | 73.271889 | 80.000000 | 85.714286 | 54.991817 | 89.344852 |
| 관악구 | 0.307692 | 0.428571 | 0.624031 | 0.572868 | 0.593143 | 81.987578 | 83.333333 | 100.000000 | 44.555397 | 83.678516 |
| 광진구 | 0.282051 | 0.285714 | 0.540698 | 0.718060 | 0.438577 | 83.870968 | 54.545455 | 100.000000 | 40.098634 | 84.071906 |
result_cctv=pd.read_csv('../data/01_Seoul_CCTV_Data.csv',index_col='자치구', encoding='utf-8')
crime_anal_norm[['인구수','CCTV']]=result_cctv[['인구수','소계']]
crime_anal_norm.head()
| - | 강도 | 살인 | 강간 | 절도 | 폭력 | 강간검거율 | 강도검거율 | 살인검거율 | 절도검거율 | 폭력검거율 | 인구수 | CCTV |
|---|
| 구별 | | | | | | | | | | | | |
| 강남구 | 1.000000 | 0.357143 | 1.000000 | 0.977118 | 0.733773 | 80.038760 | 100.000000 | 100.000000 | 53.470867 | 88.130935 | 534988 | 3238 |
| 강동구 | 0.358974 | 0.285714 | 0.310078 | 0.477799 | 0.463880 | 95.000000 | 92.857143 | 100.000000 | 51.425314 | 86.996047 | 464490 | 1010 |
| 강북구 | 0.128205 | 0.500000 | 0.420543 | 0.332879 | 0.509351 | 73.271889 | 80.000000 | 85.714286 | 54.991817 | 89.344852 | 298622 | 831 |
| 관악구 | 0.307692 | 0.428571 | 0.624031 | 0.572868 | 0.593143 | 81.987578 | 83.333333 | 100.000000 | 44.555397 | 83.678516 | 500750 | 2109 |
| 광진구 | 0.282051 | 0.285714 | 0.540698 | 0.718060 | 0.438577 | 83.870968 | 54.545455 | 100.000000 | 40.098634 | 84.071906 | 351073 | 878 |
col=['강도','살인','강간','절도','폭력']
crime_anal_norm['범죄']=np.mean(crime_anal_norm[col],axis=1)
crime_anal_norm.head()
import numpy as np
col=['강간검거율','강도검거율','살인검거율','절도검거율','폭력검거율']
crime_anal_norm['검거']=np.mean(crime_anal_norm[col],axis=1)
crime_anal_norm.head()
| - | 강도 | 살인 | 강간 | 절도 | 폭력 | 강간검거율 | 강도검거율 | 살인검거율 | 절도검거율 | 폭력검거율 | 인구수 | CCTV | 범죄 | 검거 |
|---|
| 구별 | | | | | | | | | | | | | | |
| 강남구 | 1.000000 | 0.357143 | 1.000000 | 0.977118 | 0.733773 | 80.038760 | 100.000000 | 100.000000 | 53.470867 | 88.130935 | 534988 | 3238 | 0.813607 | 84.328112 |
| 강동구 | 0.358974 | 0.285714 | 0.310078 | 0.477799 | 0.463880 | 95.000000 | 92.857143 | 100.000000 | 51.425314 | 86.996047 | 464490 | 1010 | 0.379289 | 85.255701 |
| 강북구 | 0.128205 | 0.500000 | 0.420543 | 0.332879 | 0.509351 | 73.271889 | 80.000000 | 85.714286 | 54.991817 | 89.344852 | 298622 | 831 | 0.378196 | 76.664569 |
| 관악구 | 0.307692 | 0.428571 | 0.624031 | 0.572868 | 0.593143 | 81.987578 | 83.333333 | 100.000000 | 44.555397 | 83.678516 | 500750 | 2109 | 0.505261 | 78.710965 |
| 광진구 | 0.282051 | 0.285714 | 0.540698 | 0.718060 | 0.438577 | 83.870968 | 54.545455 | 100.000000 | 40.098634 | 84.071906 | 351073 | 878 | 0.453020 | 72.517393 |
Seaborn
예제1 : seaborn 기초
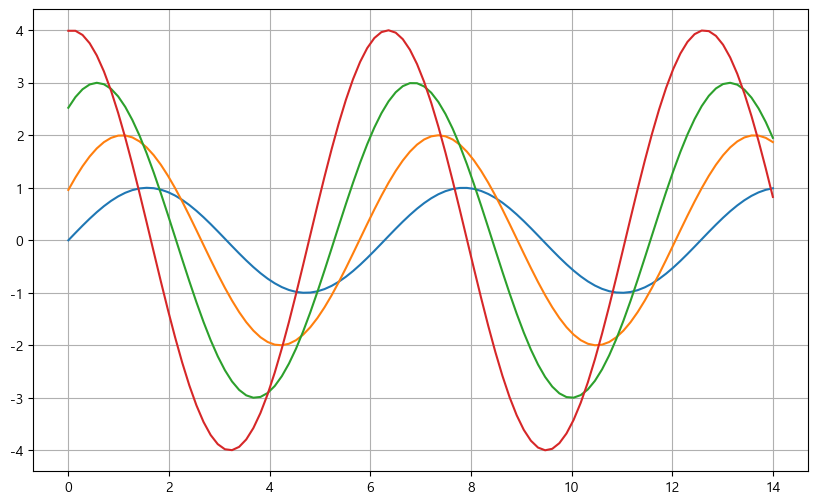
x=np.linspace(0,14,100)
y1=np.sin(x)
y2=2*np.sin(x+0.5)
y3=3*np.sin(x+1)
y4=4*np.sin(x+1.5)
plt.figure(figsize=(10,6))
plt.plot(x,y1,x,y2,x,y3,x,y4)
plt.grid()
plt.show()
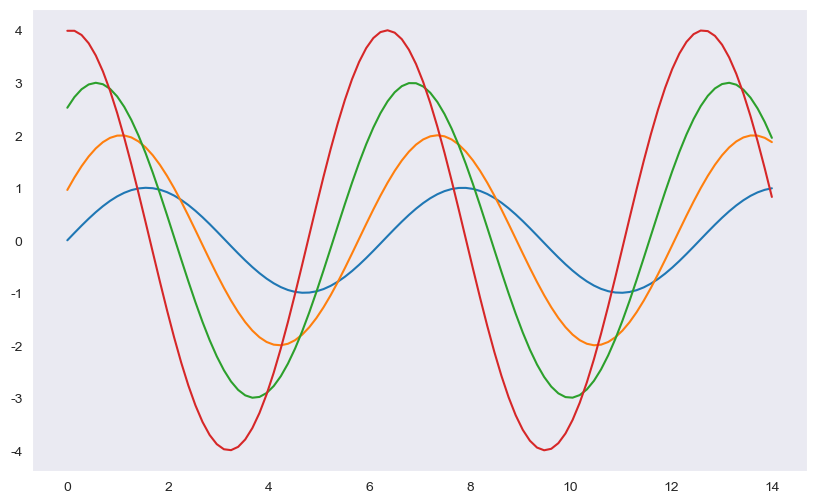
sns.set_style('dark')
plt.figure(figsize=(10,6))
plt.plot(x,y1,x,y2,x,y3,x,y4)
plt.show()
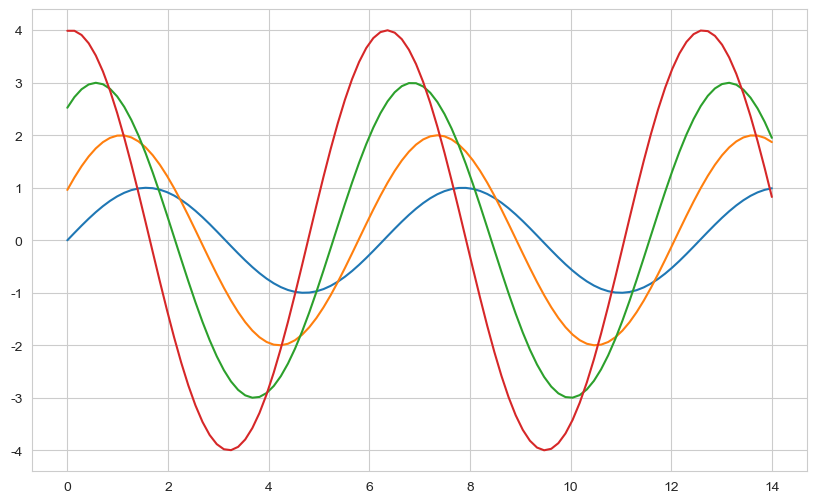
sns.set_style('whitegrid')
plt.figure(figsize=(10,6))
plt.plot(x,y1
예제2: seaborn tips data
tips=sns.load_dataset('tips')
tips
| - | total_bill | tip | sex | smoker | day | time | size |
|---|
| 0 | 16.99 | 1.01 | Female | No | Sun | Dinner | 2 |
| 1 | 10.34 | 1.66 | Male | No | Sun | Dinner | 3 |
| 2 | 21.01 | 3.50 | Male | No | Sun | Dinner | 3 |
| 3 | 23.68 | 3.31 | Male | No | Sun | Dinner | 2 |
| 4 | 24.59 | 3.61 | Female | No | Sun | Dinner | 4 |
| ... | ... | ... | ... | ... | ... | ... | ... |
| 239 | 29.03 | 5.92 | Male | No | Sat | Dinner | 3 |
| 240 | 27.18 | 2.00 | Female | Yes | Sat | Dinner | 2 |
| 241 | 22.67 | 2.00 | Male | Yes | Sat | Dinner | 2 |
| 242 | 17.82 | 1.75 | Male | No | Sat | Dinner | 2 |
| 243 | 18.78 | 3.00 | Female | No | Thur | Dinner | 2 |
244 rows × 7 columns
tips.info()
<class 'pandas.core.frame.DataFrame'>
RangeIndex: 244 entries, 0 to 243
Data columns (total 7 columns):
 #   Column      Non-Null Count  Dtype
---  ------      --------------  -----
 0   total_bill  244 non-null    float64
 1   tip         244 non-null    float64
 2   sex         244 non-null    category
 3   smoker      244 non-null    category
 4   day         244 non-null    category
 5   time        244 non-null    category
 6   size        244 non-null    int64
dtypes: category(4), float64(2), int64(1)
memory usage: 7.4 KB
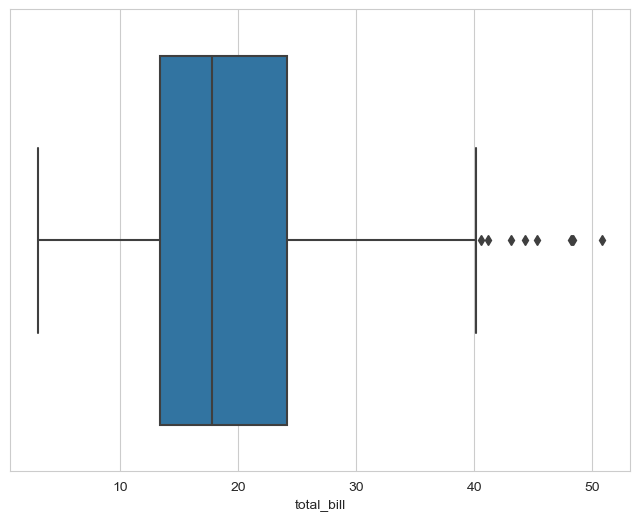
plt.figure(figsize=(8,6))
sns.boxplot(x=tips['total_bill'])
plt.show

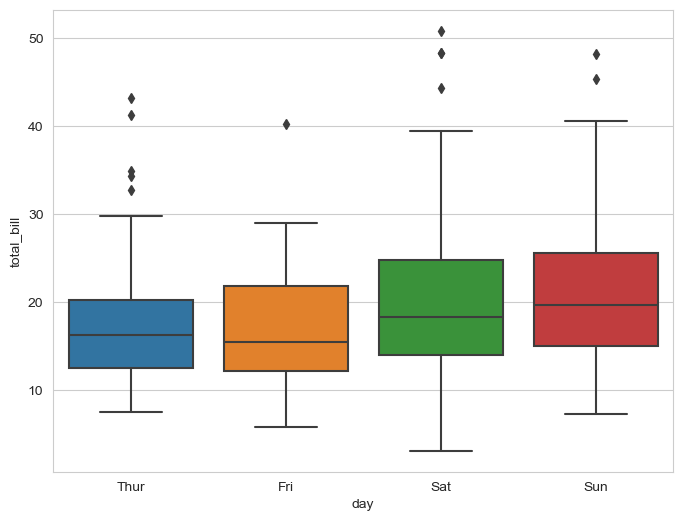
plt.figure(figsize=(8,6))
sns.boxplot(x='day',y='total_bill',data=tips)
plt.show()
plt.figure(figsize=(8,6))
sns.boxplot(x='day',y='total_bill',data=tips,hue='smoker', palette='Set3')
plt.show()

plt.figure(figsize=(8,6))
sns.swarmplot(x='day',y='total_bill',data=tips, color="0.5")
plt.show()

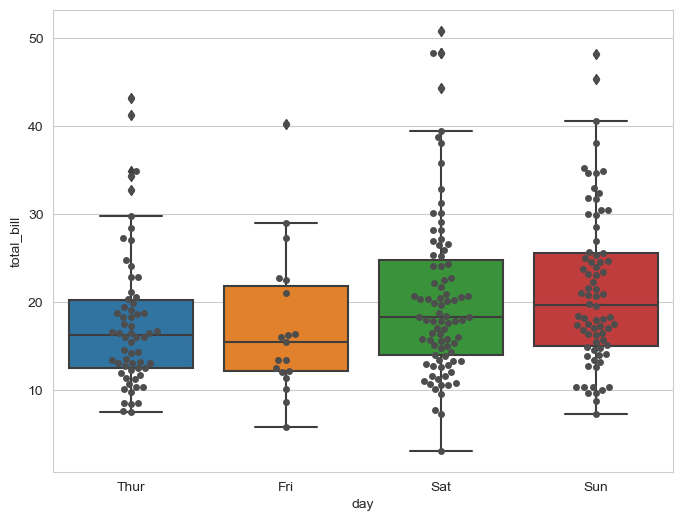
plt.figure(figsize=(8,6))
sns.boxplot(x='day',y='total_bill',data=tips)
sns.swarmplot(x='day',y='total_bill',data=tips, color='0.3')
plt.show()
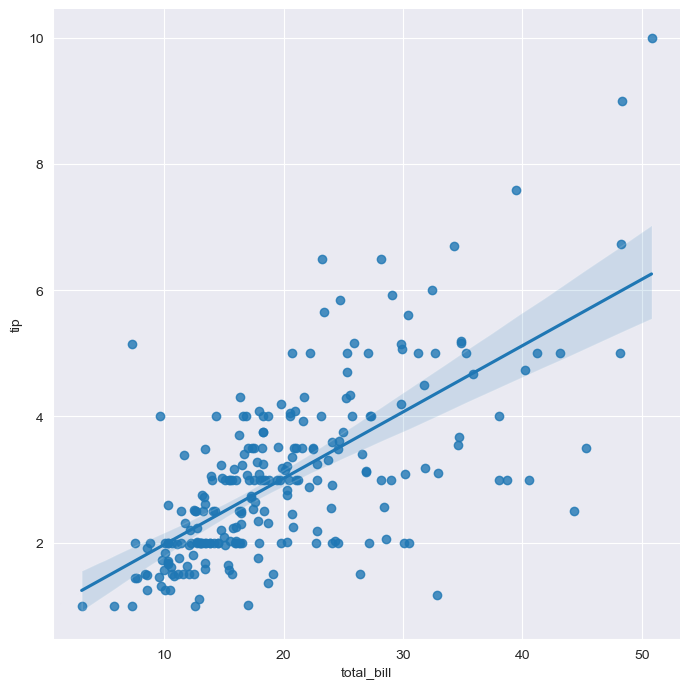
sns.set_style('darkgrid')
sns.lmplot(x='total_bill',y='tip',data=tips, height=7)
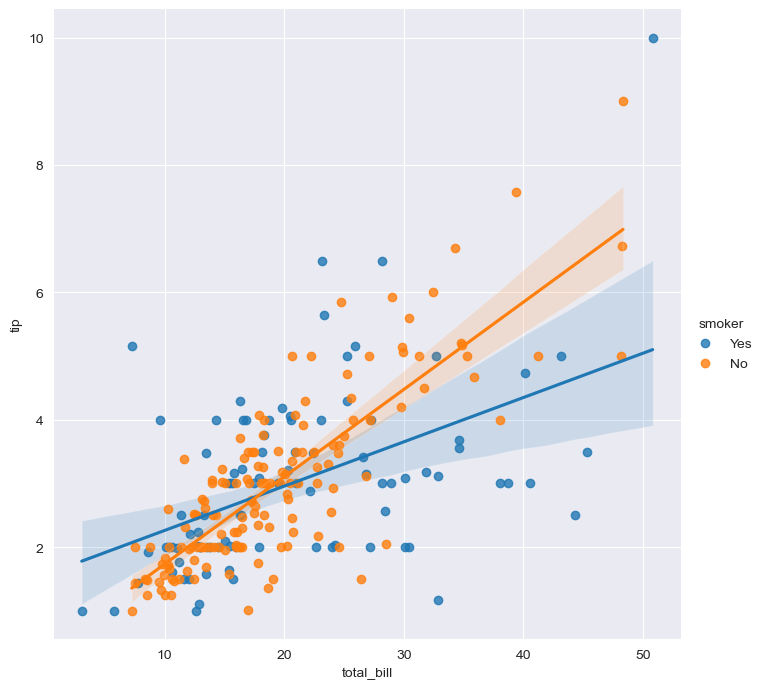
sns.set_style('darkgrid')
sns.lmplot(x='total_bill',y='tip',data=tips,height=7,hue='smoker')
예제3: flights data
flights=sns.load_dataset('flights')
flights.head()
| - | year | month | passengers |
|---|
| 0 | 1949 | Jan | 112 |
| 1 | 1949 | Feb | 118 |
| 2 | 1949 | Mar | 132 |
| 3 | 1949 | Apr | 129 |
| 4 | 1949 | May | 121 |
flights.info()
<class 'pandas.core.frame.DataFrame'>
RangeIndex: 144 entries, 0 to 143
Data columns (total 3 columns):
 #   Column      Non-Null Count  Dtype
---  ------      --------------  -----
 0   year        144 non-null    int64
 1   month       144 non-null    category
 2   passengers  144 non-null    int64
dtypes: category(1), int64(2)
memory usage: 2.9 KB
flights=flights.pivot(index='month',columns='year',values='passengers')
flights
| year | 1949 | 1950 | 1951 | 1952 | 1953 | 1954 | 1955 | 1956 | 1957 | 1958 | 1959 | 1960 |
|---|
| month | | | | | | | | | | | | |
| Jan | 112 | 115 | 145 | 171 | 196 | 204 | 242 | 284 | 315 | 340 | 360 | 417 |
| Feb | 118 | 126 | 150 | 180 | 196 | 188 | 233 | 277 | 301 | 318 | 342 | 391 |
| Mar | 132 | 141 | 178 | 193 | 236 | 235 | 267 | 317 | 356 | 362 | 406 | 419 |
| Apr | 129 | 135 | 163 | 181 | 235 | 227 | 269 | 313 | 348 | 348 | 396 | 461 |
| May | 121 | 125 | 172 | 183 | 229 | 234 | 270 | 318 | 355 | 363 | 420 | 472 |
| Jun | 135 | 149 | 178 | 218 | 243 | 264 | 315 | 374 | 422 | 435 | 472 | 535 |
| Jul | 148 | 170 | 199 | 230 | 264 | 302 | 364 | 413 | 465 | 491 | 548 | 622 |
| Aug | 148 | 170 | 199 | 242 | 272 | 293 | 347 | 405 | 467 | 505 | 559 | 606 |
| Sep | 136 | 158 | 184 | 209 | 237 | 259 | 312 | 355 | 404 | 404 | 463 | 508 |
| Oct | 119 | 133 | 162 | 191 | 211 | 229 | 274 | 306 | 347 | 359 | 407 | 461 |
| Nov | 104 | 114 | 146 | 172 | 180 | 203 | 237 | 271 | 305 | 310 | 362 | 390 |
| Dec | 118 | 140 | 166 | 194 | 201 | 229 | 278 | 306 | 336 | 337 | 405 | 432 |
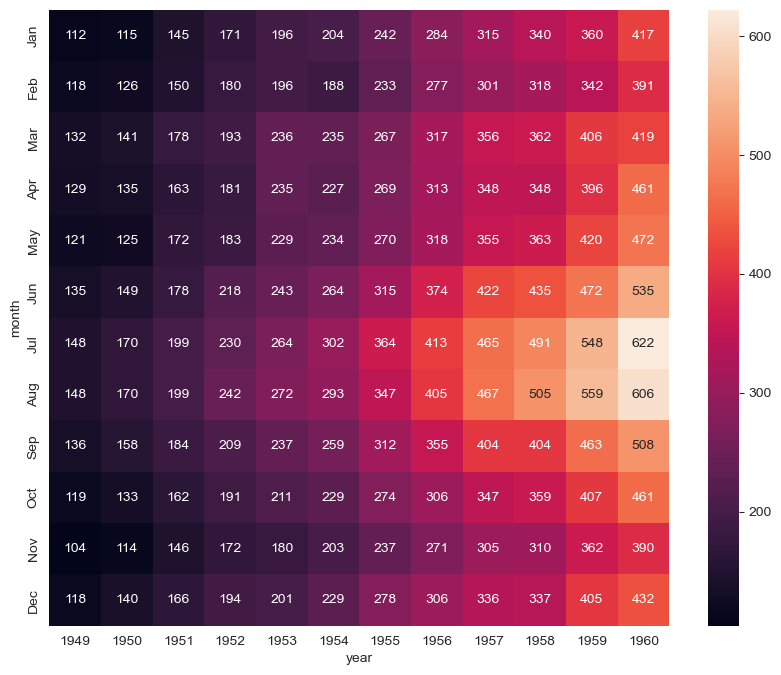
plt.figure(figsize=(10,8))
sns.heatmap(data=flights,annot=True, fmt='d')
plt.show()
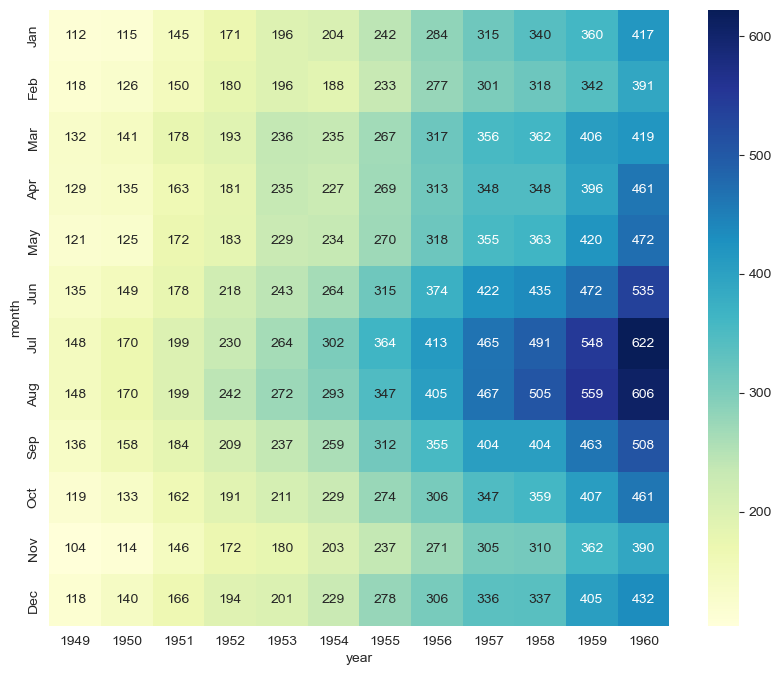
plt.figure(figsize=(10,8))
sns.heatmap(data=flights,annot=True, fmt='d', cmap='YlGnBu')
plt.show()
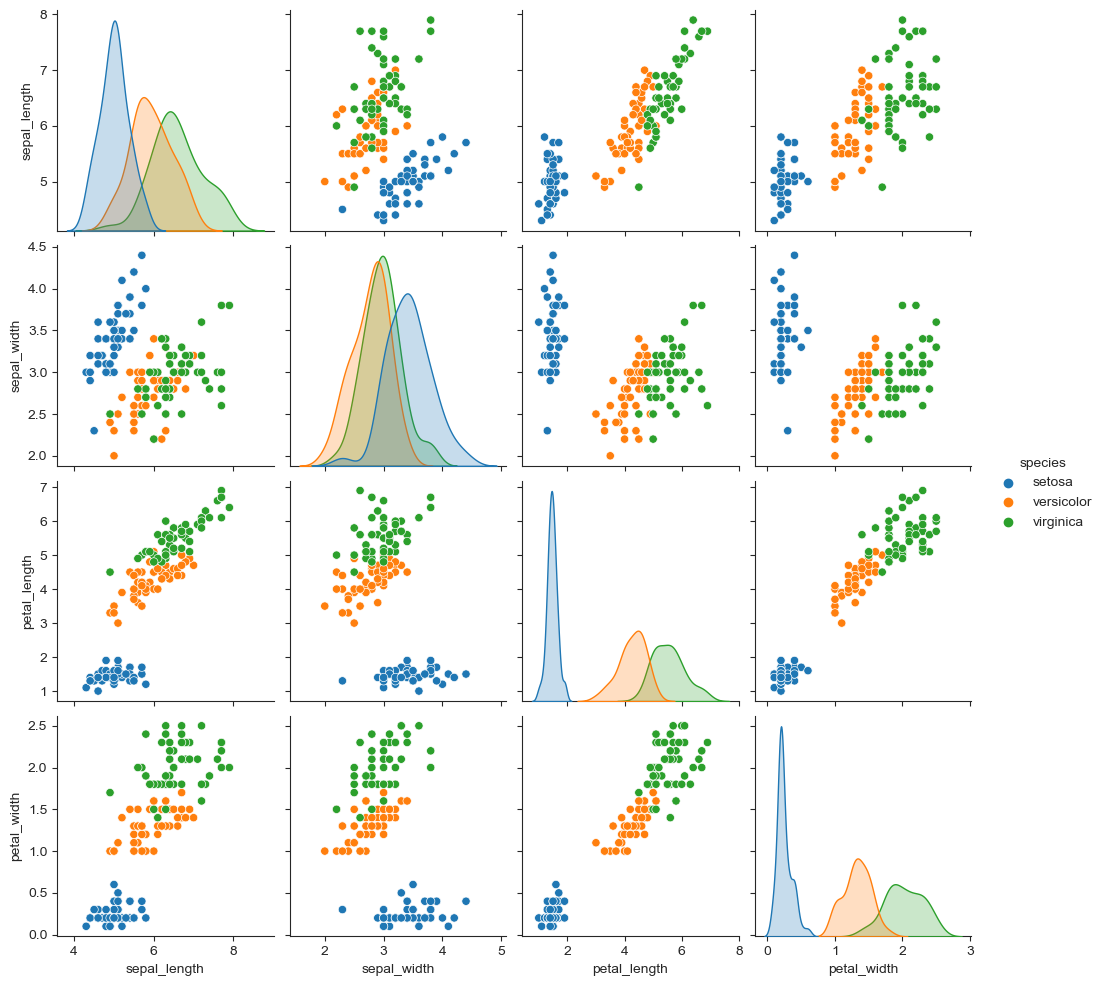
iris=sns.load_dataset('iris')
iris.tail()
| - | sepal_length | sepal_width | petal_length | petal_width | species |
|---|
| 145 | 6.7 | 3.0 | 5.2 | 2.3 | virginica |
| 146 | 6.3 | 2.5 | 5.0 | 1.9 | virginica |
| 147 | 6.5 | 3.0 | 5.2 | 2.0 | virginica |
| 148 | 6.2 | 3.4 | 5.4 | 2.3 | virginica |
| 149 | 5.9 | 3.0 | 5.1 | 1.8 | virginica |
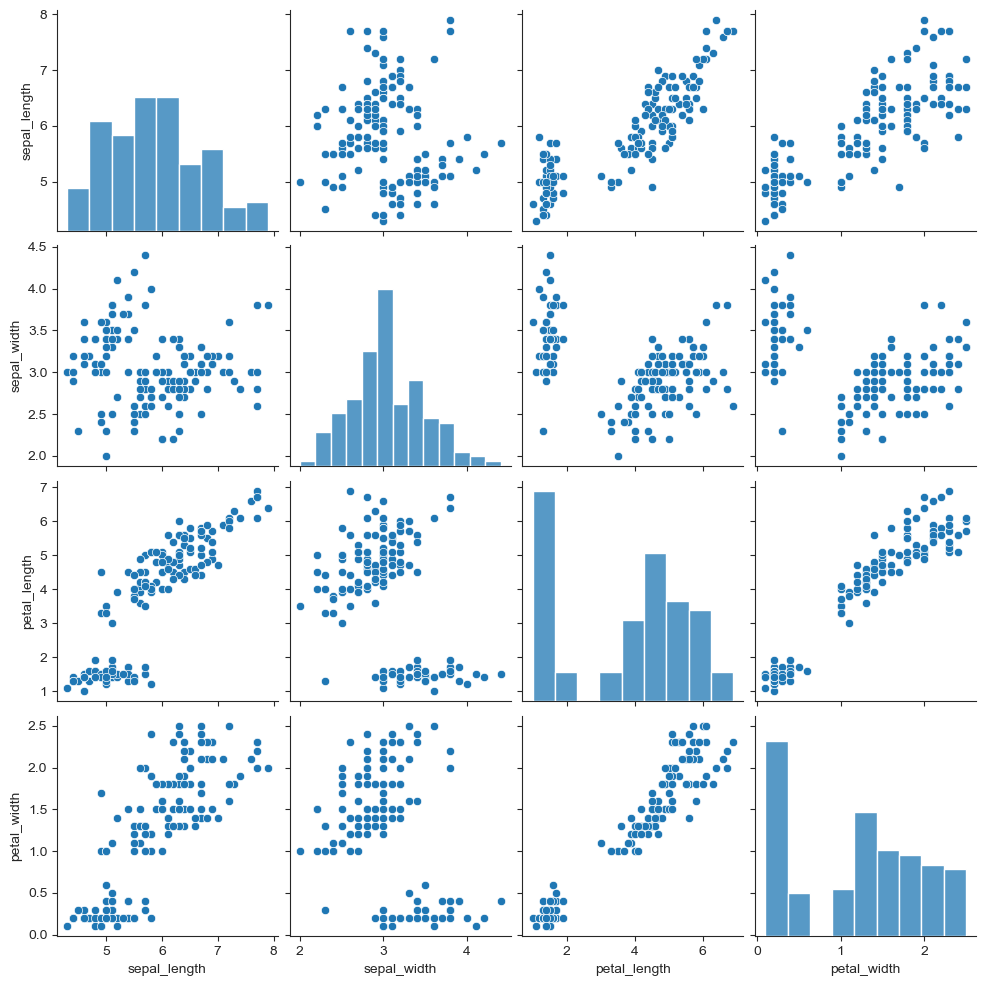
sns.set_style('ticks')
sns.pairplot(iris)
plt.show()
sns.pairplot(iris,hue='species')
plt.show()