DataSet Histogram
Before starting your project, you need to know exactly what you are going to do.
- You should read the data and understand it
- You should be able to make a histogram with your data, so you can pick better training data.
What is the total amount of data?
and how many of HTTPS and Malicious DoH each?
Read the data
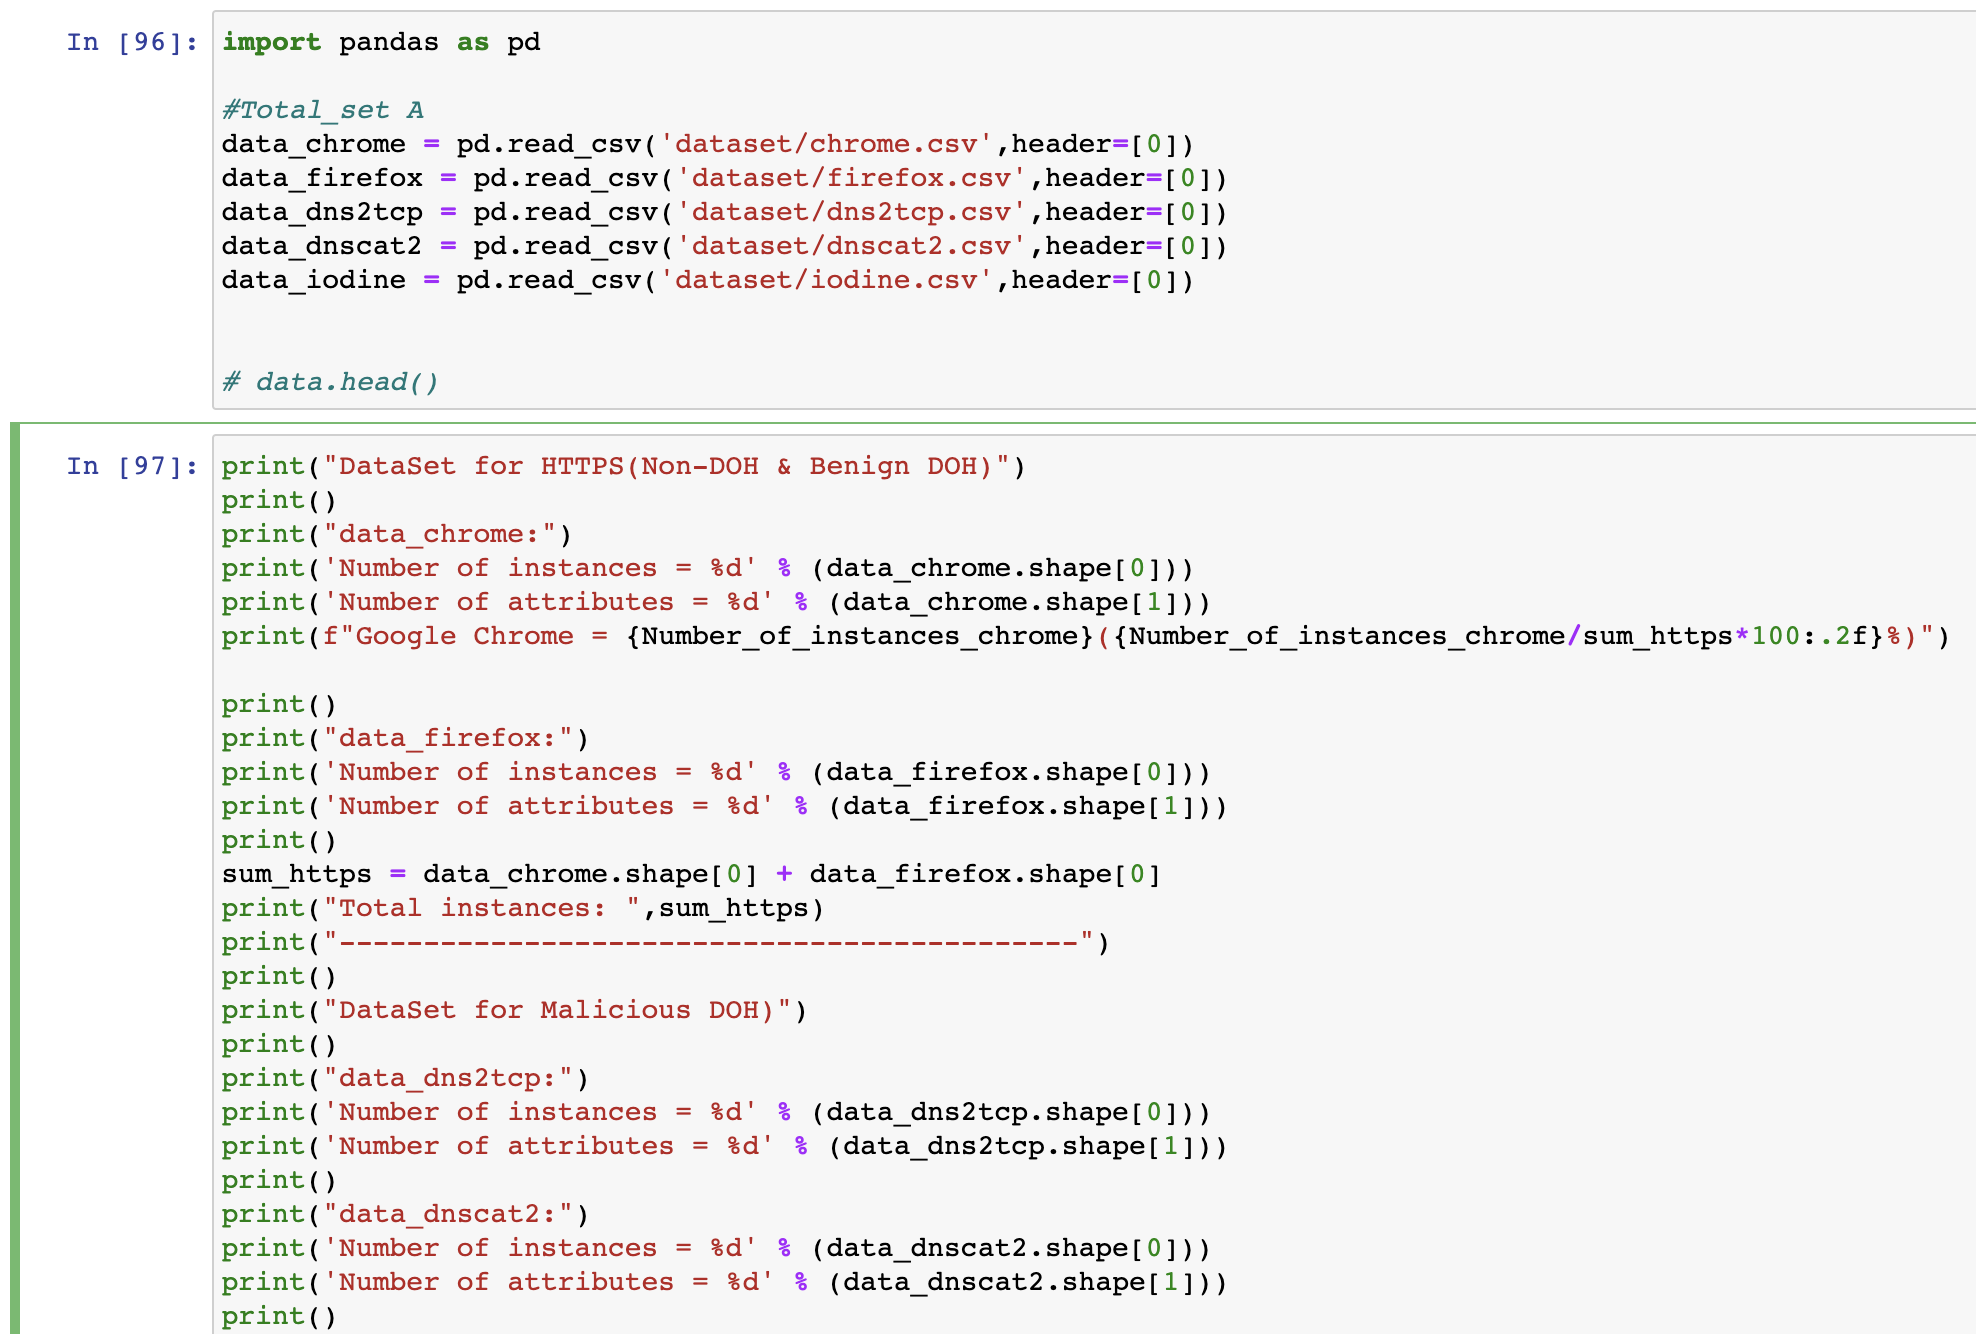
Calculate
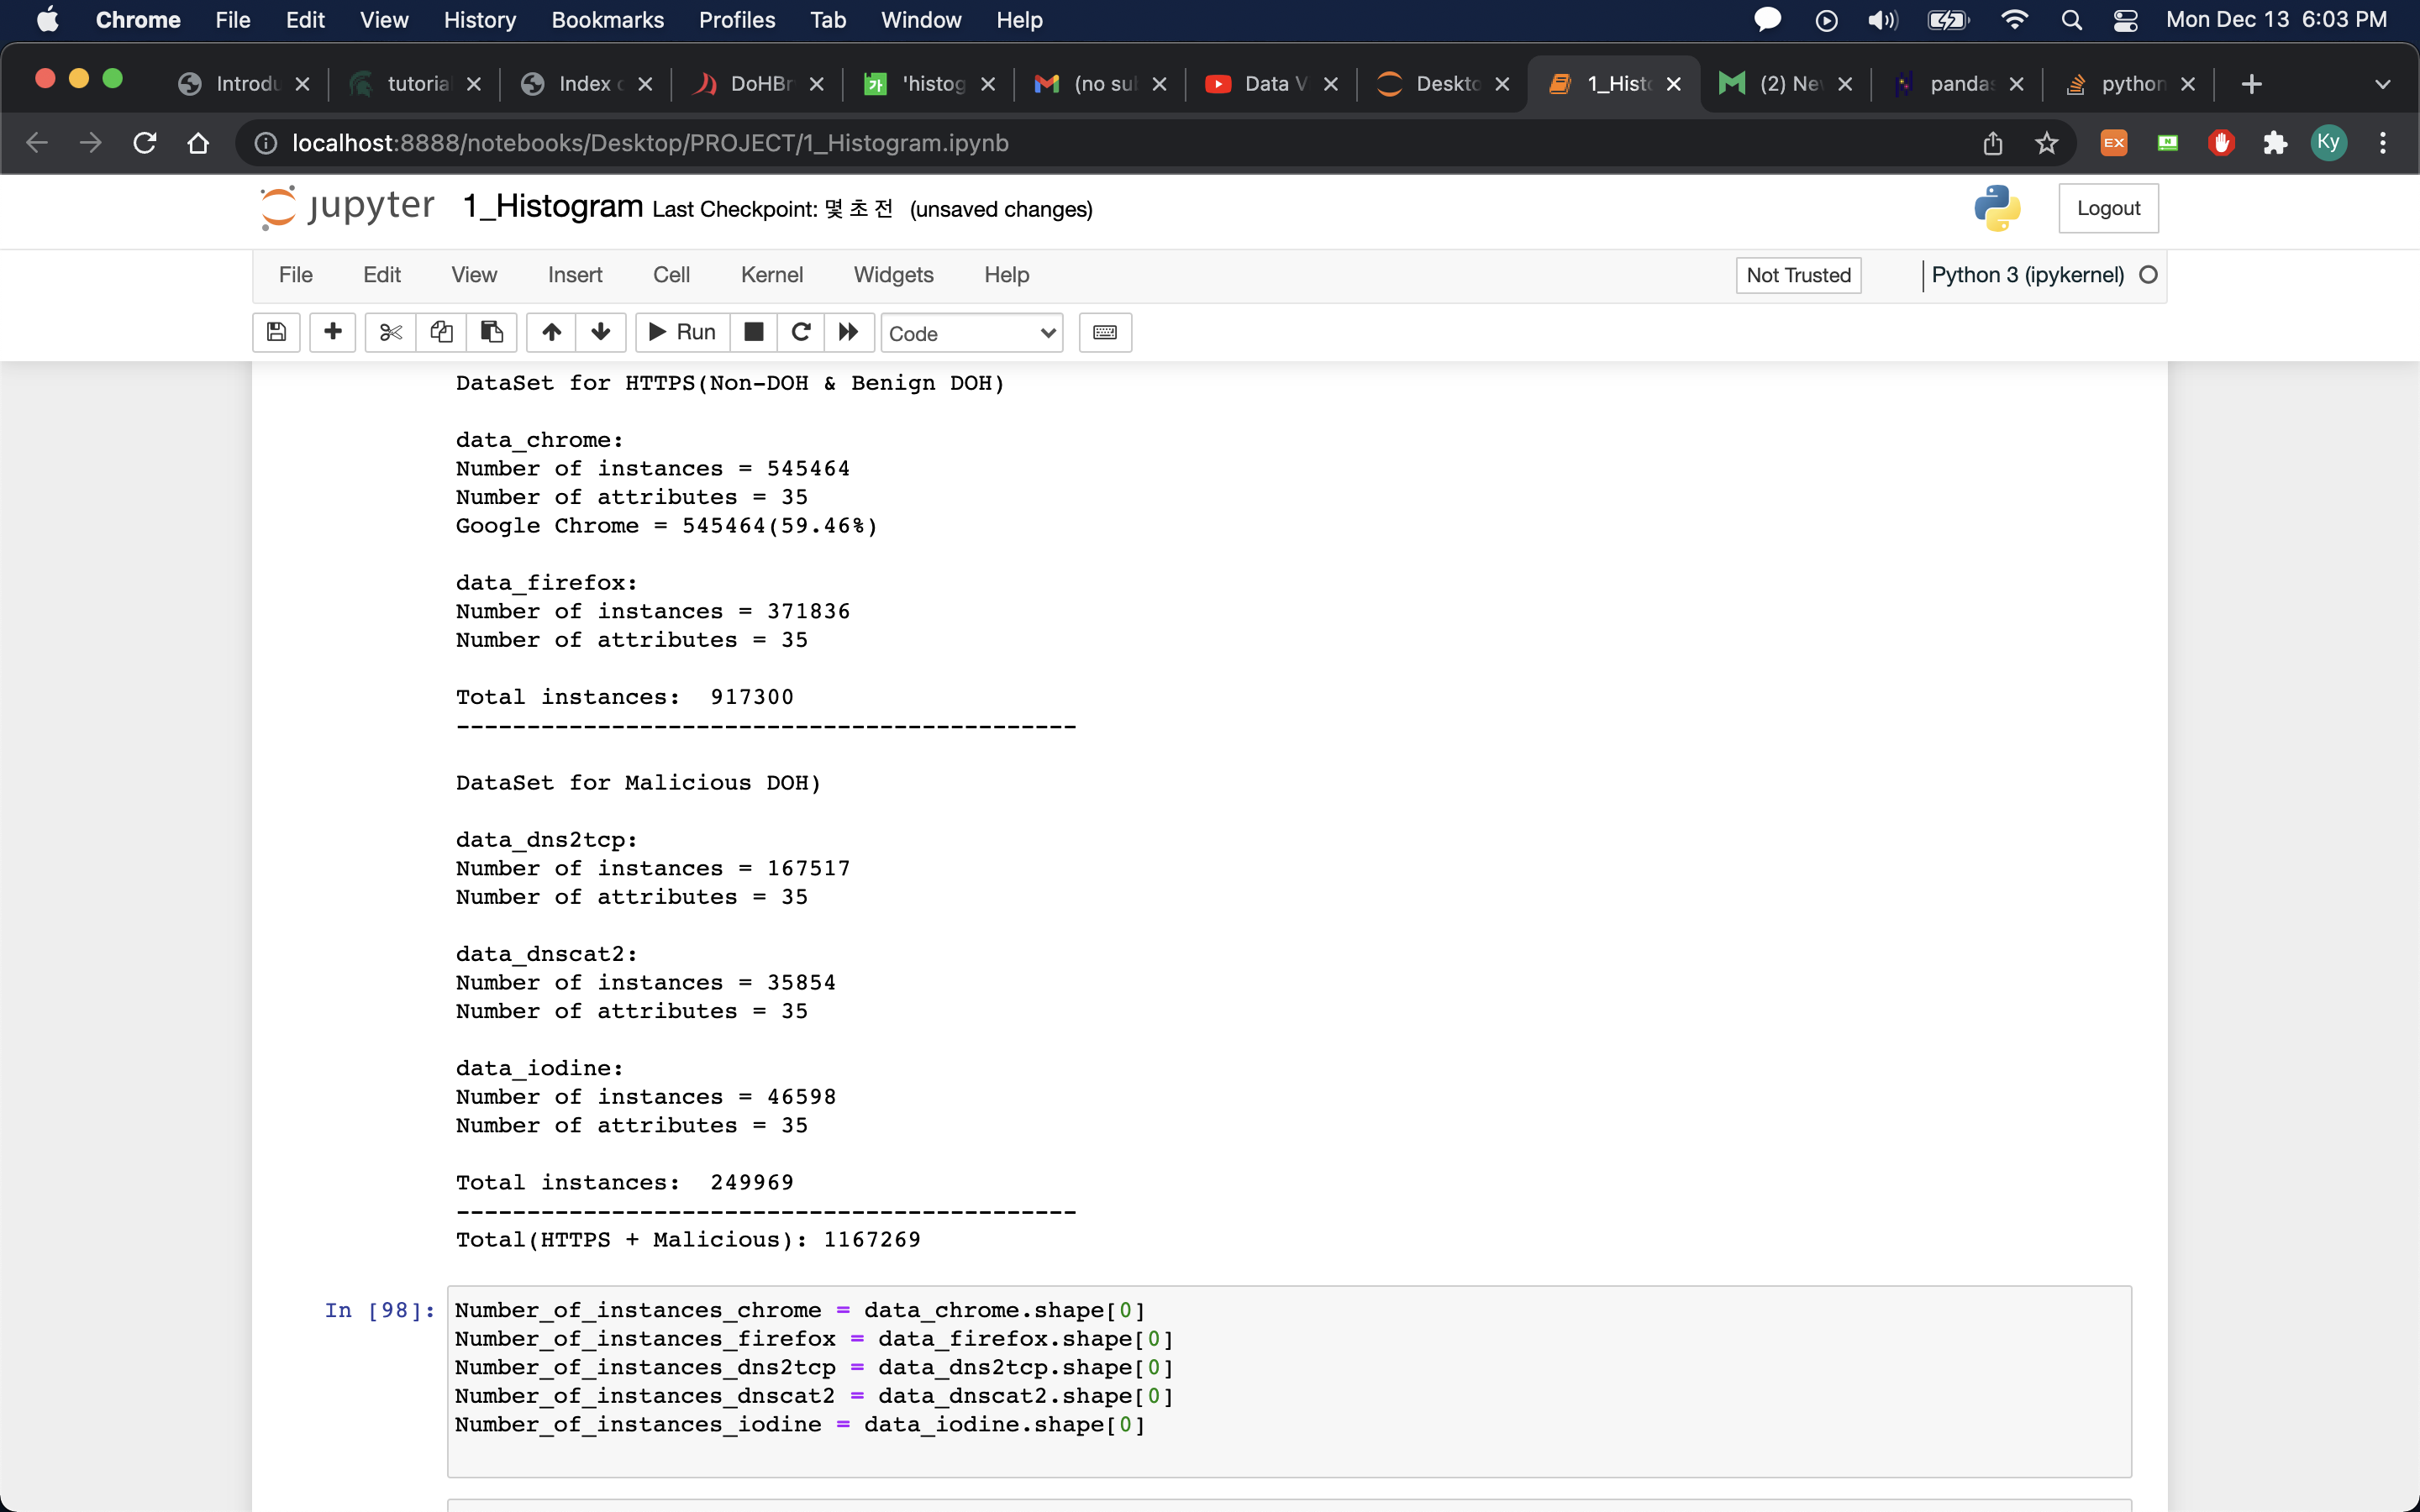
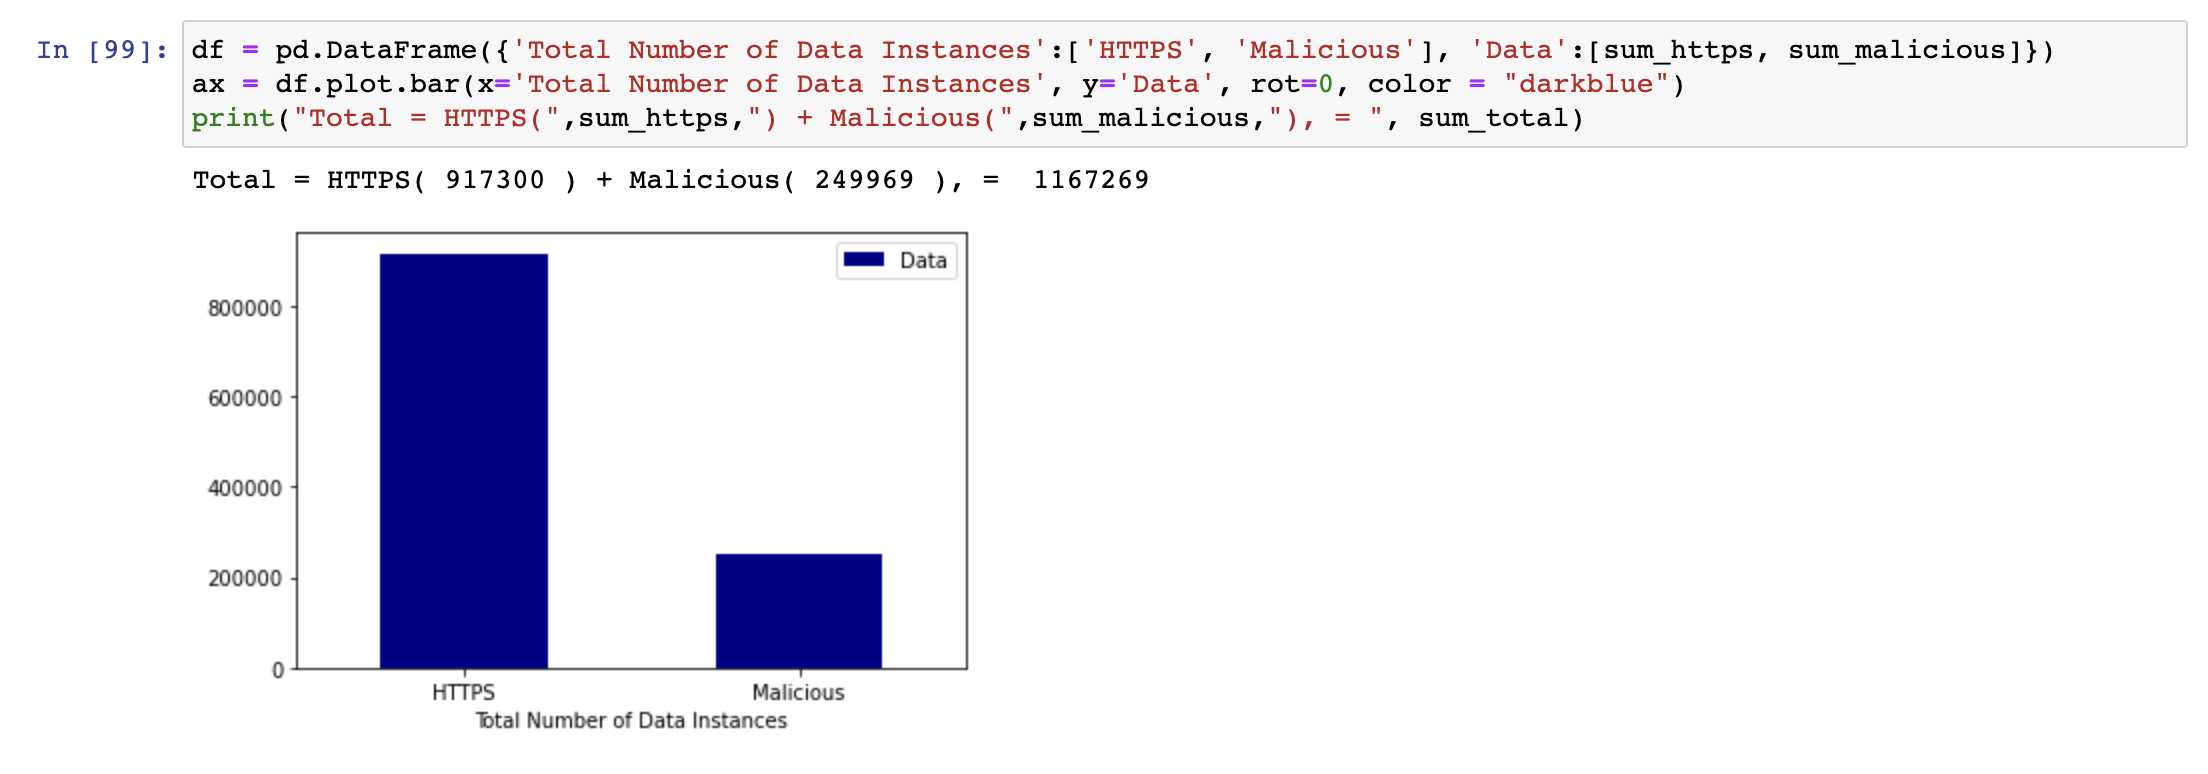
Total instances
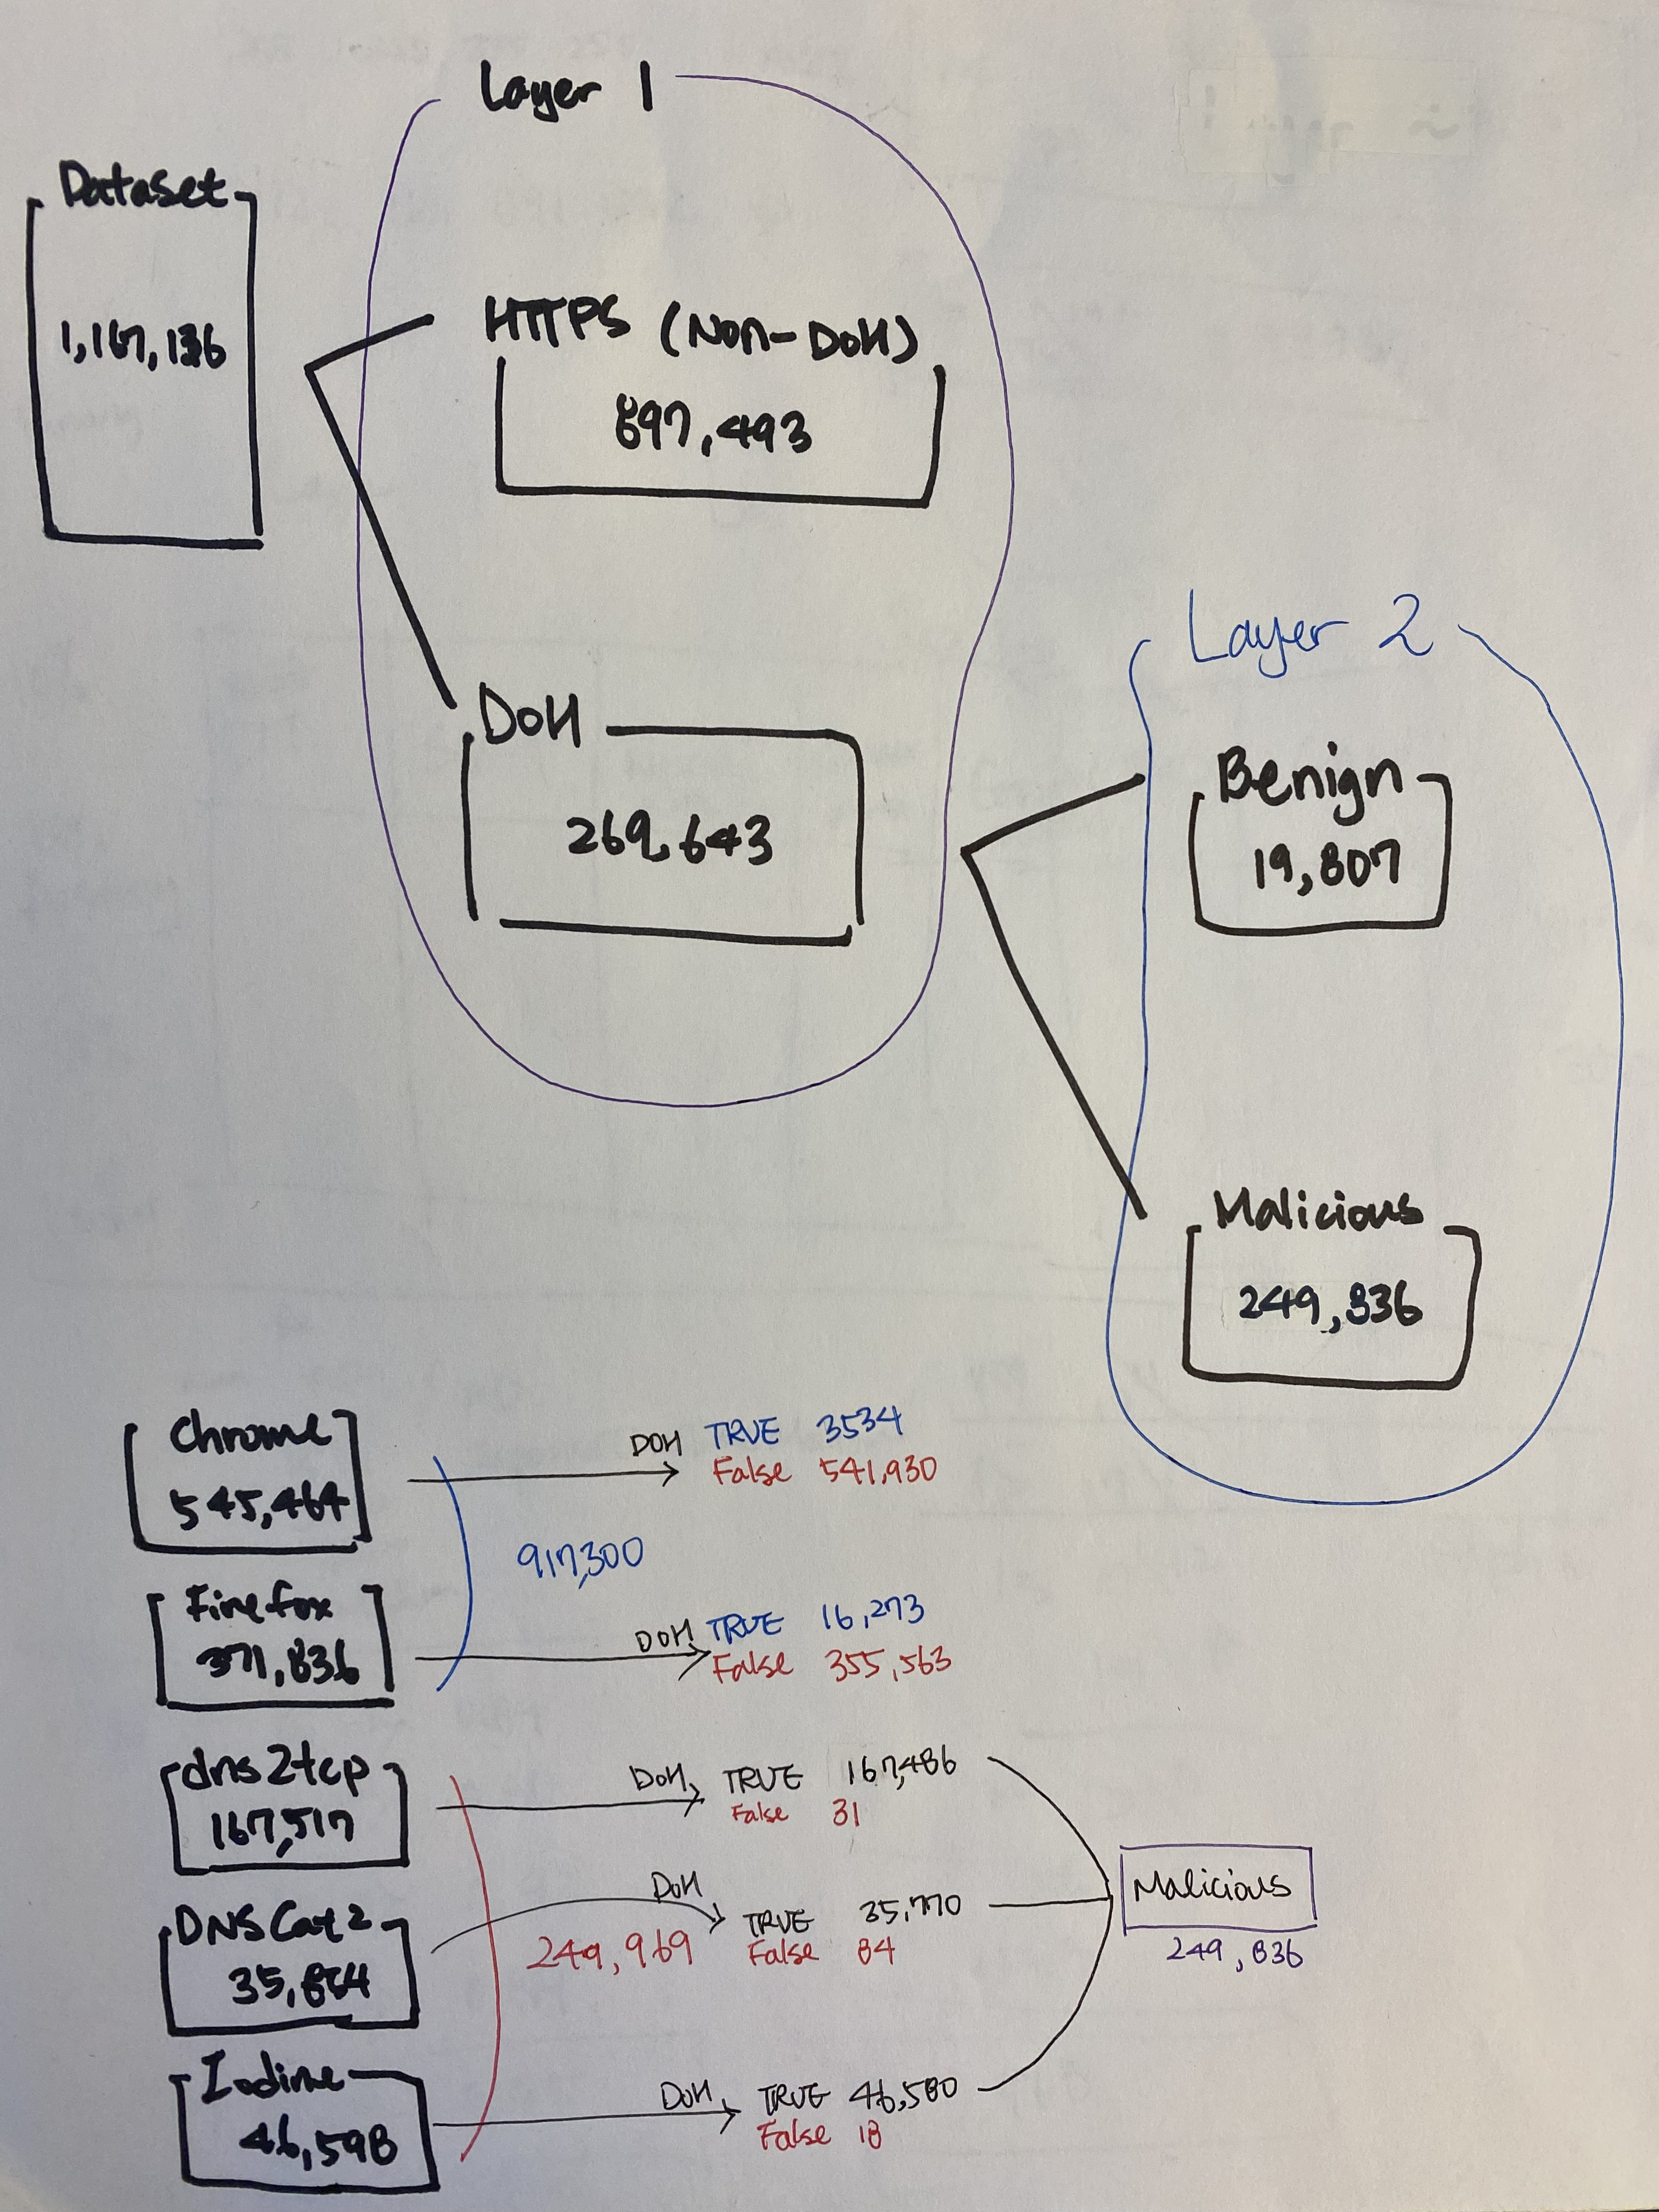
Total = 1,167,269(100%)
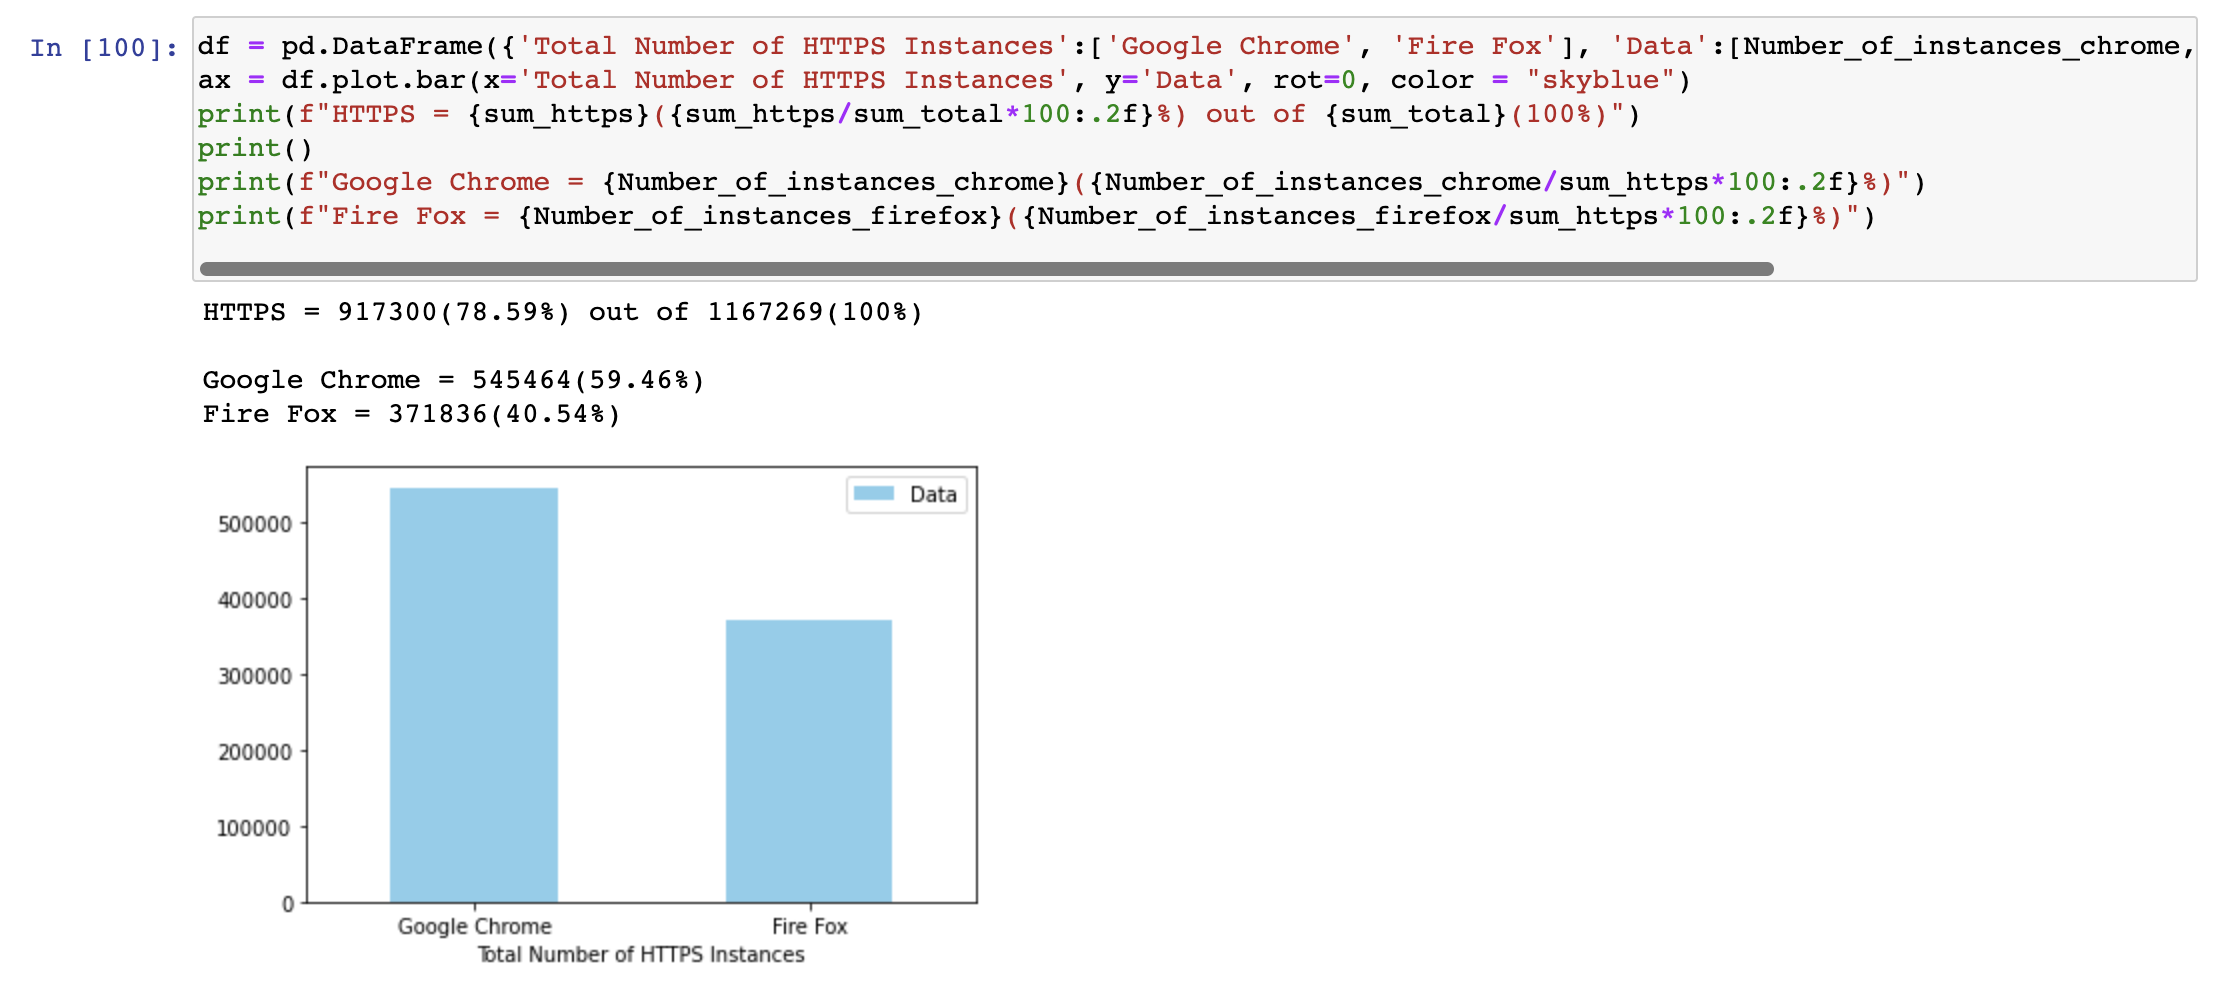
Benign = 917,300(78.59%)
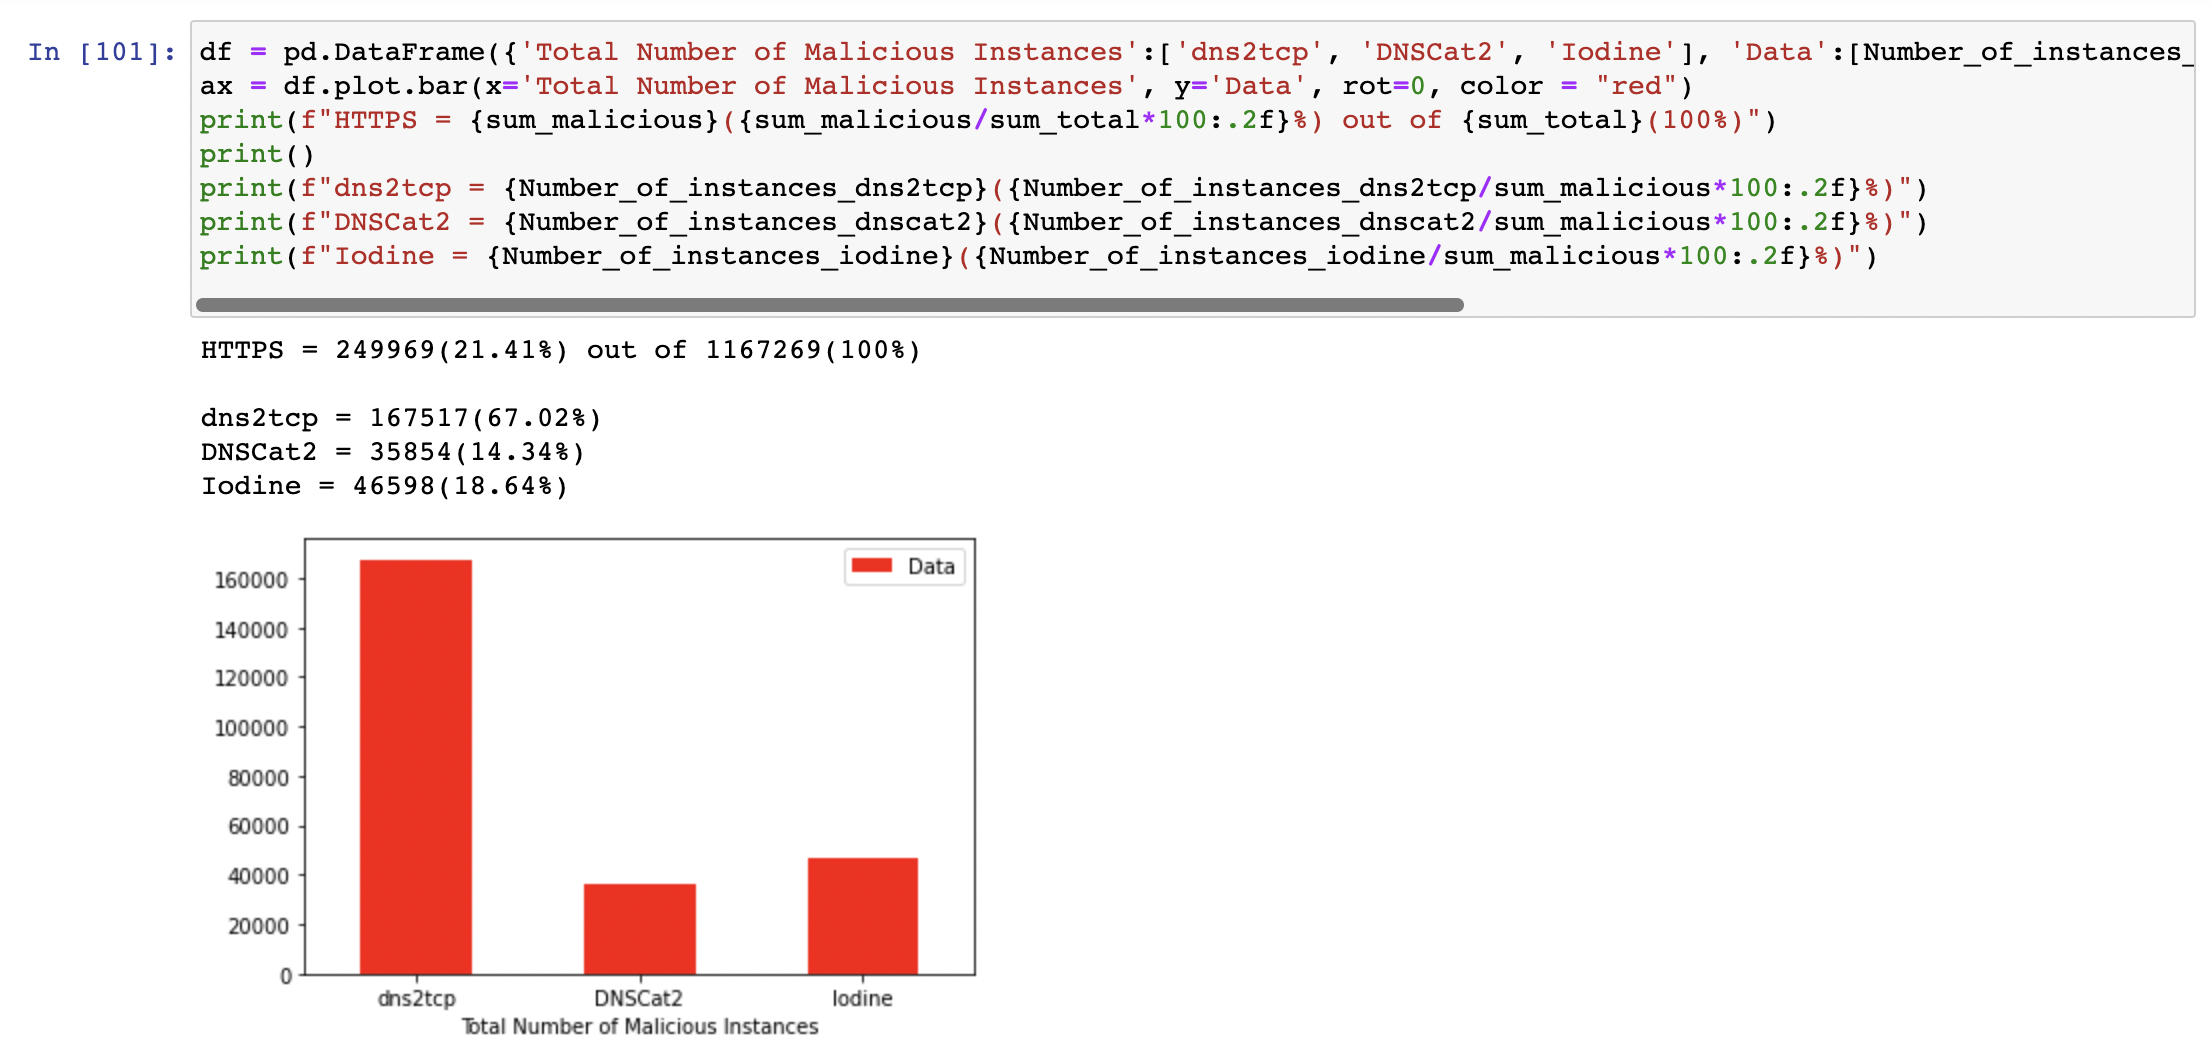
Malicious = 249,969(21.41%)
Benign:
- Google Chrome: 545,464(59.46%)
- FireFox: 371,836(40.54%)
Malicious:
- dns2tcp: 167,517(67.02%)
- DNSCat2: 35,854(14.34%)
- Iodine: 46,598(18.64%)
How are you going to build your model to train based on the histogram?
For the trainset, it is going to be randomly picked. But , it needs to be proportionally similar to its original one.
Outline

Studying for Data Analysis, Data Engineering & Data Science